
Identifier Translation and Mapping in OmnipathR
Zaoqu Liu
Department of Interventional Radiology, The First Affiliated Hospital of Zhengzhou Universityliuzaoqu@163.com
Dénes Türei
turei.denes@gmail.comJulio Saez-Rodriguez
Institute for Computational Biomedicine, Heidelberg UniversitySource:
vignettes/id_translation.Rmd
id_translation.Rmd1 Introduction
Biological databases use diverse identifier systems to reference genes, proteins, and other molecular entities. OmnipathR provides a unified framework for translating between these identifier systems, supporting seamless data integration across multiple resources.
1.1 Supported Identifier Types
OmnipathR supports translation between numerous identifier systems:
| Category | Identifier Types |
|---|---|
| Protein | UniProt AC, UniProt ID, RefSeq |
| Gene | HGNC Symbol, Entrez Gene ID, Ensembl Gene ID |
| Transcript | Ensembl Transcript ID, RefSeq mRNA |
| Peptide | Ensembl Peptide ID |
| External | KEGG, Reactome, PDB, InterPro |
2 Theoretical Framework
2.1 Identifier Mapping Architecture
The identifier translation in OmnipathR follows a hub-and-spoke model:
                    ┌─────────────┐
                    │   UniProt   │
                    │   (Hub)     │
                    └──────┬──────┘
           ┌───────────────┼───────────────┐
           │               │               │
    ┌──────▼──────┐ ┌──────▼──────┐ ┌──────▼──────┐
    │   Ensembl   │ │    HGNC     │ │   Entrez    │
    │   Gene ID   │ │   Symbol    │ │   Gene ID   │
    └─────────────┘ └─────────────┘ └─────────────┘
2.2 Handling Ambiguous Mappings
Identifier mappings can be:
- One-to-one: Single source maps to single target
- One-to-many: Single source maps to multiple targets (e.g., gene with multiple isoforms)
- Many-to-one: Multiple sources map to single target (e.g., synonyms)
- Many-to-many: Complex relationships
OmnipathR provides tools to quantify and handle these ambiguities.
3 Basic Usage
3.1 Simple Vector Translation
# Translate UniProt IDs to gene symbols
uniprot_ids <- c("P00533", "P04637", "P31749", "P42345")

# Using translate_ids with vector input
result <- translate_ids(
    uniprot_ids,
    uniprot,
    genesymbol
)

print(result)
#> [1] "EGFR" "TP53" "AKT1" "MTOR"
3.2 Data Frame Translation
# Create example data frame
expression_data <- tibble(
    uniprot = c("P00533", "P04637", "P31749", "P42345", "P06400"),
    log2fc = c(2.5, -1.8, 1.2, 0.8, -2.1),
    pvalue = c(0.001, 0.005, 0.02, 0.15, 0.003)
)

# Add gene symbol column
expression_annotated <- translate_ids(
    expression_data,
    uniprot,
    genesymbol
)

print(expression_annotated)
#> # A tibble: 5 x 4
#>   uniprot log2fc pvalue genesymbol
#>   <chr>    <dbl>  <dbl> <chr>
#> 1 P00533     2.5  0.001 EGFR
#> 2 P04637    -1.8  0.005 TP53
#> 3 P31749     1.2  0.02  AKT1
#> 4 P42345     0.8  0.15  MTOR
#> 5 P06400    -2.1  0.003 RB1
4 Visualization of Translation Results
# Visualize translated data
if(nrow(expression_annotated) > 0 && "genesymbol" %in% colnames(expression_annotated)) {
    plot_data <- expression_annotated %>%
        filter(!is.na(genesymbol))

    if(nrow(plot_data) > 0) {
        ggplot(plot_data, aes(x = reorder(genesymbol, log2fc), y = log2fc, fill = log2fc > 0)) +
            geom_col(alpha = 0.8) +
            geom_hline(yintercept = 0, linetype = "dashed", color = "gray50") +
            scale_fill_manual(values = c("TRUE" = "#E74C3C", "FALSE" = "#3498DB"), guide = "none") +
            coord_flip() +
            labs(
                title = "Differential Expression",
                subtitle = "UniProt IDs translated to gene symbols",
                x = "Gene Symbol",
                y = "Log2 Fold Change"
            ) +
            theme_minimal() +
            theme(plot.title = element_text(face = "bold"))
    }
}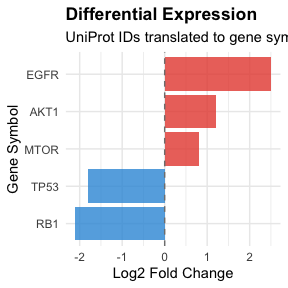
Figure 4.1: Expression data with translated gene symbols showing log2 fold change values.
5 Advanced Translation Features
5.1 Organism-Specific Translation
# Human protein translation (default)
human_result <- translate_ids(
    c("P00533", "P04637"),
    uniprot,
    genesymbol,
    organism = 9606  # Human NCBI Taxonomy ID
)

print(human_result)
#> [1] "EGFR" "TP53"
6 Integration with OmniPath Data
6.1 Annotating Interaction Data
# Get interactions
interactions <- omnipath(resources = "SIGNOR")

# Check columns
cat("Interaction columns:", paste(head(colnames(interactions), 10), collapse = ", "), "...\n")
#> Interaction columns: source, target, source_genesymbol, target_genesymbol, is_directed, is_stimulation, is_inhibition, consensus_direction, consensus_stimulation, consensus_inhibition ...
cat("Total interactions:", nrow(interactions), "\n")
#> Total interactions: 65532

# Show sample with gene symbols
interactions %>%
    select(source, source_genesymbol, target, target_genesymbol) %>%
    head(10)
#> # A tibble: 10 x 4
#>    source source_genesymbol target target_genesymbol
#>    <chr>  <chr>             <chr>  <chr>
#>  1 Q13976 PRKG1             Q13507 TRPC3
#>  2 P06241 FYN               Q9Y210 TRPC6
#>  3 Q13976 PRKG1             Q9Y210 TRPC6
#>  4 P12931 SRC               Q9Y210 TRPC6
#>  5 Q13976 PRKG1             Q9HCX4 TRPC7
#>  6 Q00535 CDK5              Q8NER1 TRPV1
#>  7 Q13438 OS9               Q9HBA0 TRPV4
#>  8 P18031 PTPN1             Q9H1D0 TRPV6
#>  9 P63244 RACK1             Q9BX84 TRPM6
#> 10 Q9BX84 TRPM6             Q96QT4 TRPM7
7 Mapping Statistics
# Get all UniProts from interactions
all_uniprots <- unique(c(interactions$source, interactions$target))
cat("Unique proteins in network:", length(all_uniprots), "\n")
#> Unique proteins in network: 6258

# Sample translation
sample_uniprots <- head(all_uniprots, 100)
sample_translated <- translate_ids(
    data.frame(uniprot = sample_uniprots),
    uniprot,
    genesymbol
)

# Calculate success rate
success_rate <- sum(!is.na(sample_translated$genesymbol)) / nrow(sample_translated) * 100
cat("Translation success rate:", round(success_rate, 1), "%\n")
#> Translation success rate: 100 %

# Visualize
mapping_summary <- data.frame(
    Status = c("Translated", "Not Found"),
    Count = c(sum(!is.na(sample_translated$genesymbol)),
              sum(is.na(sample_translated$genesymbol)))
)

ggplot(mapping_summary, aes(x = Status, y = Count, fill = Status)) +
    geom_col(alpha = 0.8) +
    geom_text(aes(label = Count), vjust = -0.5) +
    scale_fill_manual(values = c("Translated" = "#27AE60", "Not Found" = "#E74C3C")) +
    labs(
        title = "ID Translation Results",
        subtitle = paste("Sample of", length(sample_uniprots), "UniProt IDs"),
        y = "Number of IDs"
    ) +
    theme_minimal() +
    theme(
        plot.title = element_text(face = "bold"),
        legend.position = "none"
    ) +
    expand_limits(y = max(mapping_summary$Count) * 1.1)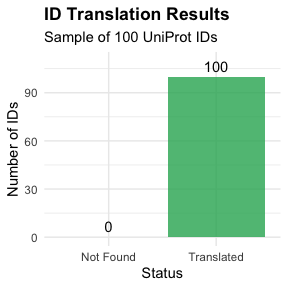
Figure 7.1: Distribution of identifier mapping success rates across different resources.
8 Session Information
sessionInfo()
#> R version 4.4.0 (2024-04-24)
#> Platform: aarch64-apple-darwin20
#> Running under: macOS 15.6.1
#>
#> Matrix products: default
#> BLAS:   /Library/Frameworks/R.framework/Versions/4.4-arm64/Resources/lib/libRblas.0.dylib
#> LAPACK: /Library/Frameworks/R.framework/Versions/4.4-arm64/Resources/lib/libRlapack.dylib;  LAPACK version 3.12.0
#>
#> locale:
#> [1] C
#>
#> time zone: Asia/Shanghai
#> tzcode source: internal
#>
#> attached base packages:
#> [1] stats     graphics  grDevices utils     datasets  methods   base
#>
#> other attached packages:
#> [1] ggplot2_4.0.1    tibble_3.3.1     dplyr_1.1.4      OmnipathR_3.19.1
#>
#> loaded via a namespace (and not attached):
#>  [1] gtable_0.3.6       xfun_0.56          bslib_0.9.0        httr2_1.2.2
#>  [5] htmlwidgets_1.6.4  websocket_1.4.4    processx_3.8.6     tzdb_0.5.0
#>  [9] vctrs_0.7.0        tools_4.4.0        ps_1.9.1           generics_0.1.4
#> [13] curl_7.0.0         RSQLite_2.4.5      blob_1.2.4         pkgconfig_2.0.3
#> [17] R.oo_1.27.1        checkmate_2.3.3    RColorBrewer_1.1-3 S7_0.2.1
#> [21] readxl_1.4.5       lifecycle_1.0.5    farver_2.1.2       compiler_4.4.0
#> [25] stringr_1.6.0      progress_1.2.3     chromote_0.5.1     htmltools_0.5.9
#> [29] sass_0.4.10        yaml_2.3.12        later_1.4.5        pillar_1.11.1
#> [33] crayon_1.5.3       jquerylib_0.1.4    tidyr_1.3.2        R.utils_2.13.0
#> [37] cachem_1.1.0       sessioninfo_1.2.3  zip_2.3.3          tidyselect_1.2.1
#> [41] rvest_1.0.5        digest_0.6.39      stringi_1.8.7      purrr_1.2.1
#> [45] bookdown_0.44      labeling_0.4.3     grid_4.4.0         fastmap_1.2.0
#> [49] cli_3.6.5          logger_0.4.1       magrittr_2.0.4     utf8_1.2.6
#> [53] dichromat_2.0-0.1  XML_3.99-0.20      withr_3.0.2        readr_2.1.6
#> [57] scales_1.4.0       prettyunits_1.2.0  promises_1.5.0     backports_1.5.0
#> [61] rappdirs_0.3.4     bit64_4.6.0-1      lubridate_1.9.4    timechange_0.3.0
#> [65] rmarkdown_2.30     httr_1.4.7         igraph_2.2.1       bit_4.6.0
#> [69] otel_0.2.0         cellranger_1.1.0   R.methodsS3_1.8.2  hms_1.1.4
#> [73] memoise_2.0.1      evaluate_1.0.5     knitr_1.51         tcltk_4.4.0
#> [77] rlang_1.1.7        Rcpp_1.1.1         glue_1.8.0         DBI_1.2.3
#> [81] selectr_0.5-1      xml2_1.5.2         vroom_1.6.7        jsonlite_2.0.0
#> [85] R6_2.6.1           fs_1.6.6
9 References
Türei D, et al. Integrated intra- and intercellular signaling knowledge for multicellular omics analysis. Molecular Systems Biology 2021;17:e9923.
The UniProt Consortium. UniProt: the universal protein knowledgebase in 2021. Nucleic Acids Research 2021;49:D480-D489.
Cunningham F, et al. Ensembl 2022. Nucleic Acids Research 2022;50:D988-D995.