Visualization Gallery
Zaoqu Liu
2026-01-24
Source:vignettes/visualization-gallery.Rmd
visualization-gallery.RmdIntroduction
MultiNicheNet provides a comprehensive suite of visualization functions for exploring and communicating cell-cell communication analysis results. This gallery showcases all major plot types with example code.
Overview of Visualization Functions
| Function | Description | Use Case |
|---|---|---|
make_sample_lr_prod_plots |
L-R product across samples | Sample-level patterns |
make_ligand_receptor_lfc_plot |
Log fold change visualization | DE comparison |
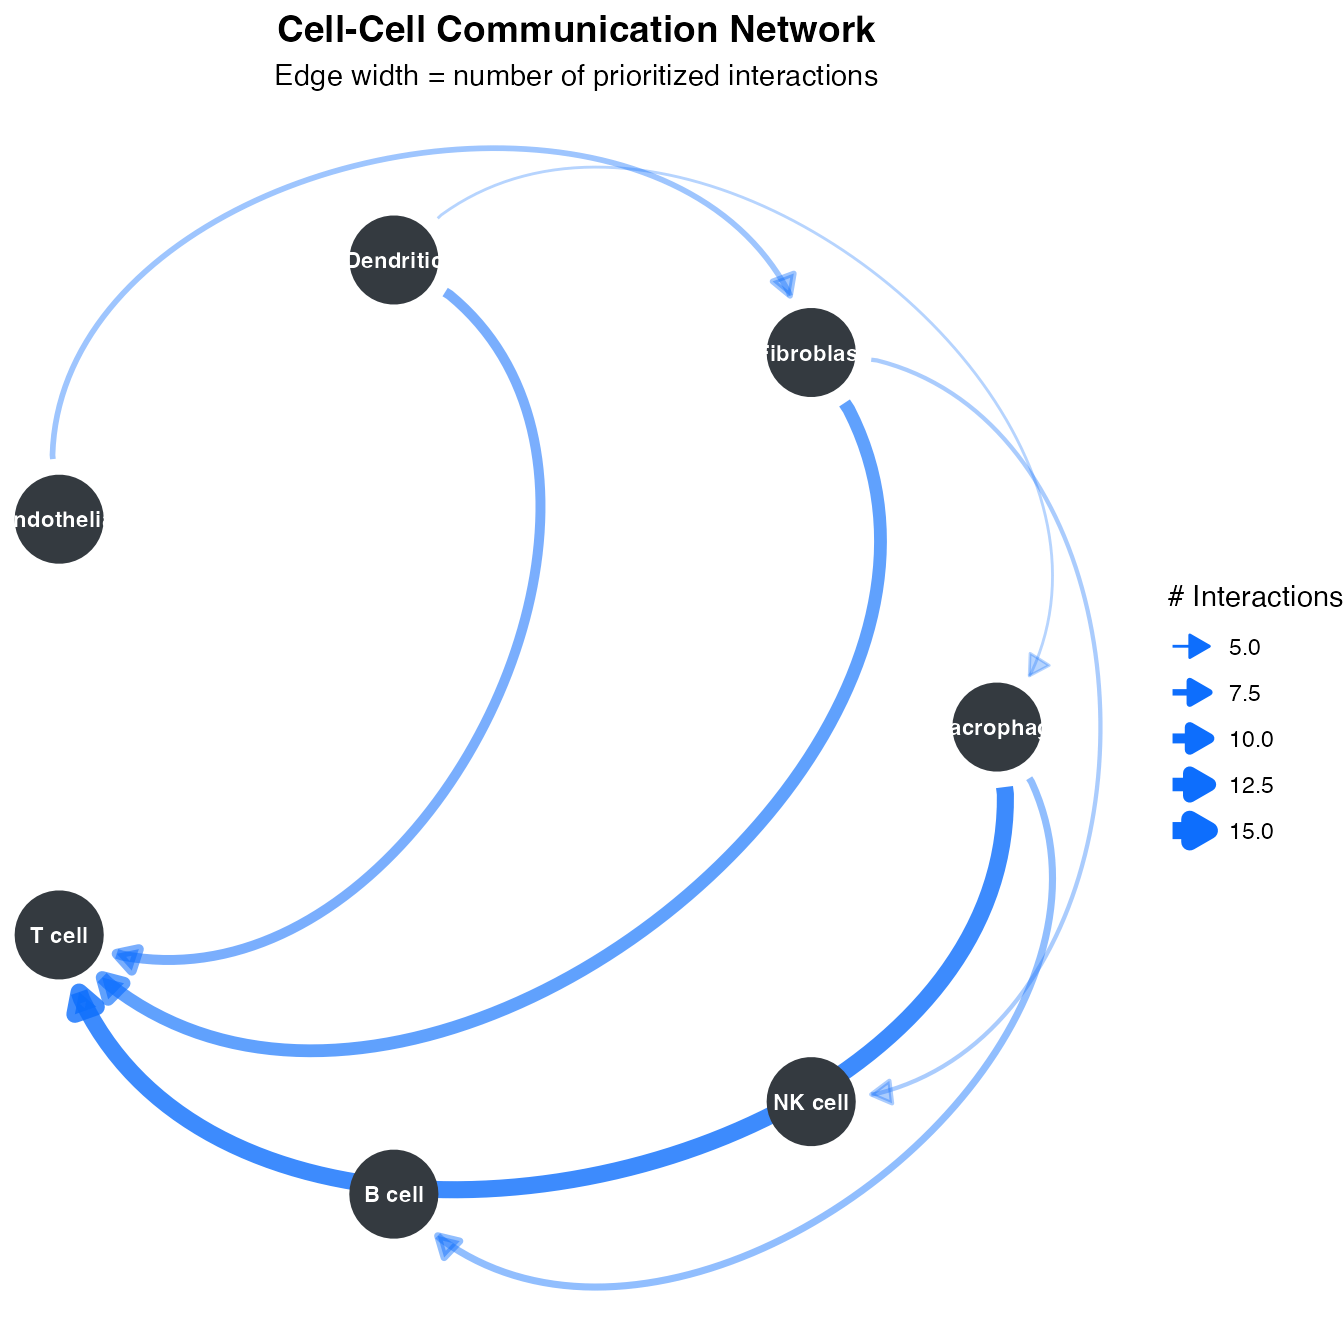
make_circos_lr |
Circos plot of interactions | Network overview |
make_mushroom_plot |
Mushroom-style bubble plot | Multi-criteria display |
make_ligand_activity_plots |
Ligand activity heatmaps | Activity inference |
make_target_gene_plots |
Target gene expression | Downstream effects |
Sample-Level Visualizations
Ligand-Receptor Product Plots
The L-R product plot shows the combined expression of ligand-receptor pairs across samples:
library(multinichenetr)
library(dplyr)

# Load example output (from your analysis)
# output <- multi_nichenet_analysis(...)

# Select top interactions
prioritized_tbl <- output$prioritization_tables$group_prioritization_tbl %>%
  filter(fraction_expressing_ligand_receptor > 0) %>%
  filter(group == "High") %>%
  top_n(15, prioritization_score)

# Create L-R product plot
p_lr_prod <- make_sample_lr_prod_plots(
  output$prioritization_tables,
  prioritized_tbl
)
print(p_lr_prod)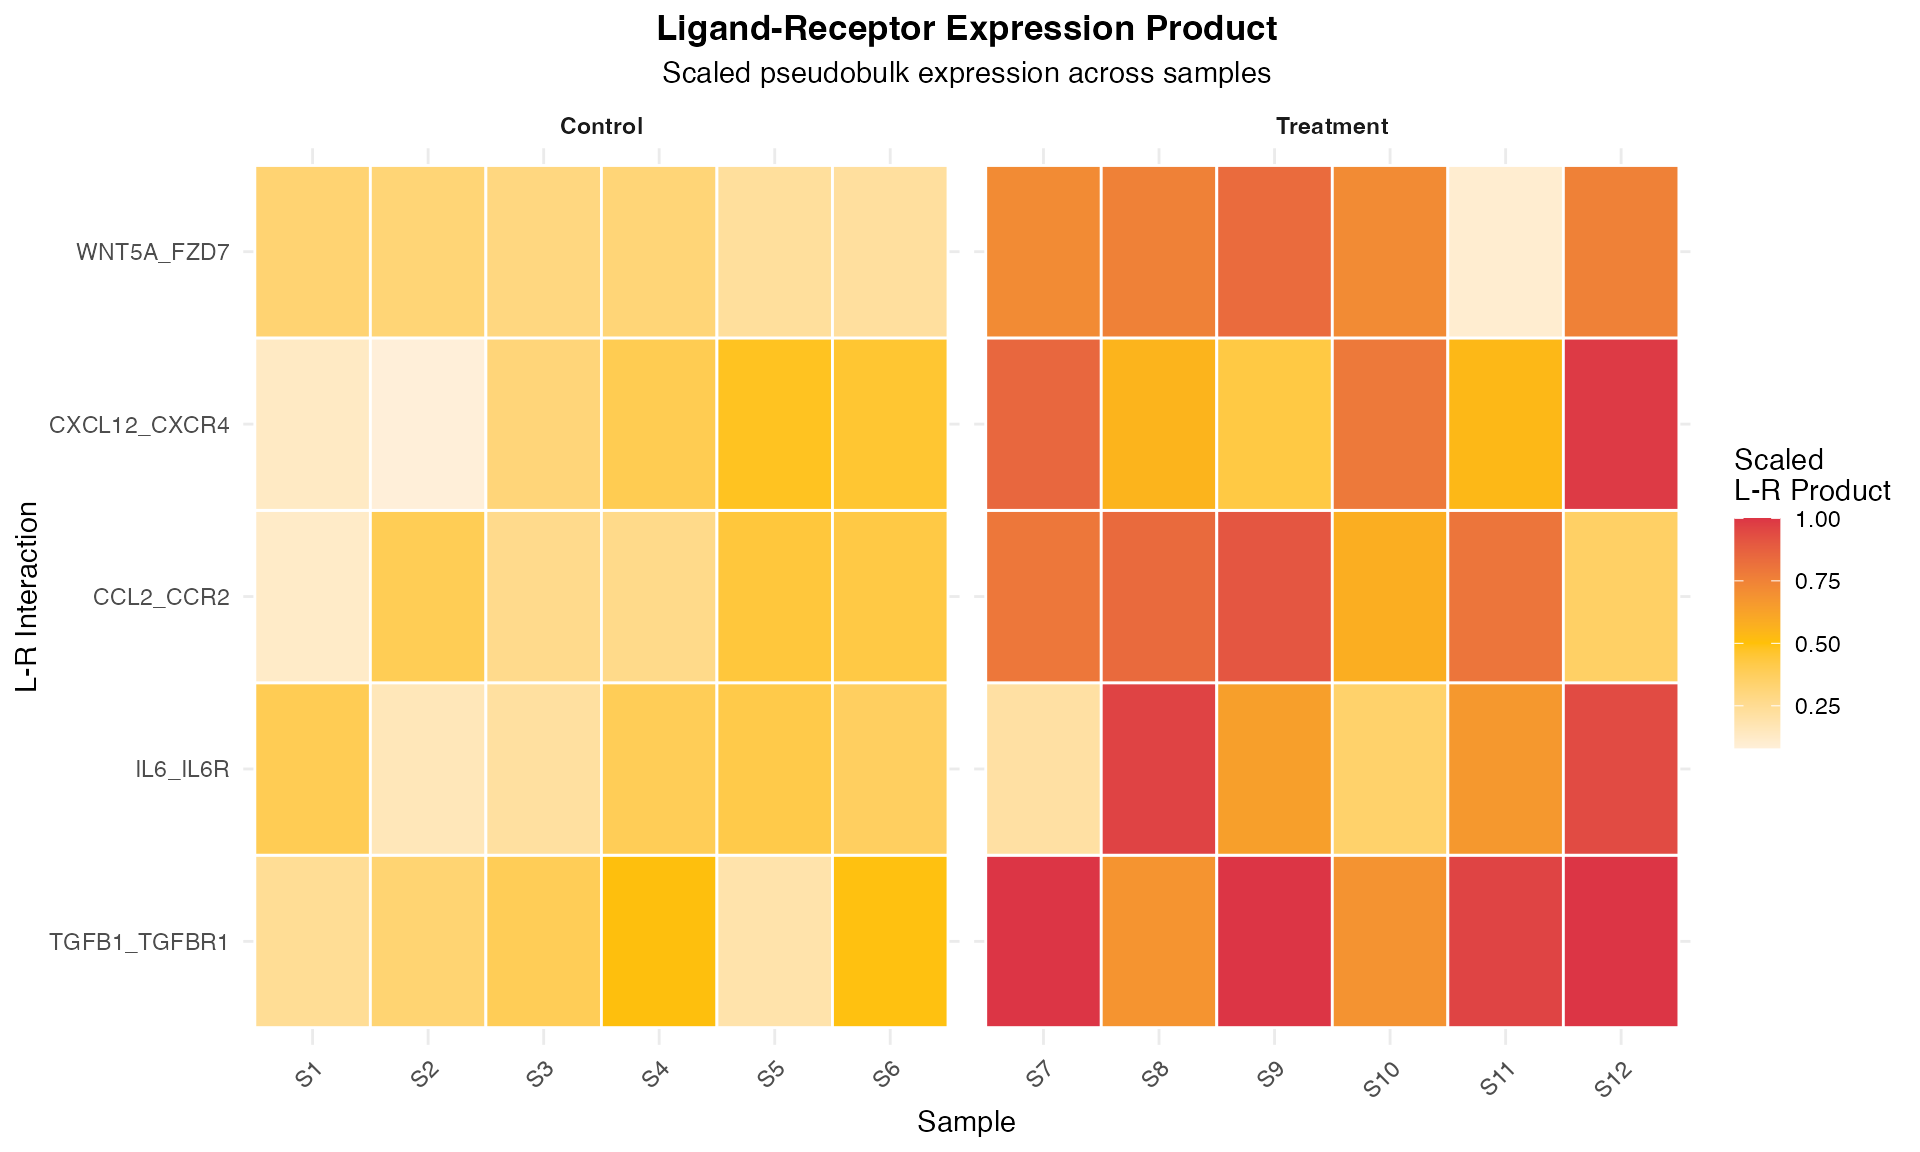
Differential Expression Visualization
# Log fold change plot for ligands and receptors
p_lfc <- make_ligand_receptor_lfc_plot(
  receiver_de = output$ligand_activities_targets_DEgenes$receiver_de,
  prioritized_tbl = prioritized_tbl,
  contrast_oi = "High-Low"
)
print(p_lfc)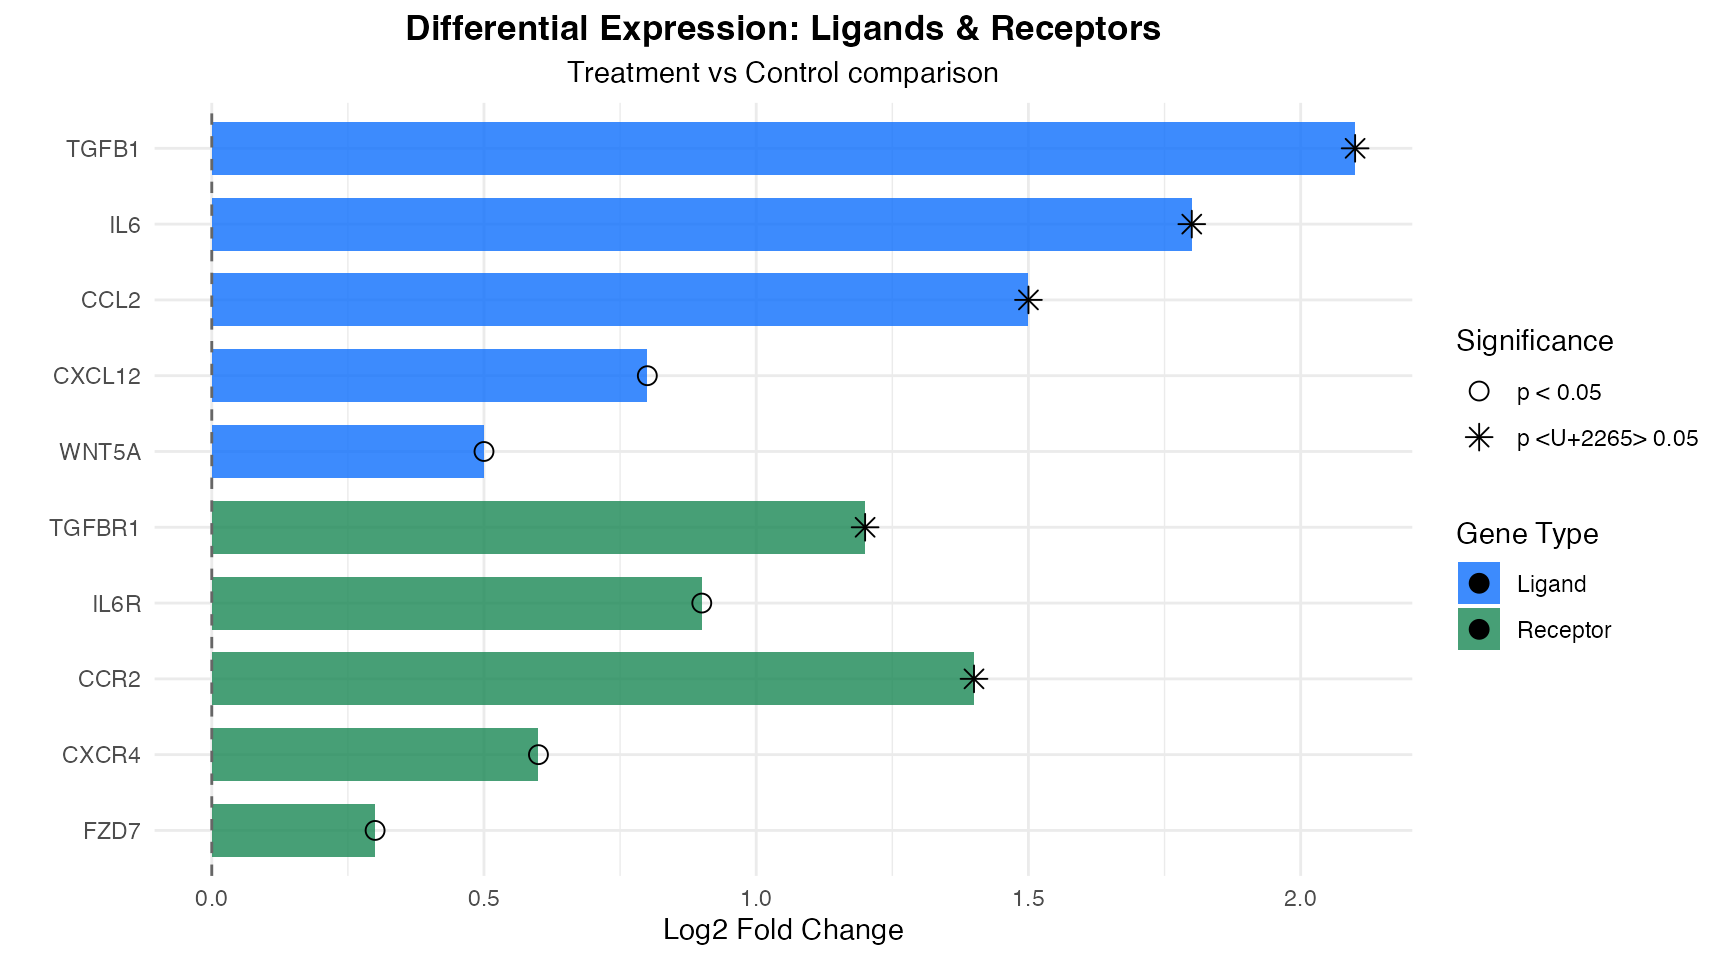
Network Visualizations
Multi-Criteria Bubble Plots
Mushroom Plots
The mushroom plot is a signature visualization of MultiNicheNet, displaying multiple criteria simultaneously:
# Create mushroom plot
p_mushroom <- make_mushroom_plot(
  prioritization_tables = output$prioritization_tables,
  top_n = 20,
  contrast_oi = "High-Low"
)
print(p_mushroom)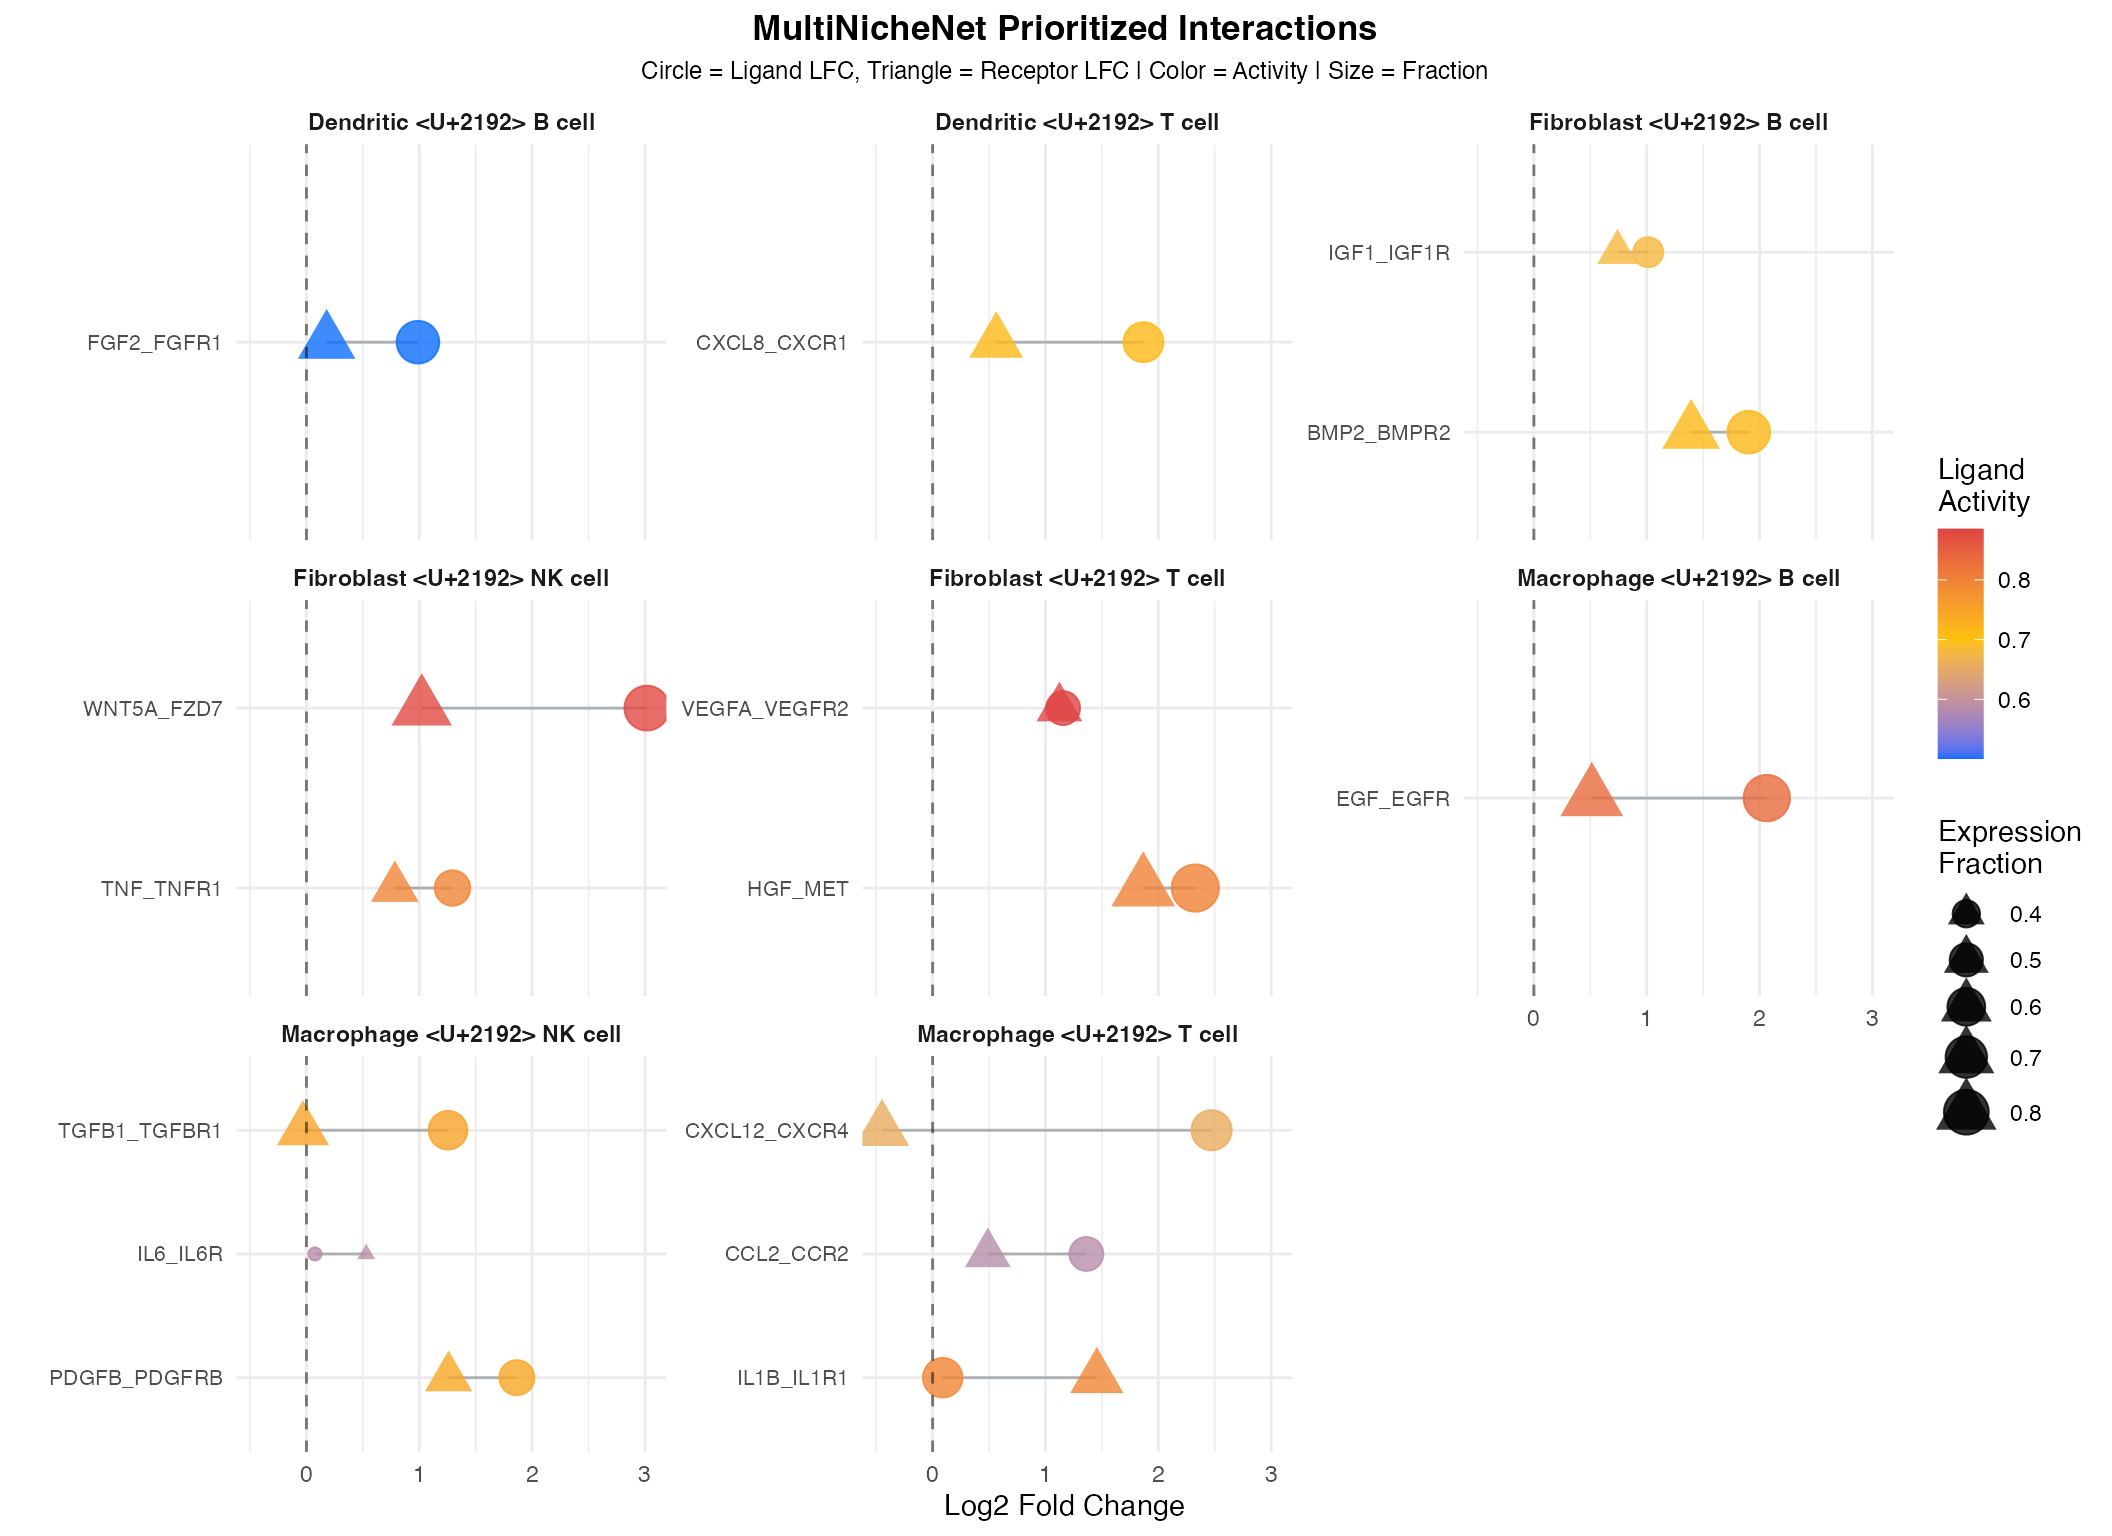
Ligand Activity Visualizations
Activity Heatmaps
# Ligand activity heatmap
p_activity <- make_ligand_activity_plots(
  ligand_activities_targets_DEgenes = output$ligand_activities_targets_DEgenes,
  receiver_oi = "Tcell",
  top_n_ligands = 20
)
print(p_activity)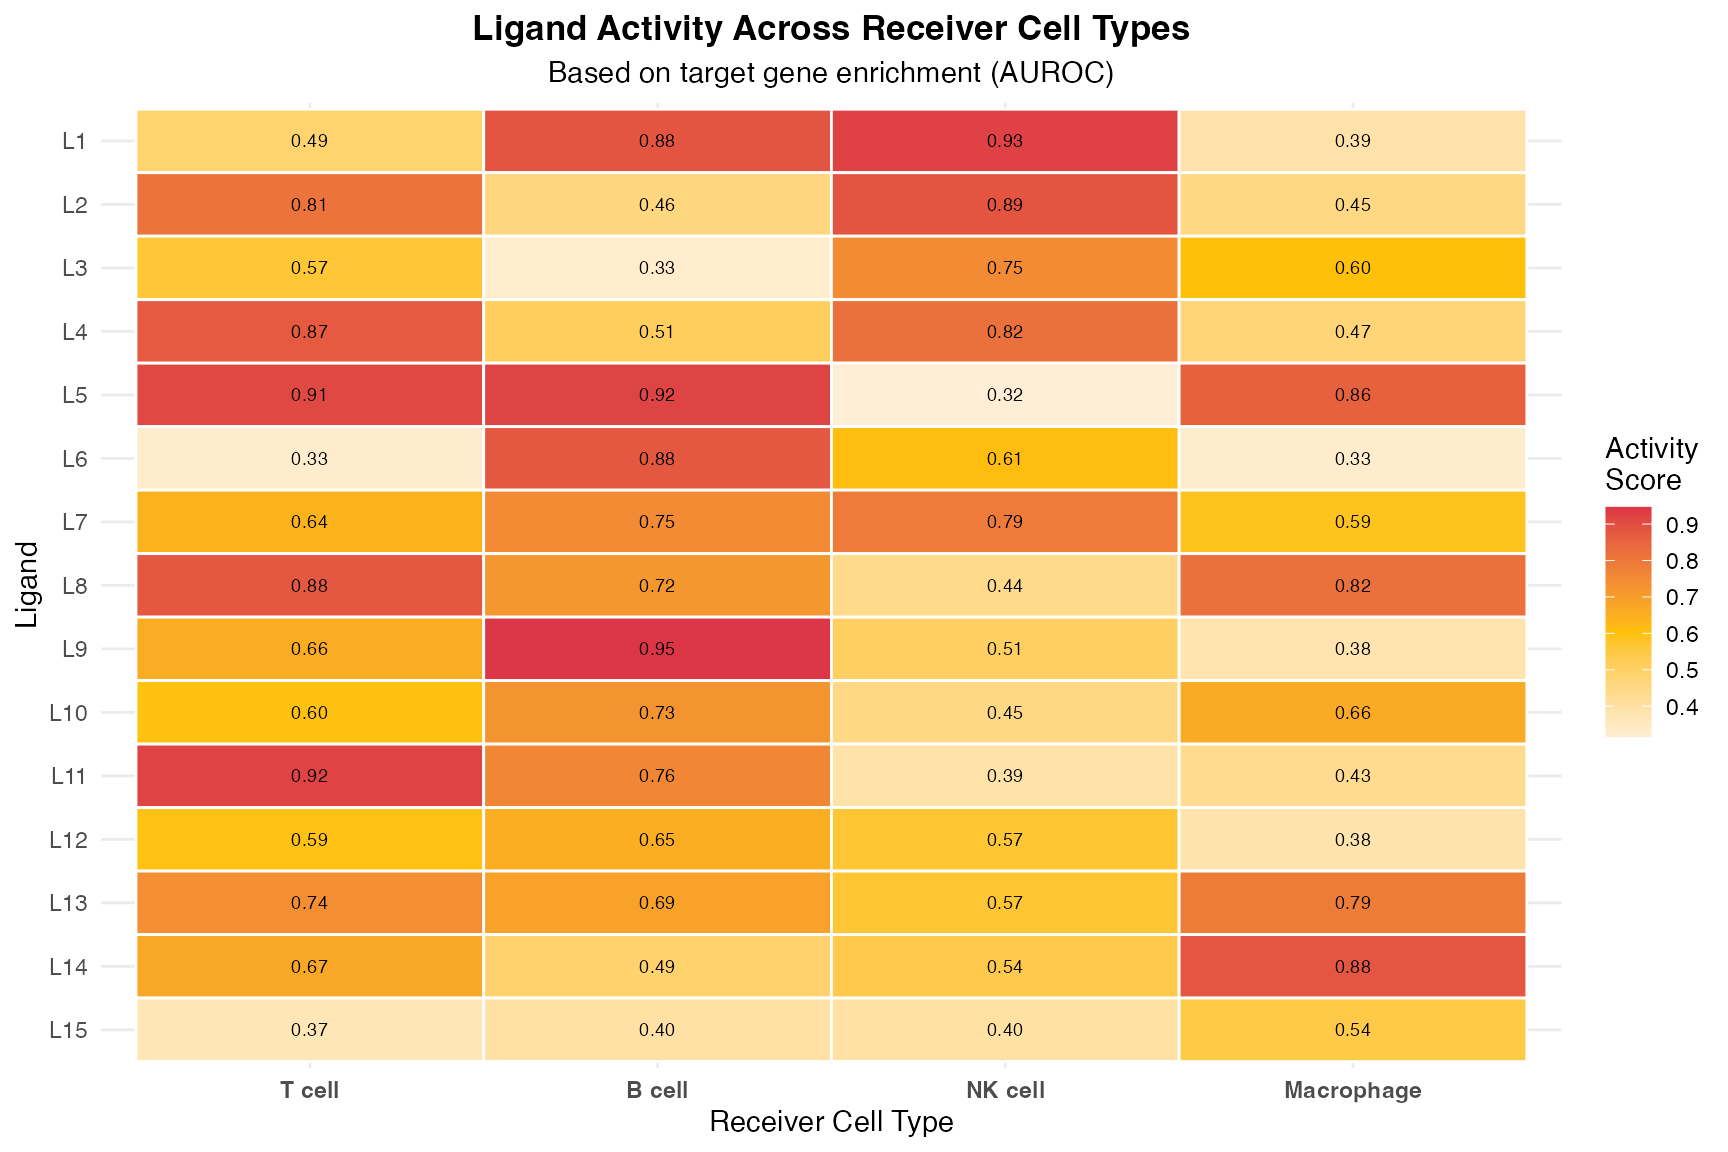
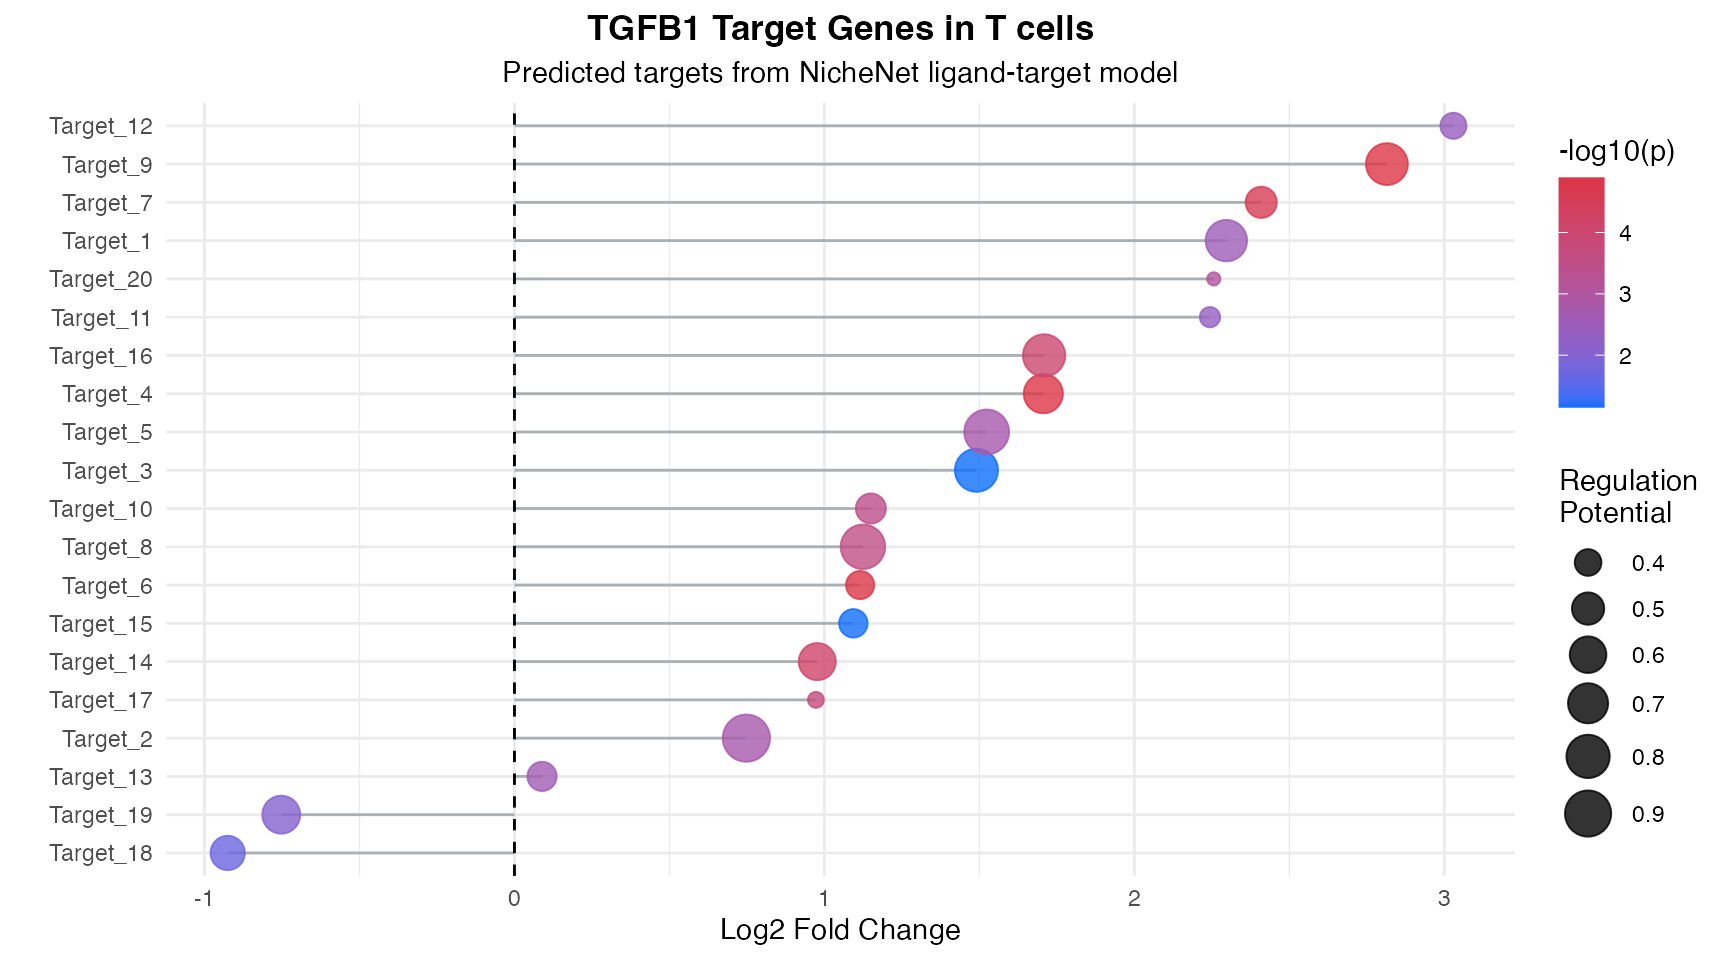
Target Gene Visualizations
Target Gene Expression
# Target gene expression plot
p_targets <- make_target_gene_plots(
  ligand_activities_targets_DEgenes = output$ligand_activities_targets_DEgenes,
  ligand_oi = "TGFB1",
  receiver_oi = "Tcell"
)
print(p_targets)