📚 Full Documentation & Tutorials | 🚀 Quick Start | 📊 Visualization Gallery
Overview
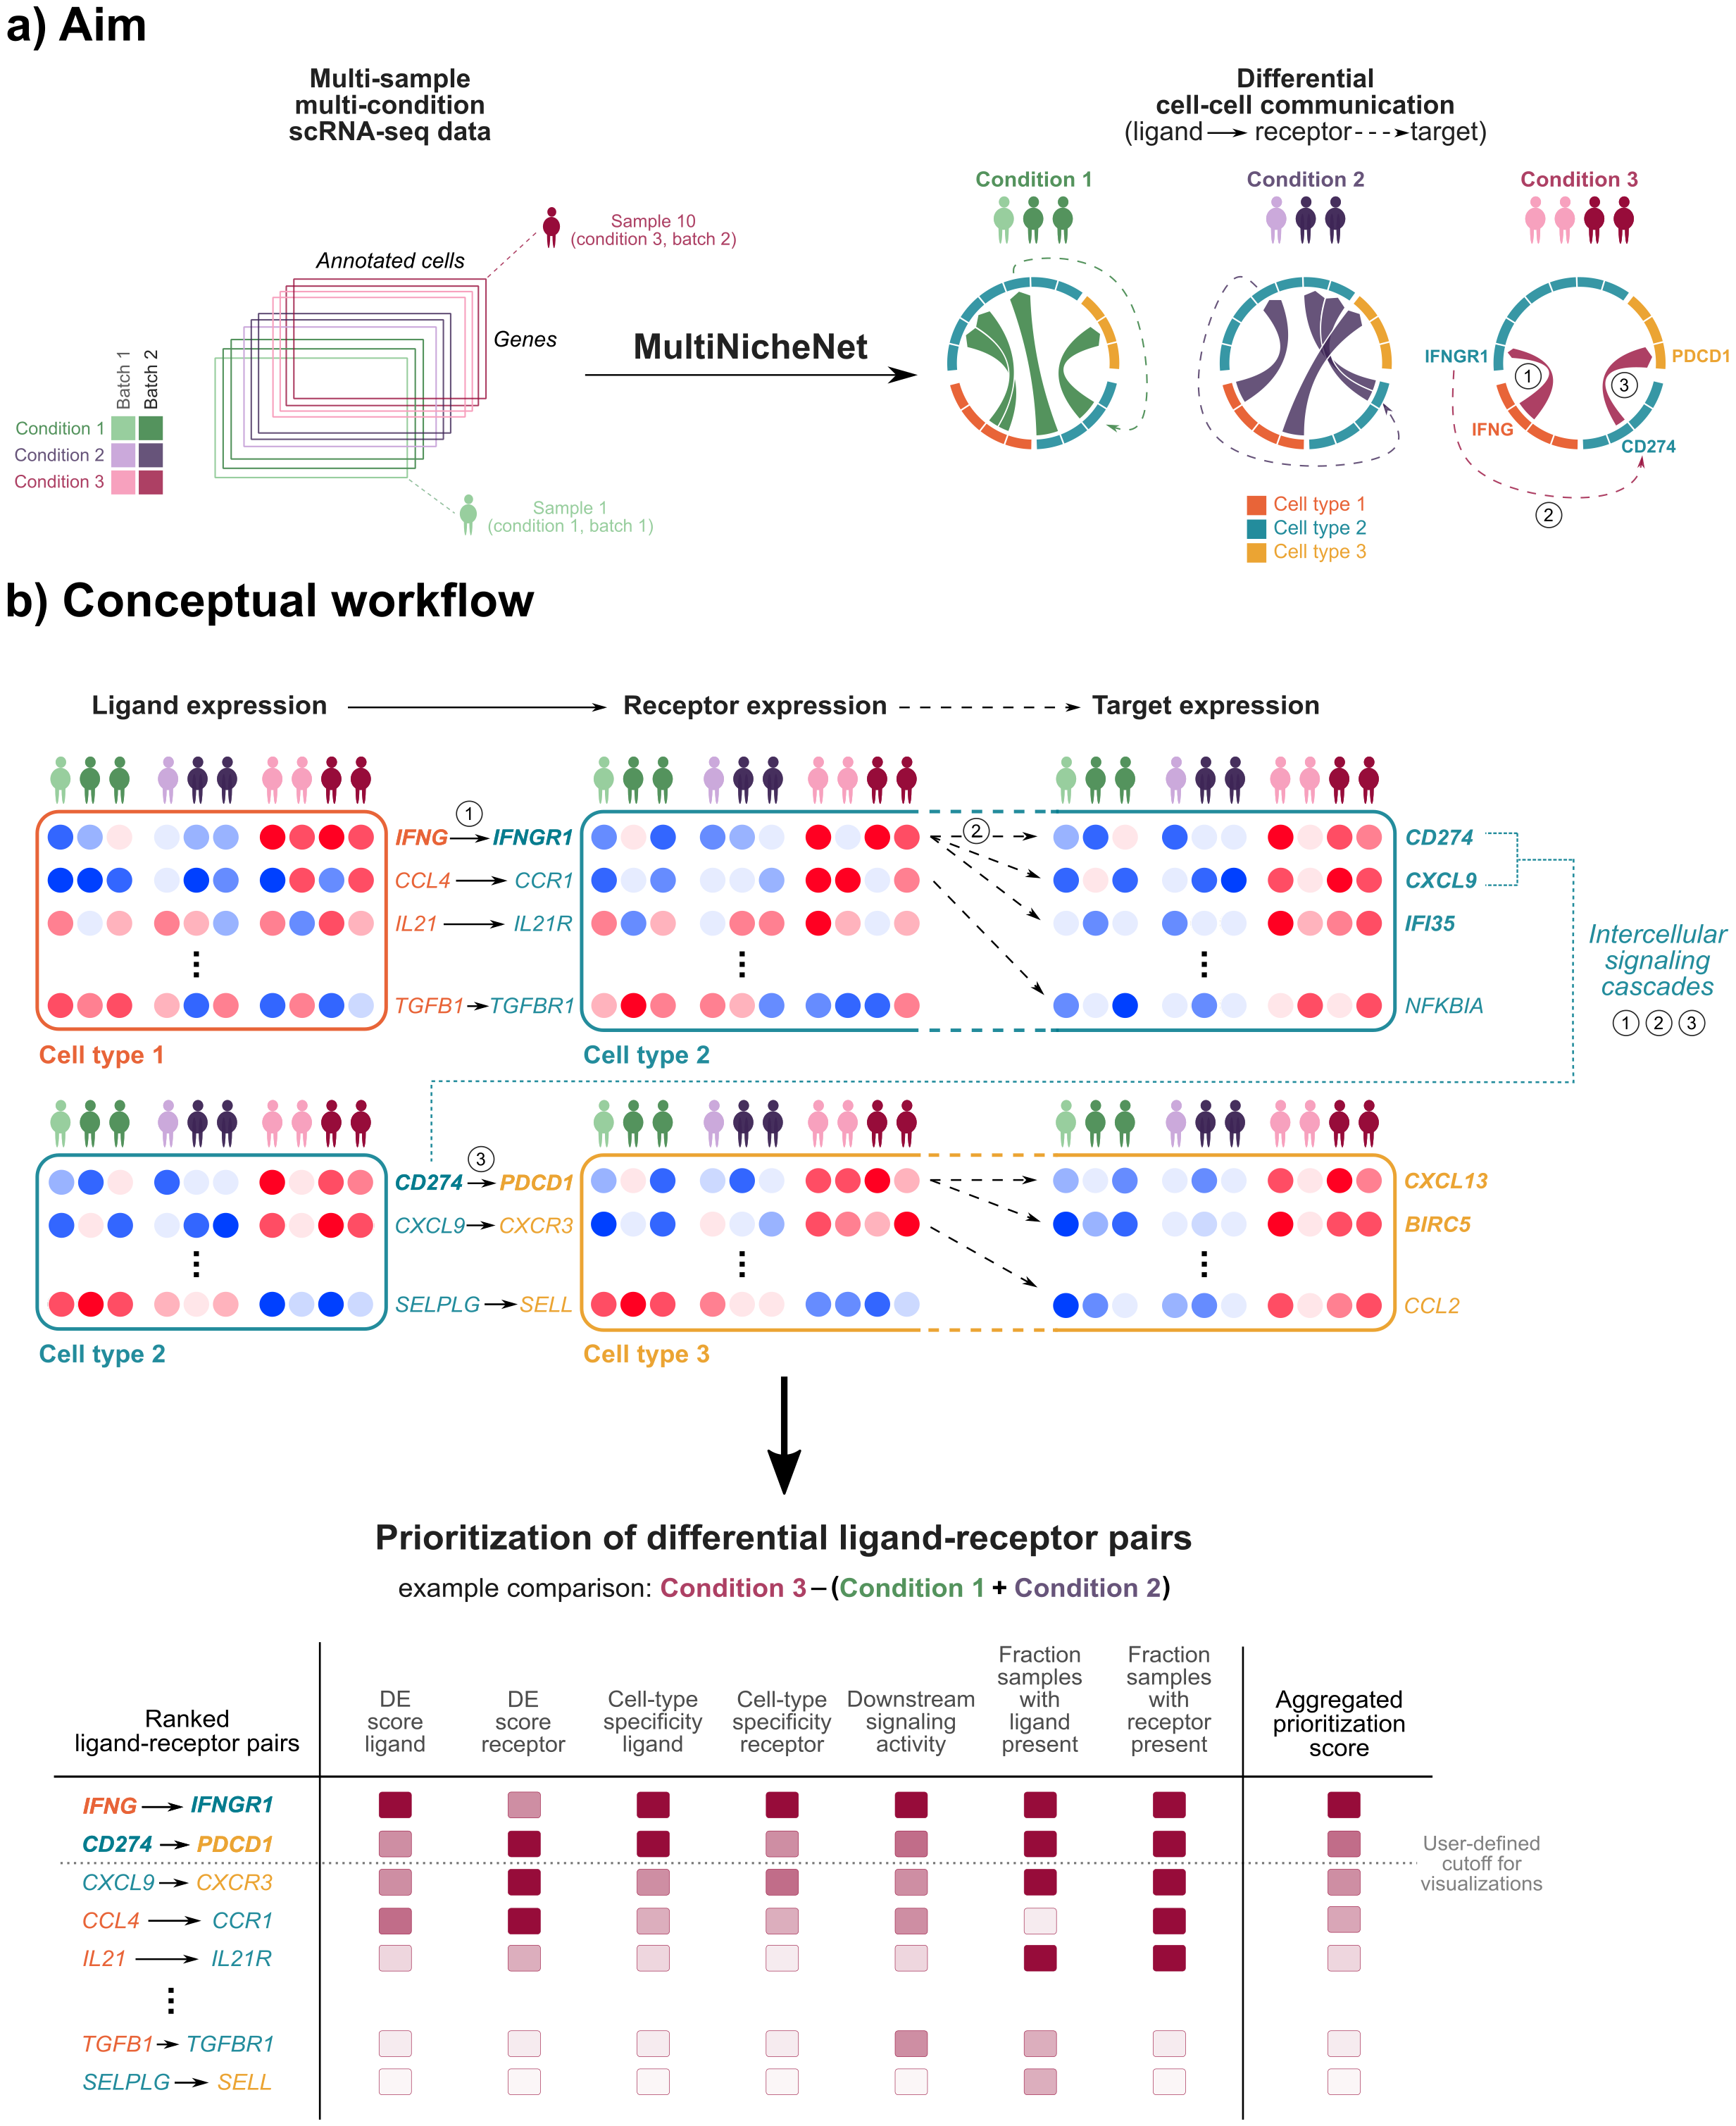
MultiNicheNet is a comprehensive computational framework for differential cell-cell communication (CCC) analysis in single-cell RNA sequencing (scRNA-seq) data with complex multi-sample, multi-condition experimental designs. This methodology enables systematic investigation of intercellular signaling differences across biological conditions, disease states, or treatment groups.
📖 Citation: Browaeys, R. et al. MultiNicheNet: a flexible framework for differential cell-cell communication analysis from multi-sample multi-condition single-cell transcriptomics data. bioRxiv (2023). https://doi.org/10.1101/2023.06.13.544751
Scientific Background
Methodological Framework
MultiNicheNet extends the NicheNet ligand-target inference framework to accommodate multi-sample experimental designs through pseudobulk-based differential expression analysis. The core methodology integrates:
Pseudobulk Aggregation: Cell-level expression data is aggregated per sample to enable proper statistical inference at the sample level, avoiding inflated false discovery rates inherent to cell-level analyses.
Differential Expression Analysis: Leverages the muscat framework for robust differential state analysis using mixed models or pseudobulk methods (Crowell et al., Nat Commun 2020).
-
Multi-Criteria Prioritization: Integrates multiple biological criteria into a unified prioritization score:
- Differential expression of ligands and receptors
- Cell-type specificity of expression
- Fraction of samples expressing the interaction
- NicheNet ligand activity inference
Downstream Target Prediction: Identifies putative downstream signaling targets of prioritized ligand-receptor interactions using the NicheNet ligand-target prior knowledge model.
Key Advantages
| Feature | Description |
|---|---|
| Multi-sample design | Proper statistical inference at sample level using pseudobulk approaches |
| Multi-condition support | Flexible contrasts for complex experimental designs (≥2 conditions) |
| Integrated prioritization | Combines expression, specificity, and ligand activity metrics |
| Extensible framework | Supports integration of complementary data modalities (e.g., proteomics) |
| Reproducibility | Standardized workflow with comprehensive output documentation |
Installation
From R-Universe (Recommended)
# Install from R-Universe
install.packages("multinichenetr", repos = "https://zaoqu-liu.r-universe.dev")
From GitHub
# Install dependencies
if (!require("BiocManager", quietly = TRUE))
    install.packages("BiocManager")
BiocManager::install(c("SingleCellExperiment", "muscat", "scuttle", "scran"))

# Install nichenetr dependency
if (!require("devtools", quietly = TRUE))
    install.packages("devtools")
    devtools::install_github("saeyslab/nichenetr")

# Install multinichenetr
devtools::install_github("Zaoqu-Liu/multinichenetr")
System Requirements: R ≥ 4.0.0. Tested on Windows, Linux (Ubuntu), and macOS.
Quick Start
Minimal Working Example
library(multinichenetr)
library(SingleCellExperiment)

# Load example data
data(sce)

# Define analysis parameters
sample_id <- "tumor"
group_id <- "pEMT"
celltype_id <- "celltype"
contrasts_oi <- c("'High-Low'")
contrast_tbl <- tibble::tibble(contrast = "High-Low", group = "High")

# Load prior knowledge networks
lr_network <- readRDS(url("https://zenodo.org/record/5884439/files/lr_network_human_21122021.rds"))
ligand_target_matrix <- readRDS(url("https://zenodo.org/record/5884439/files/ligand_target_matrix_nsga2r_final.rds"))

# Run MultiNicheNet analysis
output <- multi_nichenet_analysis(
  sce = sce,
  celltype_id = celltype_id,
  sample_id = sample_id,
  group_id = group_id,
  lr_network = lr_network,
  ligand_target_matrix = ligand_target_matrix,
  contrasts_oi = contrasts_oi,
  contrast_tbl = contrast_tbl
)

# Access prioritized interactions
head(output$prioritization_tables$group_prioritization_tbl)
Workflow Overview
┌─────────────────────────────────────────────────────────────────┐
│                    INPUT: SingleCellExperiment                  │
│              (raw counts + cell metadata)                       │
└─────────────────────────────────────────────────────────────────┘
                              │
                              ▼
┌─────────────────────────────────────────────────────────────────┐
│           Step 1: Gene Filtering & Expression Processing        │
│  • Filter lowly expressed genes                                 │
│  • Calculate expression fractions per sample/celltype           │
└─────────────────────────────────────────────────────────────────┘
                              │
                              ▼
┌─────────────────────────────────────────────────────────────────┐
│           Step 2: Pseudobulk Differential Expression            │
│  • Aggregate cells to pseudobulk per sample                     │
│  • Perform DE analysis using muscat framework                   │
│  • Calculate empirical p-values for robustness                  │
└─────────────────────────────────────────────────────────────────┘
                              │
                              ▼
┌─────────────────────────────────────────────────────────────────┐
│           Step 3: Ligand Activity Inference                     │
│  • Apply NicheNet to predict active ligands                     │
│  • Score ligand-receptor pairs by target gene enrichment        │
└─────────────────────────────────────────────────────────────────┘
                              │
                              ▼
┌─────────────────────────────────────────────────────────────────┐
│           Step 4: Multi-Criteria Prioritization                 │
│  • Integrate DE scores, expression, specificity                 │
│  • Calculate unified prioritization score                       │
│  • Rank ligand-receptor-sender-receiver combinations            │
└─────────────────────────────────────────────────────────────────┘
                              │
                              ▼
┌─────────────────────────────────────────────────────────────────┐
│                    OUTPUT: Prioritized CCC Events               │
│  • Ranked interaction tables                                    │
│  • Downstream target predictions                                │
│  • Visualization-ready data structures                          │
└─────────────────────────────────────────────────────────────────┘
Documentation & Tutorials
Comprehensive Tutorials
| Tutorial | Description | Link |
|---|---|---|
| Basic Analysis | Complete walkthrough with 3-group comparison | Markdown |
| Pairwise Comparison | Two-condition analysis without repeated measures | Markdown |
| Paired Analysis | Handling repeated subjects as covariates | Markdown |
| Batch Correction | Atlas-scale data with batch effects | Markdown |
| Multifactorial Design | Complex time × condition interactions | Markdown |
Version 2.0.0 Updates (May 2024)
Methodological Enhancements
- Multi-modal data integration: Framework for incorporating additional prioritization criteria from complementary data sources (e.g., serum proteomics)
- Condition-specific cell type handling: Alternative workflow for cell types present only in specific conditions
- Enhanced regulatory network analysis: Improved intercellular regulatory network construction for interaction pruning
- OmniPath integration: Quality assessment of ligand-receptor pairs based on database curation effort
Recommended Practices
Sample Size Requirements
We recommend ≥4 samples per condition for robust pseudobulk-based analysis. For datasets with fewer samples, consider the sample-agnostic workflow, though results should be interpreted with appropriate caution.
Input Data Requirements
- Raw counts: Unnormalized count matrix
- Cell metadata: Sample ID, condition/group, cell type annotations
- Quality control: Proper cell filtering, doublet removal, and ambient RNA correction should be performed prior to MultiNicheNet analysis
Computational Resources
For large datasets (>100,000 cells, >10 cell types), we recommend: - Running core analysis on HPC infrastructure - Using the make_lite_output() function for portable results - Performing visualization locally on the lite output object
Citation
If you use MultiNicheNet in your research, please cite:
@article{browaeys2023multinichenet,
  title={MultiNicheNet: a flexible framework for differential cell-cell communication
         analysis from multi-sample multi-condition single-cell transcriptomics data},
  author={Browaeys, Robin and others},
  journal={bioRxiv},
  year={2023},
  doi={10.1101/2023.06.13.544751}
}
Related Publications
NicheNet: Browaeys, R., Saelens, W. & Saeys, Y. NicheNet: modeling intercellular communication by linking ligands to target genes. Nat Methods 17, 159–162 (2020). https://doi.org/10.1038/s41592-019-0667-5
muscat: Crowell, H.L. et al. muscat detects subpopulation-specific state transitions from multi-sample multi-condition single-cell transcriptomics data. Nat Commun 11, 6077 (2020). https://doi.org/10.1038/s41467-020-19894-4
Support & Contributing
- 🐛 Bug Reports: GitHub Issues
- 💬 Questions: GitHub Discussions
- 🤝 Contributing: Pull requests are welcome!