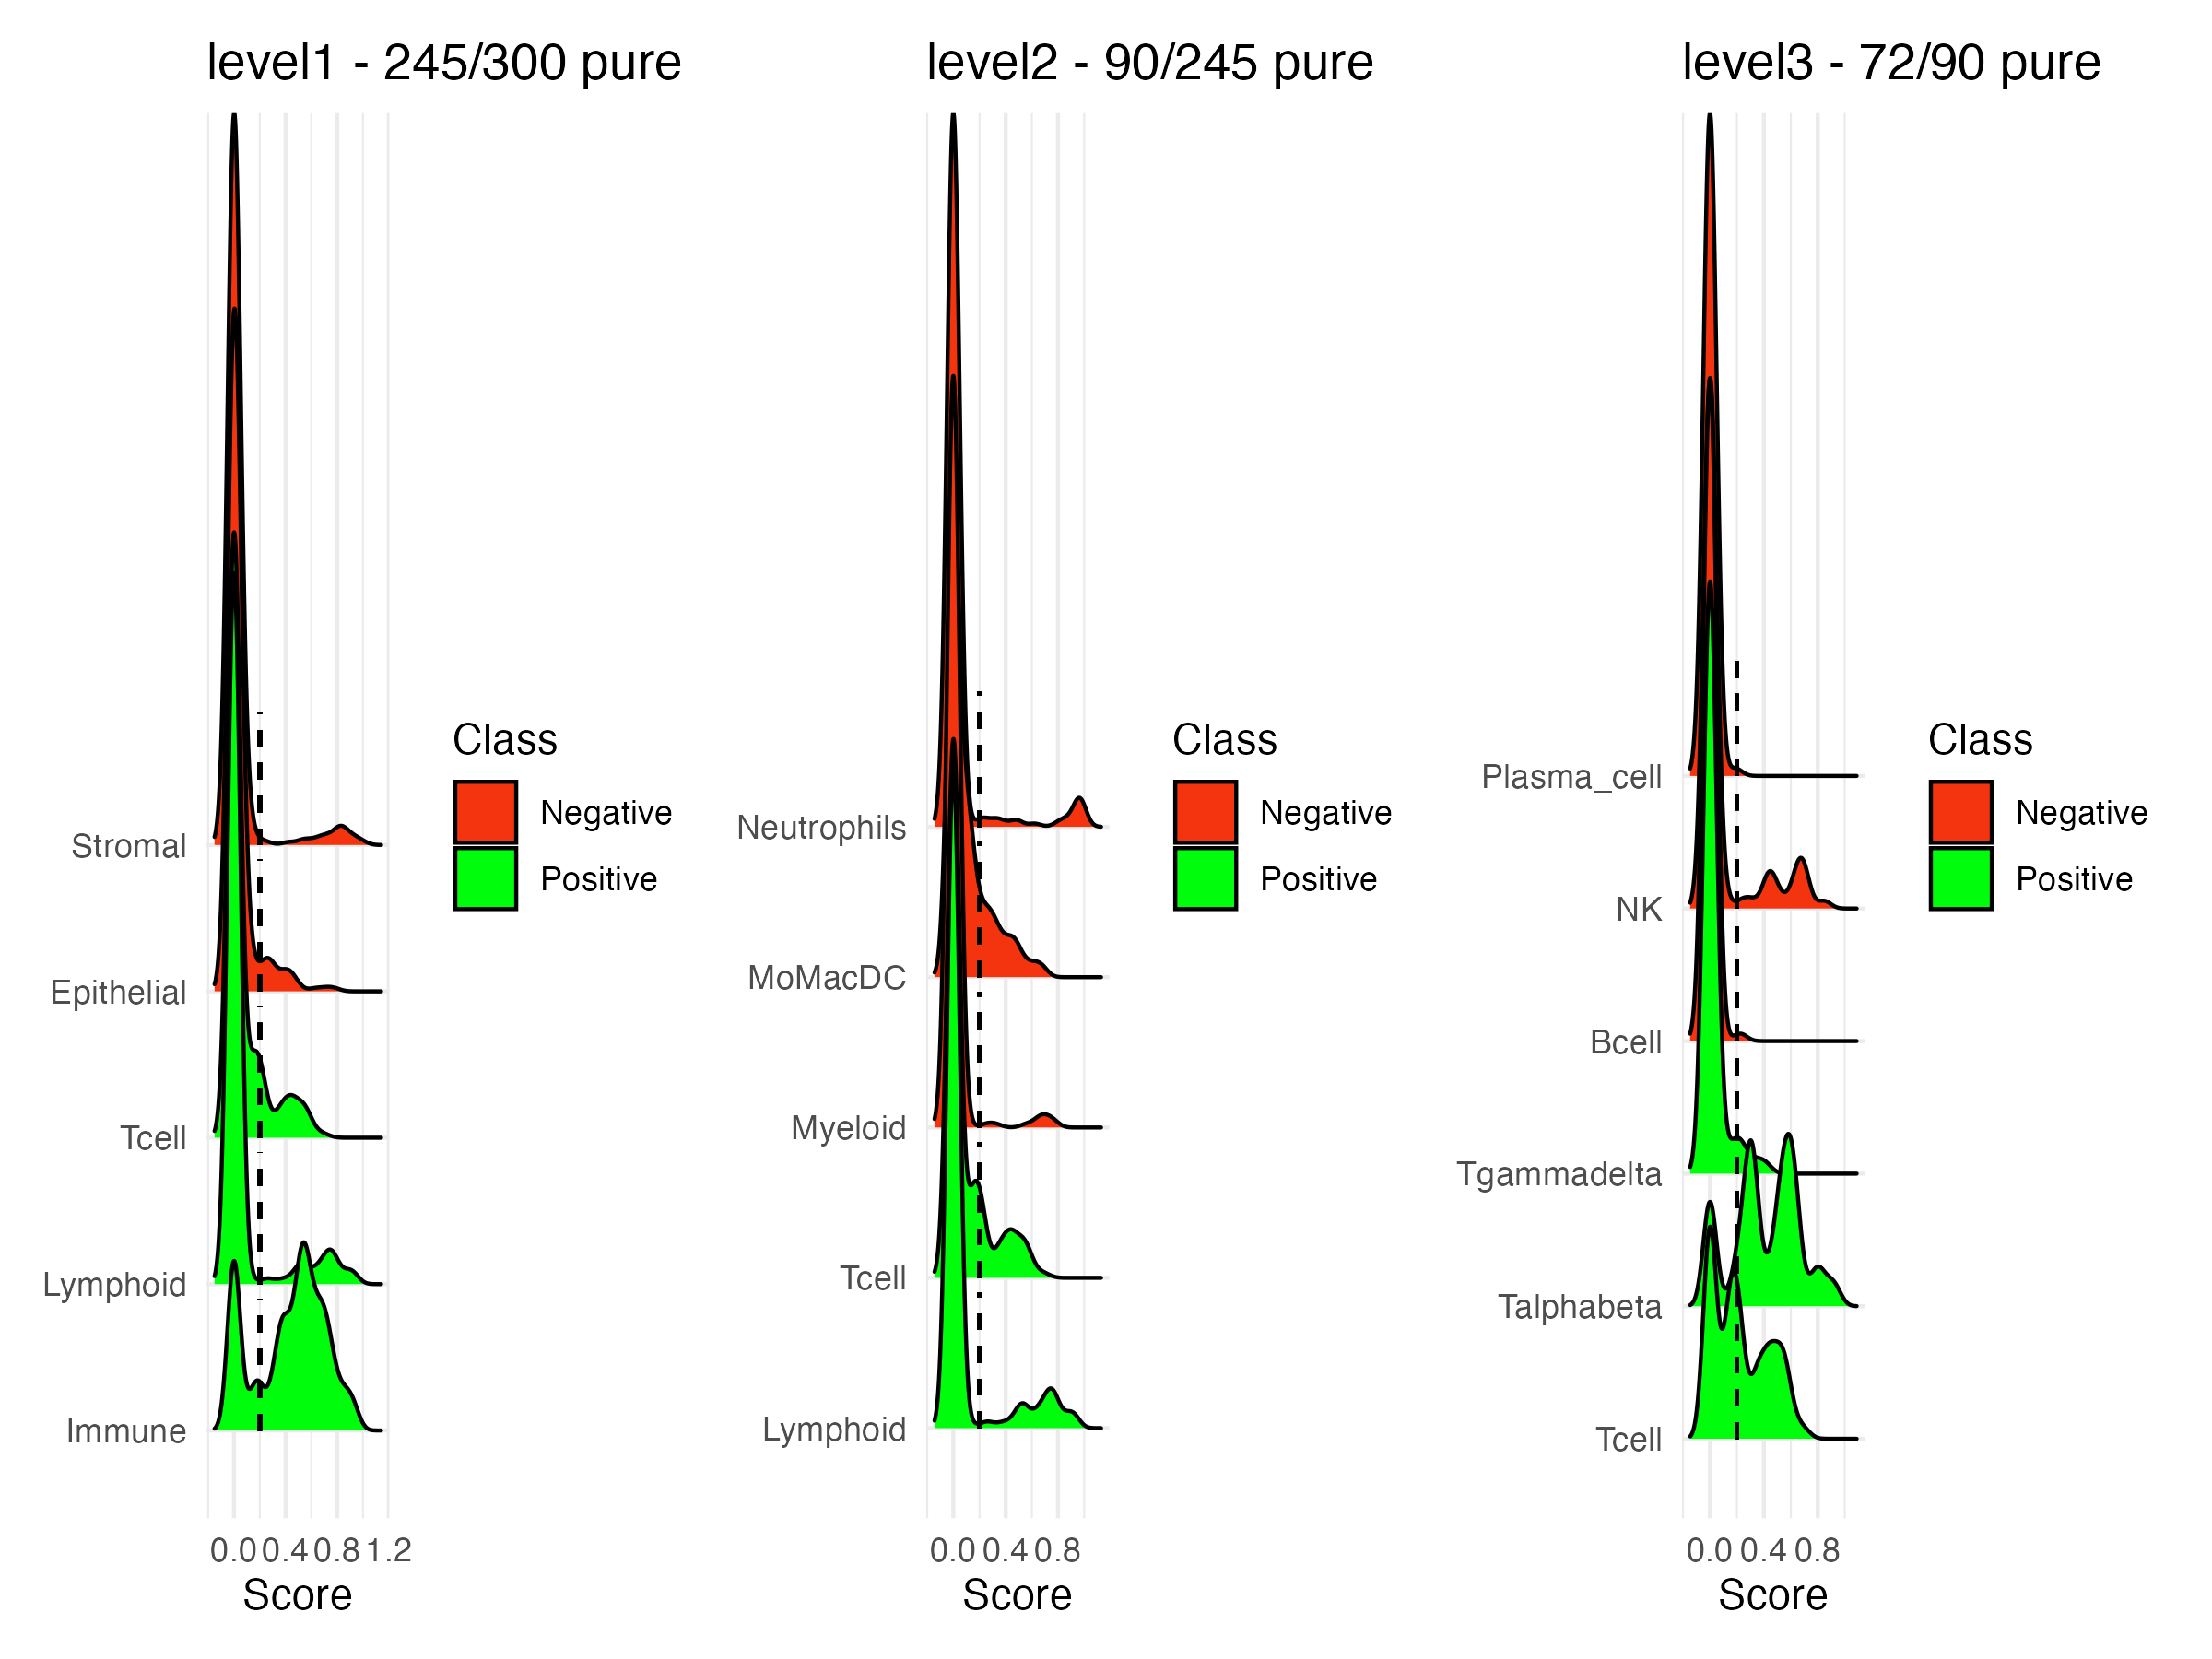
Show distribution of UCell scores for each level of a given scGate model
Usage
plot_UCell_scores(
  obj,
  model,
  overlay = 5,
  pos.thr = 0.2,
  neg.thr = 0.2,
  ncol = NULL,
  combine = TRUE
)
Arguments
- obj
Gated Seurat object (output of scGate)
- model
scGate model used to identify a target population in obj
- overlay
Degree of overlay for ggridges
- pos.thr
Threshold for positive signatures used in scGate model (set to NULL to disable)
- neg.thr
Threshold for negative signatures used in scGate model (set to NULL to disable)
- ncol
Number of columns in output object (passed to wrap_plots)
- combine
Whether to combine plots into a single object, or to return a list of plots
Value
Returns a density plot of UCell scores for the signatures in the scGate model, for each level of the model
Either a plot combined by patchwork (combine=TRUE) or a list of plots (combine=FALSE)
Examples
# \donttest{
scGate.model.db <- get_scGateDB()
#> Using local version of repo scGate_models-master. If you want update it, set option force_update = TRUE
model <- scGate.model.db$human$generic$Tcell
# Apply scGate with this model
data(query.seurat)
query.seurat <- scGate(query.seurat, model=model,
    reduction="pca", save.levels=TRUE)
#>
#> ### Detected a total of 72 pure 'Target' cells (24.00% of total)
# View UCell score distribution
plot_UCell_scores(query.seurat, model)
#> Picking joint bandwidth of 0.0503
#> Picking joint bandwidth of 0.048
#> Picking joint bandwidth of 0.0491

# }
# }