Overview
Connectome is a computational framework for inferring and analyzing cell-cell communication networks from single-cell RNA sequencing (scRNA-seq) data. The package constructs connectomic edgelists that represent intercellular signaling topologies based on ligand-receptor co-expression patterns.
Key Features
- Multi-species support: Human, mouse, rat, and pig via FANTOM5 database
- Statistical rigor: Wilcoxon rank-sum tests with multiple testing correction
- Network analysis: Kleinberg hub/authority scores for centrality analysis
- Rich visualization: Network plots, circos diagrams, dot plots
- Differential analysis: Compare connectivity between conditions
Installation
From R-universe (Recommended)
install.packages("Connectome", repos = "https://zaoqu-liu.r-universe.dev")From GitHub
remotes::install_github("Zaoqu-Liu/Connectome")Quick Start
Prepare Your Data
Connectome requires a Seurat object with:
-
Normalized data (
NormalizeData()) -
Scaled data (
ScaleData()) -
Cell identity labels (stored in
Idents())
# Example workflow
seurat_obj <- NormalizeData(seurat_obj)
seurat_obj <- ScaleData(seurat_obj)
Idents(seurat_obj) <- "cell_type"  # Set your cell type column
Create Connectome
connectome <- CreateConnectome(
  object = seurat_obj,
  species = "human",
  LR.database = "fantom5",
  min.cells.per.ident = 50,
  p.values = TRUE
)
Filter Edges
connectome_filtered <- FilterConnectome(
  connectome,
  min.pct = 0.1,       # Minimum expression fraction
  min.z = 0.25,        # Minimum z-score
  max.p = 0.05         # Maximum adjusted p-value
)
Visualize Results
Network Plot
NetworkPlot(connectome_filtered)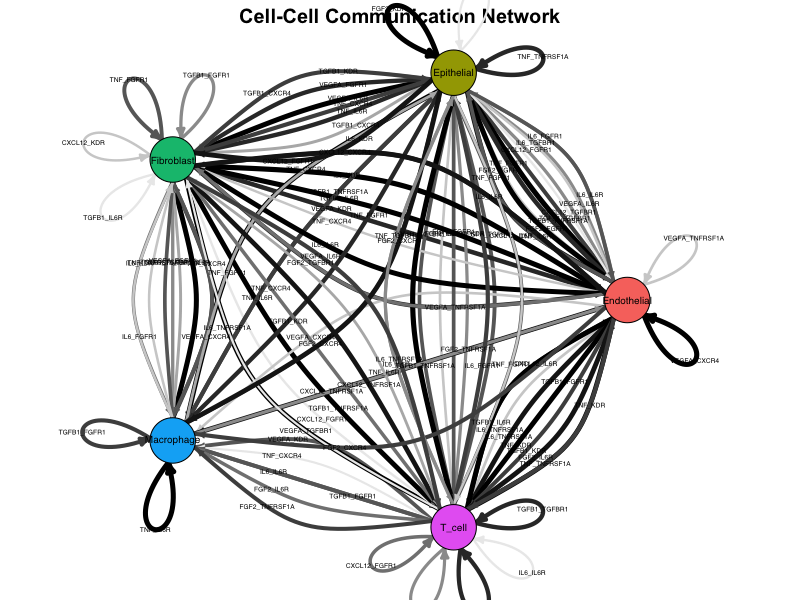
Example network plot showing cell-cell communication topology.
Circos Plot
CircosPlot(connectome_filtered)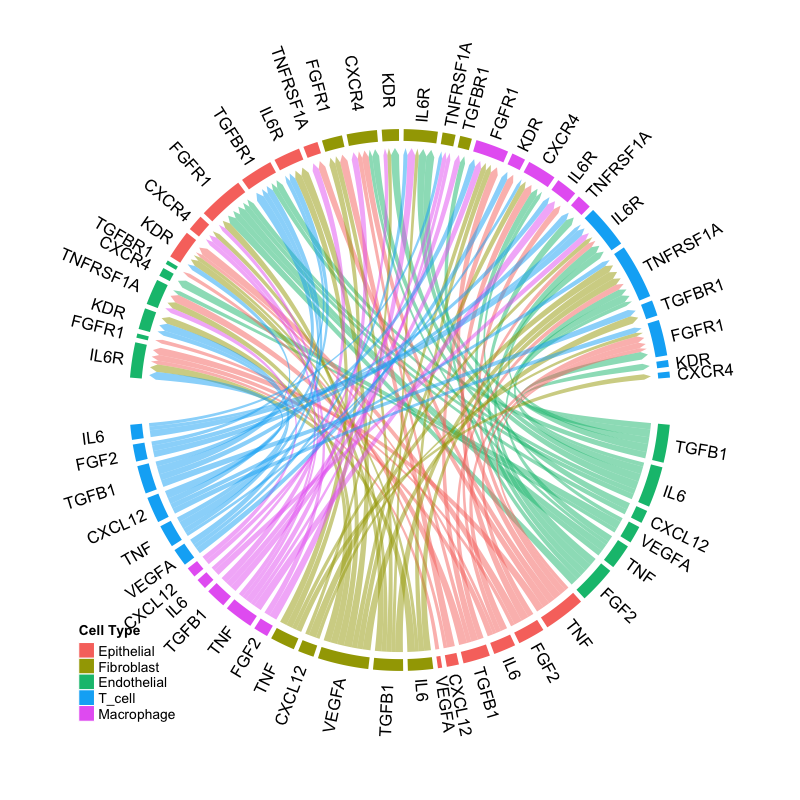
Example circos plot showing ligand-receptor interactions.
Centrality Analysis
Centrality(connectome_filtered)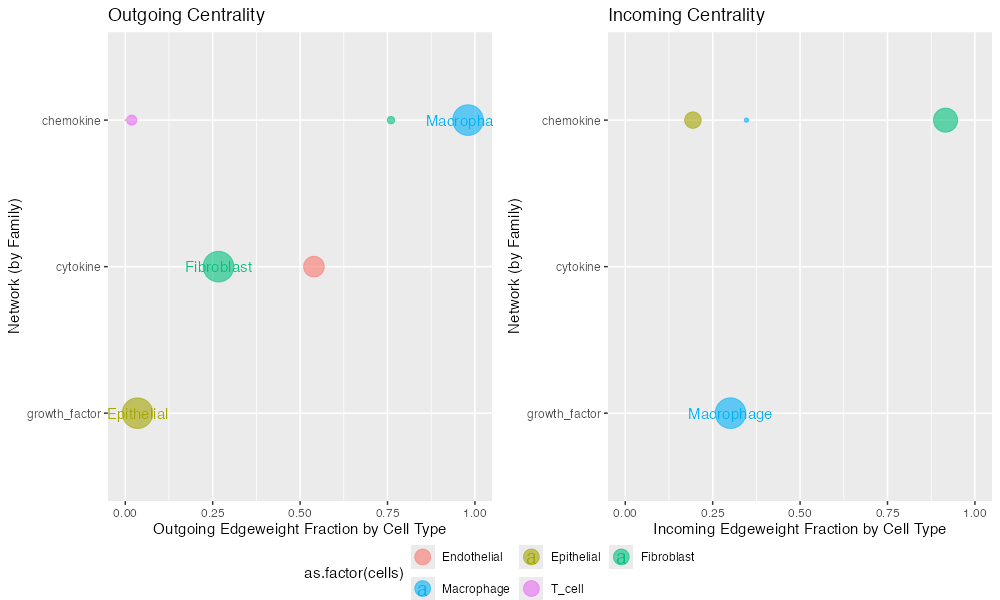
Example centrality analysis showing hub and authority scores.
Understanding the Output
The connectome is a data.frame where each row represents a potential signaling edge:
| Column | Description |
|---|---|
source |
Sending cell population |
target |
Receiving cell population |
ligand |
Ligand gene symbol |
receptor |
Receptor gene symbol |
pair |
Ligand-Receptor pair identifier |
mode |
Signaling family/category |
ligand.expression |
Log-normalized ligand expression |
recept.expression |
Log-normalized receptor expression |
ligand.scale |
Z-scored ligand expression |
recept.scale |
Z-scored receptor expression |
percent.source |
Fraction of source cells expressing ligand |
percent.target |
Fraction of target cells expressing receptor |
weight_norm |
Edge weight (normalized expression) |
weight_sc |
Edge weight (scaled expression) |
p_val_adj.lig |
Adjusted p-value for ligand |
p_val_adj.rec |
Adjusted p-value for receptor |
Workflow Summary
┌─────────────────────────────────────────────────────────────┐
│                     Seurat Object                            │
│  (Normalized + Scaled + Cell Type Labels)                    │
└─────────────────────┬───────────────────────────────────────┘
                      │
                      ▼
┌─────────────────────────────────────────────────────────────┐
│               CreateConnectome()                             │
│  • Extract expression matrices                               │
│  • Match ligand-receptor pairs from FANTOM5                  │
│  • Calculate edge weights                                    │
│  • Compute statistical significance (optional)               │
└─────────────────────┬───────────────────────────────────────┘
                      │
                      ▼
┌─────────────────────────────────────────────────────────────┐
│               FilterConnectome()                             │
│  • Apply expression thresholds                               │
│  • Filter by significance                                    │
│  • Select signaling modes                                    │
└─────────────────────┬───────────────────────────────────────┘
                      │
          ┌───────────┴───────────┐
          ▼                       ▼
┌─────────────────────┐  ┌─────────────────────┐
│    Visualization    │  │      Analysis       │
│  • NetworkPlot()    │  │  • Centrality()     │
│  • CircosPlot()     │  │  • DOR()            │
│  • EdgeDotPlot()    │  │  • Differential     │
└─────────────────────┘  └─────────────────────┘
Next Steps
- Algorithm Principles: Mathematical framework and theory
- Visualization Gallery: Comprehensive visualization examples
- Differential Analysis: Compare conditions
- Best Practices: Troubleshooting and optimization
Citation
If you use Connectome in your research, please cite:
Raredon, M.S.B., Yang, J., Garritano, J. et al. Computation and visualization of cell–cell signaling topologies in single-cell systems data using Connectome. Scientific Reports 12, 4187 (2022). https://doi.org/10.1038/s41598-022-07959-x
Session Info
sessionInfo()
#> R version 4.4.0 (2024-04-24)
#> Platform: aarch64-apple-darwin20
#> Running under: macOS 15.6.1
#>
#> Matrix products: default
#> BLAS:   /Library/Frameworks/R.framework/Versions/4.4-arm64/Resources/lib/libRblas.0.dylib
#> LAPACK: /Library/Frameworks/R.framework/Versions/4.4-arm64/Resources/lib/libRlapack.dylib;  LAPACK version 3.12.0
#>
#> locale:
#> [1] C
#>
#> time zone: Asia/Shanghai
#> tzcode source: internal
#>
#> attached base packages:
#> [1] stats     graphics  grDevices utils     datasets  methods   base
#>
#> loaded via a namespace (and not attached):
#>  [1] digest_0.6.39     desc_1.4.3        R6_2.6.1          fastmap_1.2.0
#>  [5] xfun_0.56         cachem_1.1.0      knitr_1.51        htmltools_0.5.9
#>  [9] rmarkdown_2.30    lifecycle_1.0.5   cli_3.6.5         sass_0.4.10
#> [13] pkgdown_2.1.3     textshaping_1.0.4 jquerylib_0.1.4   systemfonts_1.3.1
#> [17] compiler_4.4.0    tools_4.4.0       ragg_1.5.0        bslib_0.9.0
#> [21] evaluate_1.0.5    yaml_2.3.12       otel_0.2.0        jsonlite_2.0.0
#> [25] rlang_1.1.7       fs_1.6.6          htmlwidgets_1.6.4