Computational Framework for Cell-Cell Communication Analysis in Single-Cell Transcriptomics
📖 Full Documentation | 🚀 Get Started | 📊 Visualization Gallery
Overview
Connectome is an R package designed for systematic inference and visualization of cell-cell communication networks from single-cell RNA sequencing (scRNA-seq) data. The package constructs connectomic edgelists representing intercellular signaling topologies based on ligand-receptor co-expression patterns across distinct cell populations.
The analytical framework integrates:
- FANTOM5 ligand-receptor database with multi-species support (human, mouse, rat, pig)
- Statistical significance testing via Wilcoxon rank-sum tests
- Network centrality analysis using Kleinberg hub and authority scores
- Differential connectivity analysis for comparative studies
Citation
If you use Connectome in your research, please cite:
Raredon, M.S.B., Yang, J., Garritano, J. et al. Computation and visualization of cell–cell signaling topologies in single-cell systems data using Connectome. Scientific Reports 12, 4187 (2022). https://doi.org/10.1038/s41598-022-07959-x
BibTeX:
@article{raredon2022connectome,
  title={Computation and visualization of cell--cell signaling topologies in single-cell systems data using Connectome},
  author={Raredon, Micha Sam Brickman and Yang, Junchen and Garritano, James and others},
  journal={Scientific Reports},
  volume={12},
  pages={4187},
  year={2022},
  publisher={Nature Publishing Group},
  doi={10.1038/s41598-022-07959-x}
}
Installation
From R-universe (Recommended)
install.packages("Connectome", repos = "https://zaoqu-liu.r-universe.dev")From GitHub
if (!requireNamespace("remotes", quietly = TRUE))
    install.packages("remotes")
remotes::install_github("Zaoqu-Liu/Connectome")
Dependencies
Required Bioconductor packages:
if (!requireNamespace("BiocManager", quietly = TRUE))
    install.packages("BiocManager")
BiocManager::install(c("circlize", "ComplexHeatmap"))
Quick Start
library(Seurat)
library(Connectome)

# Ensure data is normalized and scaled
seurat_obj <- NormalizeData(seurat_obj)
seurat_obj <- ScaleData(seurat_obj)

# Construct connectome
connectome <- CreateConnectome(
  object = seurat_obj,
  species = "human",
  LR.database = "fantom5",
  min.cells.per.ident = 75,
  p.values = TRUE
)

# Apply biological filters
connectome_filtered <- FilterConnectome(
  connectome,
  min.pct = 0.1,      # Minimum expression fraction

  min.z = 0.25,       # Minimum z-score threshold
  max.p = 0.05        # Maximum adjusted p-value
)

# Visualize network topology
NetworkPlot(connectome_filtered)
CircosPlot(connectome_filtered)
Core Functions
Network Construction
| Function | Description |
|---|---|
CreateConnectome() |
Construct connectomic edgelist from Seurat object |
FilterConnectome() |
Apply expression, significance, and topological filters |
DifferentialConnectome() |
Compute differential connectivity between conditions |
SingleCellConnectome() |
Generate single-cell resolution connectivity matrix |
Visualization
| Function | Description |
|---|---|
NetworkPlot() |
igraph-based directed network visualization |
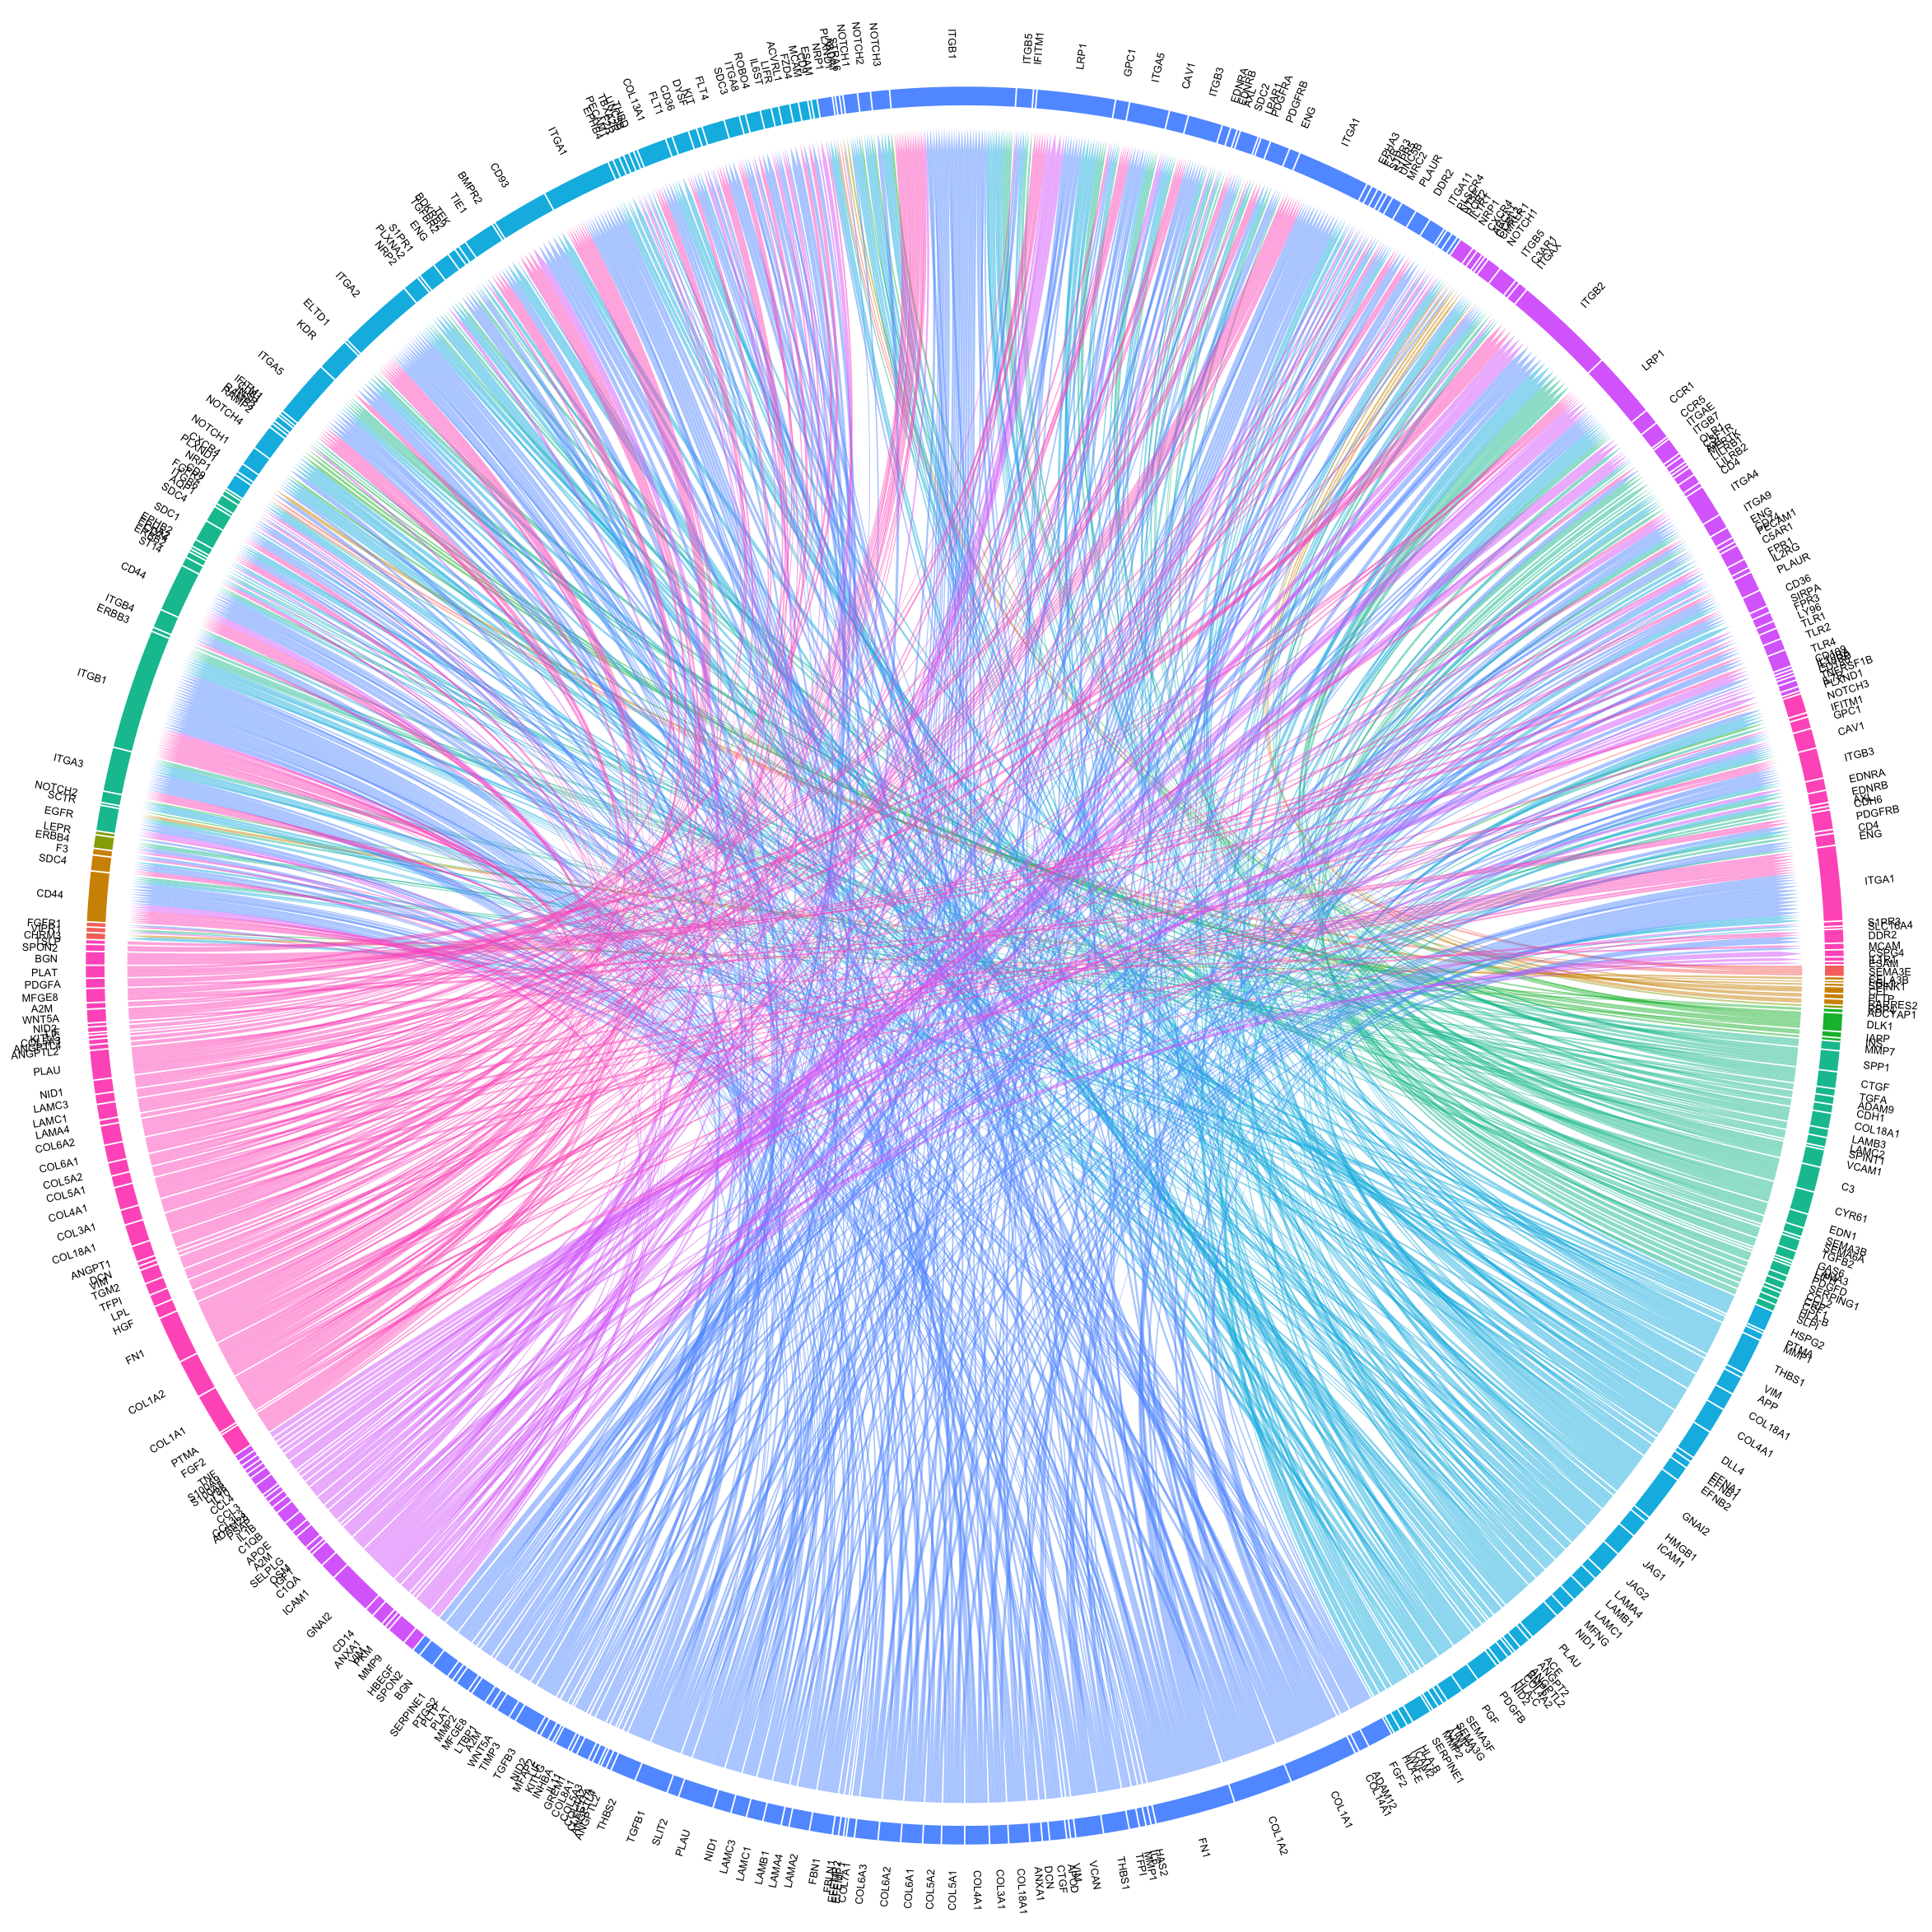
CircosPlot() |
Chord diagram representation of connectivity |
CircosDiff() |
Differential connectivity chord diagram |
EdgeDotPlot() |
Dot plot matrix of edge weights |
DiffEdgeDotPlot() |
Differential edge visualization |
Network Analysis
| Function | Description |
|---|---|
Centrality() |
Hub and authority score analysis by signaling mode |
CompareCentrality() |
Cross-condition centrality comparison |
ModalDotPlot() |
Mode-stratified centrality visualization |
SignalScatter() |
Ligand-receptor co-expression scatter plot |
Methodological Framework
Edge Weight Computation
Connectome computes edge weights using ligand and receptor expression values:
where denotes ligand expression in source population , denotes receptor expression in target population , and can be configured as:
- Product: (default, captures co-expression)
- Sum: (additive contribution)
- Mean: (average signal strength)
Supported Species
The package includes curated ligand-receptor databases from FANTOM5 for:
| Species | Dataset | Pairs |
|---|---|---|
| Human | ncomms8866_human |
2,557 |
| Mouse | ncomms8866_mouse |
~2,400 |
| Rat | ncomms8866_rat |
~2,300 |
| Pig | ncomms8866_pig |
~2,200 |
Custom ligand-receptor databases can be supplied via the custom.list parameter.
Integration with LIANA
Connectome is integrated with LIANA (Ligand-Receptor Analysis framework):
library(liana)
liana_res <- liana_wrap(sce, method = "connectome")
System Requirements
- R version: ≥ 4.0.0
- Core dependencies: Seurat (≥ 4.0.0), igraph, circlize, ComplexHeatmap
- Memory: Scales with dataset size; recommend 8+ GB RAM for large datasets
- Platform: Cross-platform (macOS, Linux, Windows)
References
Raredon, M.S.B., Yang, J., Garritano, J. et al. Computation and visualization of cell–cell signaling topologies in single-cell systems data using Connectome. Sci Rep 12, 4187 (2022). DOI: 10.1038/s41598-022-07959-x
Ramilowski, J.A. et al. A draft network of ligand–receptor-mediated multicellular signalling in human. Nat Commun 6, 7866 (2015). DOI: 10.1038/ncomms8866
Raredon, M.S.B. et al. Single-cell connectomic analysis of adult mammalian lungs. Science Advances 5(12), eaaw3851 (2019). DOI: 10.1126/sciadv.aaw3851
Contact
- Maintainer: Zaoqu Liu (liuzaoqu@163.com)
- Original Author: Micha Sam Brickman Raredon (Yale University)
- Issues: https://github.com/Zaoqu-Liu/Connectome/issues