Algorithm and Mathematical Background
Zaoqu Liu
2026-01-23
Source:vignettes/algorithm.Rmd
algorithm.RmdBiological Motivation
Stem cells are characterized by their ability to differentiate into multiple cell types. At the molecular level, this pluripotency is reflected in the gene expression patterns:
- Pluripotent cells: Express genes broadly, with signaling flowing through many pathways
- Differentiated cells: Express genes in a more focused pattern, with signaling concentrated in specific pathways
The signaling entropy quantifies this “randomness” of information flow through the protein-protein interaction (PPI) network.
Mathematical Framework
Signaling Entropy Rate (SR)
Given a gene expression profile and an adjacency matrix of the PPI network, the SR is computed as follows:
Step 1: Transition Probabilities
For each gene , compute the probability of signaling to neighbor :
This represents the probability that a signal at gene will transition to gene , weighted by the expression level of .
Visual Demonstration
Network Structure
# Network statistics
n_genes <- nrow(net13Jun12.m)
n_edges <- sum(net13Jun12.m) / 2
degrees <- rowSums(net13Jun12.m)

cat("Network Statistics:\n")
#> Network Statistics:
cat("  Genes:", n_genes, "\n")
#>   Genes: 8434
cat("  Interactions:", n_edges, "\n")
#>   Interactions: 303600
cat("  Mean degree:", round(mean(degrees), 2), "\n")
#>   Mean degree: 71.99
cat("  Max degree:", max(degrees), "\n")
#>   Max degree: 1030
# Degree distribution
df_degree <- data.frame(degree = degrees)

ggplot(df_degree, aes(x = degree)) +
  geom_histogram(bins = 50, fill = "#3498db", alpha = 0.7, color = "white") +
  scale_x_log10() +
  labs(
    title = "PPI Network Degree Distribution",
    subtitle = "Scale-free network property",
    x = "Degree (log scale)",
    y = "Count"
  ) +
  theme_minimal() +
  theme(plot.title = element_text(face = "bold"))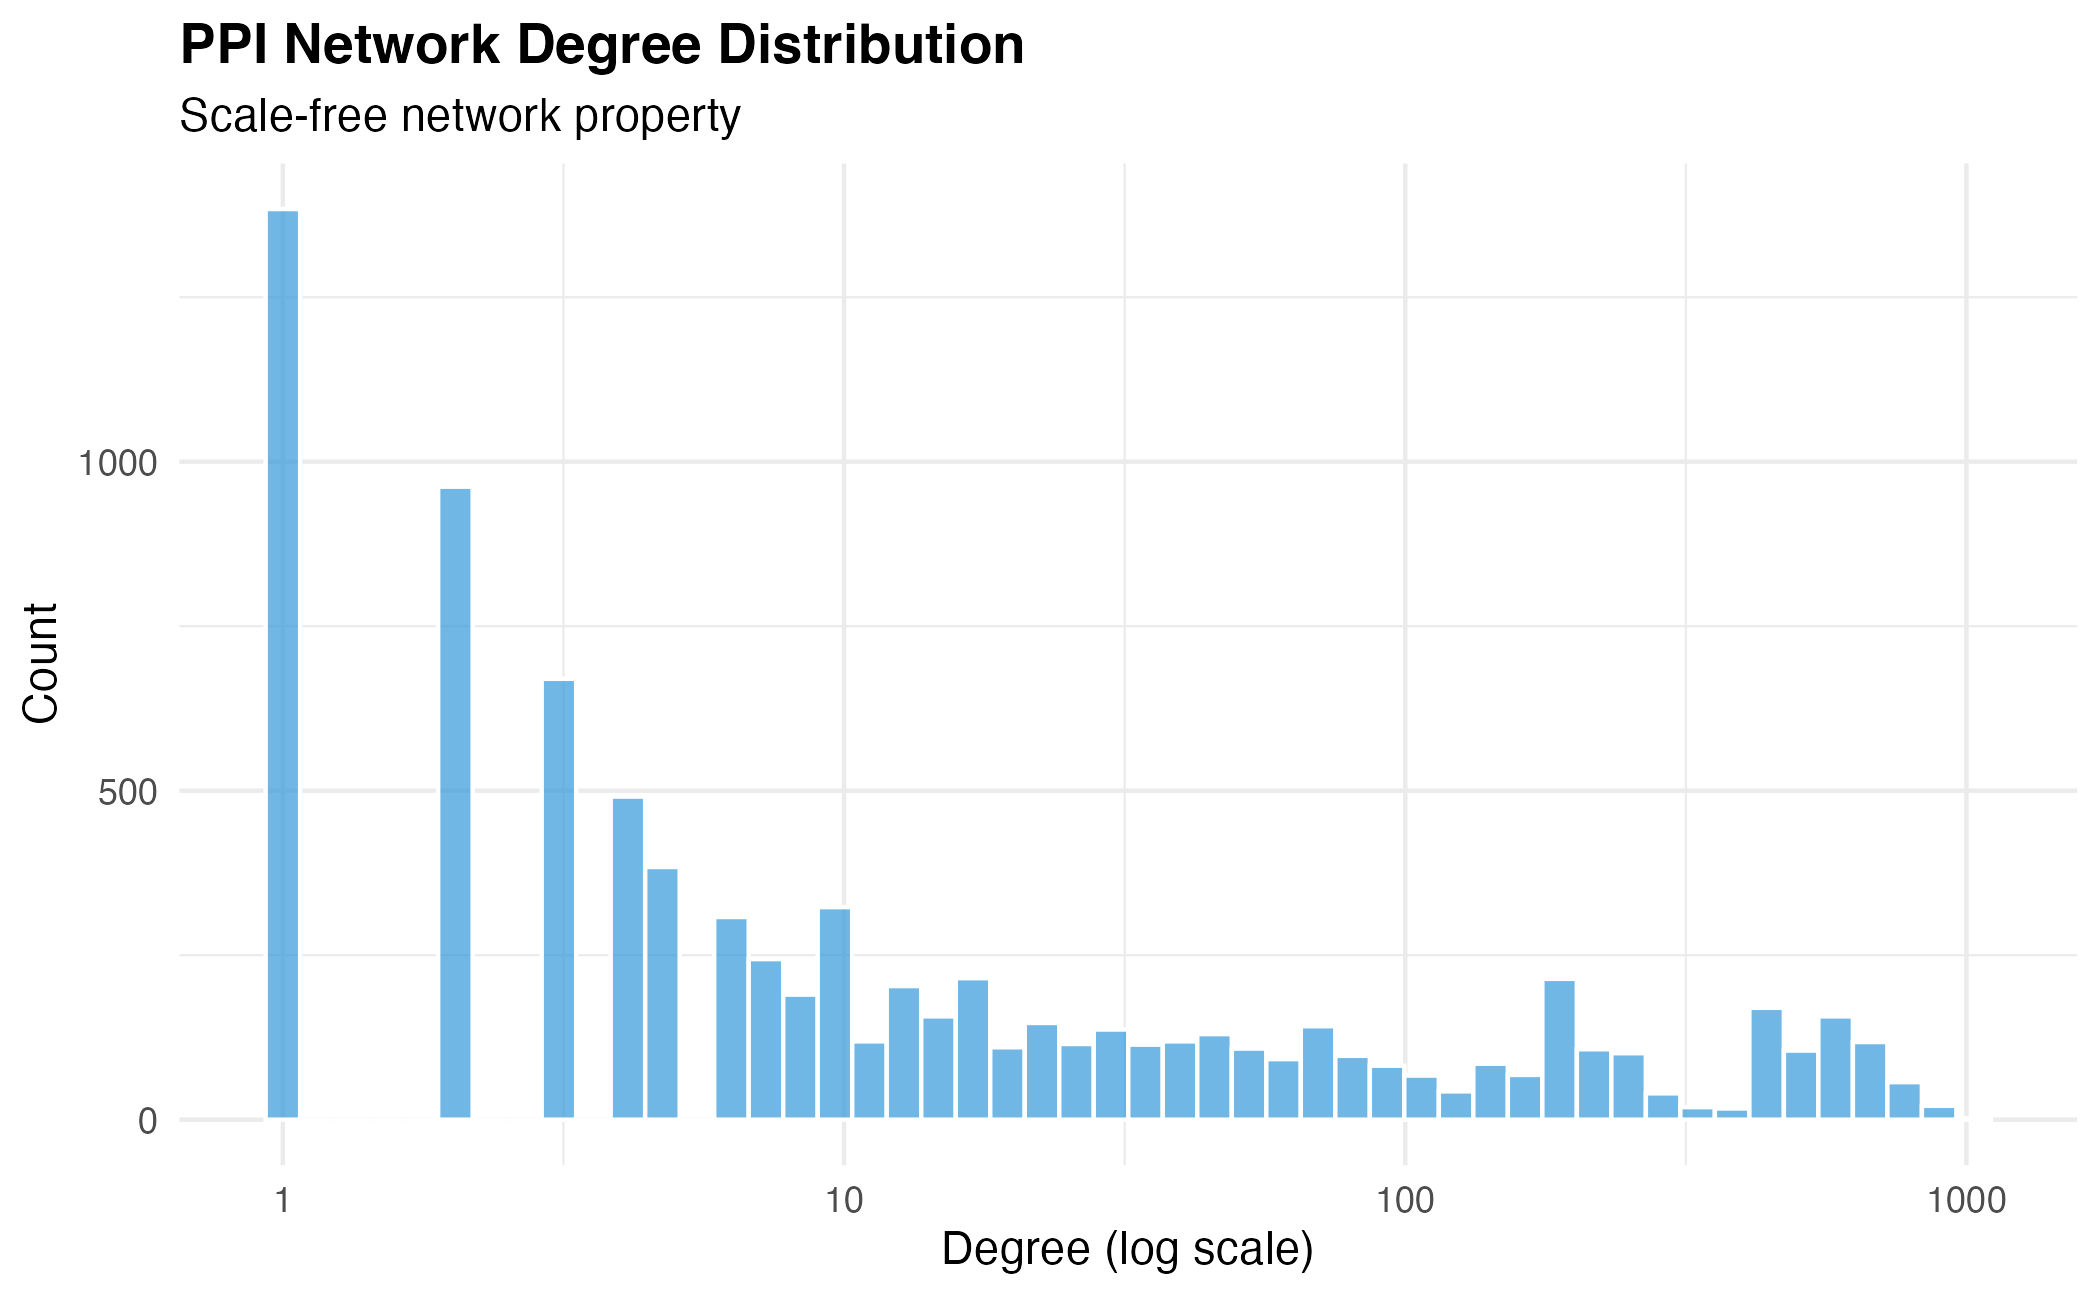
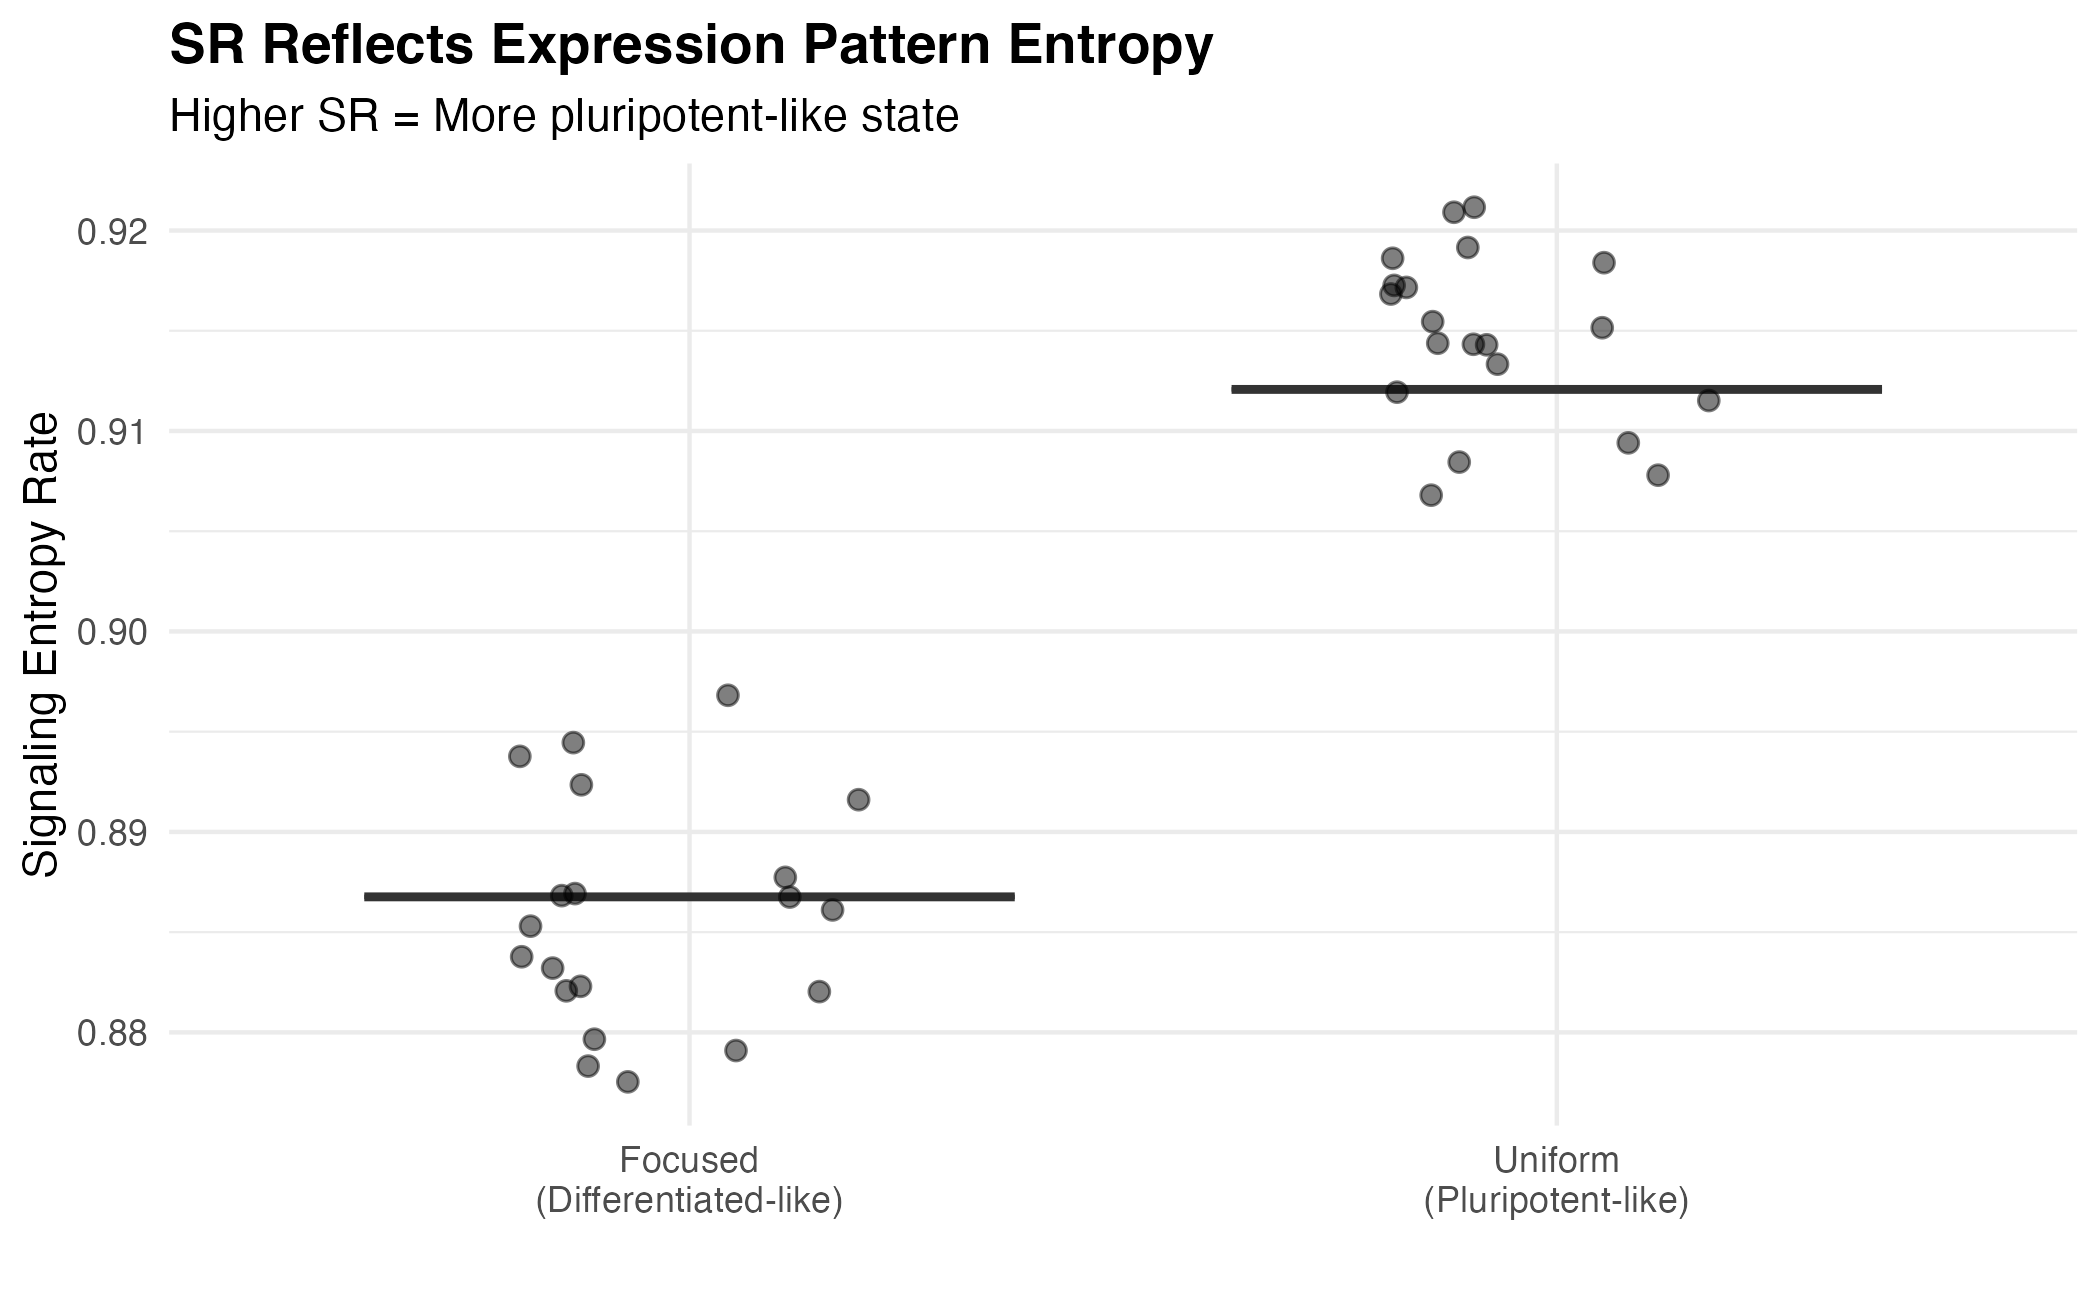
Entropy Computation Example
set.seed(123)

# Create two contrasting expression patterns
n_genes_sim <- 5500
n_cells <- 20

# Pattern 1: Uniform expression (high entropy)
exp_uniform <- matrix(rep(5, n_genes_sim * n_cells), nrow = n_genes_sim)
rownames(exp_uniform) <- head(rownames(net13Jun12.m), n_genes_sim)

# Pattern 2: Focused expression (low entropy)
exp_focused <- matrix(1, nrow = n_genes_sim, ncol = n_cells)
exp_focused[1:500, ] <- 50  # High expression in subset
rownames(exp_focused) <- head(rownames(net13Jun12.m), n_genes_sim)

# Compute SR
integ_uniform <- DoIntegPPI(exp_uniform, net13Jun12.m)
integ_focused <- DoIntegPPI(exp_focused, net13Jun12.m)

sr_uniform <- CompSRana(integ_uniform)
sr_focused <- CompSRana(integ_focused)

cat("Uniform expression SR:", round(mean(sr_uniform$SR), 4), "\n")
#> Uniform expression SR: 0.9121
cat("Focused expression SR:", round(mean(sr_focused$SR), 4), "\n")
#> Focused expression SR: 0.8868
df_patterns <- data.frame(
  Pattern = c(rep("Uniform\n(Pluripotent-like)", n_cells),
              rep("Focused\n(Differentiated-like)", n_cells)),
  SR = c(sr_uniform$SR, sr_focused$SR)
)

ggplot(df_patterns, aes(x = Pattern, y = SR, fill = Pattern)) +
  geom_boxplot(alpha = 0.7, outlier.shape = NA) +
  geom_jitter(width = 0.2, alpha = 0.5, size = 2) +
  scale_fill_manual(values = c("#e74c3c", "#3498db")) +
  labs(
    title = "SR Reflects Expression Pattern Entropy",
    subtitle = "Higher SR = More pluripotent-like state",
    x = "",
    y = "Signaling Entropy Rate"
  ) +
  theme_minimal() +
  theme(
    plot.title = element_text(face = "bold"),
    legend.position = "none"
  )
CCAT: Fast Approximation
CCAT (Correlation of Connectome And Transcriptome) is based on the observation that:
Pluripotent cells express hub genes (high-degree nodes) at higher levels
The CCAT score is simply the Pearson correlation between gene expression and network degree:
where are the node degrees.
# Demonstrate CCAT
ccat_uniform <- CompCCAT(exp_uniform, net13Jun12.m)
ccat_focused <- CompCCAT(exp_focused, net13Jun12.m)

cat("Uniform expression CCAT:", round(mean(ccat_uniform), 4), "\n")
#> Uniform expression CCAT: NA
cat("Focused expression CCAT:", round(mean(ccat_focused), 4), "\n")
#> Focused expression CCAT: 0.4218
Why SR and CCAT Correlate
The mathematical connection:
- High SR ← Uniform signaling flow ← Broad gene expression
- High hub expression ← Broad expression pattern ← High CCAT
Therefore, SR and CCAT capture the same biological phenomenon from different angles.
set.seed(42)
exp_test <- matrix(rpois(5500 * 100, 5), nrow = 5500)
rownames(exp_test) <- head(rownames(net13Jun12.m), 5500)

integ_test <- DoIntegPPI(exp_test, net13Jun12.m)
sr_test <- CompSRana(integ_test)
ccat_test <- CompCCAT(exp_test, net13Jun12.m)

r <- cor(sr_test$SR, ccat_test)
cat("SR-CCAT correlation in random data: r =", round(r, 3), "\n")
#> SR-CCAT correlation in random data: r = 0.856
cat("(Original paper reports r ~ 0.78)\n")
#> (Original paper reports r ~ 0.78)
References
- Teschendorff AE, Enver T. Single-cell entropy for accurate estimation of differentiation potency from a cell’s transcriptome. Nature Communications. 2017;8:15599. doi:10.1038/ncomms15599
Session Info
sessionInfo()
#> R version 4.4.0 (2024-04-24)
#> Platform: aarch64-apple-darwin20
#> Running under: macOS 15.6.1
#>
#> Matrix products: default
#> BLAS:   /Library/Frameworks/R.framework/Versions/4.4-arm64/Resources/lib/libRblas.0.dylib
#> LAPACK: /Library/Frameworks/R.framework/Versions/4.4-arm64/Resources/lib/libRlapack.dylib;  LAPACK version 3.12.0
#>
#> locale:
#> [1] C
#>
#> time zone: Asia/Shanghai
#> tzcode source: internal
#>
#> attached base packages:
#> [1] stats     graphics  grDevices utils     datasets  methods   base
#>
#> other attached packages:
#> [1] Matrix_1.7-4  ggplot2_4.0.1 SCENT_2.0.0
#>
#> loaded via a namespace (and not attached):
#>  [1] gtable_0.3.6       jsonlite_2.0.0     dplyr_1.1.4        compiler_4.4.0
#>  [5] tidyselect_1.2.1   Rcpp_1.1.1         dichromat_2.0-0.1  jquerylib_0.1.4
#>  [9] systemfonts_1.3.1  scales_1.4.0       textshaping_1.0.4  yaml_2.3.12
#> [13] fastmap_1.2.0      lattice_0.22-7     R6_2.6.1           labeling_0.4.3
#> [17] generics_0.1.4     igraph_2.2.1       knitr_1.51         htmlwidgets_1.6.4
#> [21] tibble_3.3.1       desc_1.4.3         pillar_1.11.1      bslib_0.9.0
#> [25] RColorBrewer_1.1-3 rlang_1.1.7        cachem_1.1.0       xfun_0.56
#> [29] fs_1.6.6           sass_0.4.10        S7_0.2.1           otel_0.2.0
#> [33] cli_3.6.5          withr_3.0.2        pkgdown_2.1.3      magrittr_2.0.4
#> [37] digest_0.6.39      grid_4.4.0         lifecycle_1.0.5    vctrs_0.7.0
#> [41] evaluate_1.0.5     glue_1.8.0         farver_2.1.2       ragg_1.5.0
#> [45] rmarkdown_2.30     tools_4.4.0        pkgconfig_2.0.3    htmltools_0.5.9