Introduction
SCENT (Single Cell ENTropy) estimates differentiation potency of single cells from scRNA-Seq data using signaling entropy on protein interaction networks.
This package implements:
- SR (Signaling Entropy Rate): The gold-standard method for accurate potency estimation
- CCAT (Correlation of Connectome And Transcriptome): A fast approximation (~100x faster)
Installation
# Install from GitHub
devtools::install_github("Zaoqu-Liu/SCENT")
Quick Example
library(SCENT)
library(ggplot2)

# Load the built-in PPI network
data(net13Jun12.m)
cat("PPI network:", nrow(net13Jun12.m), "genes,",
    sum(net13Jun12.m)/2, "interactions\n")
#> PPI network: 8434 genes, 303600 interactions
Simulate Single-Cell Data
set.seed(42)

# Simulate expression matrix (genes x cells)
n_genes <- 5500
n_cells <- 100

exp_matrix <- matrix(
  rpois(n_genes * n_cells, lambda = 5),
  nrow = n_genes,
  ncol = n_cells
)
rownames(exp_matrix) <- head(rownames(net13Jun12.m), n_genes)
colnames(exp_matrix) <- paste0("Cell_", 1:n_cells)

cat("Expression matrix:", nrow(exp_matrix), "genes x",
    ncol(exp_matrix), "cells\n")
#> Expression matrix: 5500 genes x 100 cells
Method 2: SR (Accurate)
# Step 1: Integrate expression with PPI network
integ <- DoIntegPPI(exp_matrix, net13Jun12.m)
cat("Integrated:", nrow(integ$expMC), "genes in maximal component\n")
#> Integrated: 5497 genes in maximal component

# Step 2: Compute Signaling Entropy Rate
sr_result <- CompSRana(integ, local = FALSE)

cat("SR scores range:", round(range(sr_result$SR), 4), "\n")
#> SR scores range: 0.8891 0.9016
Compare Methods
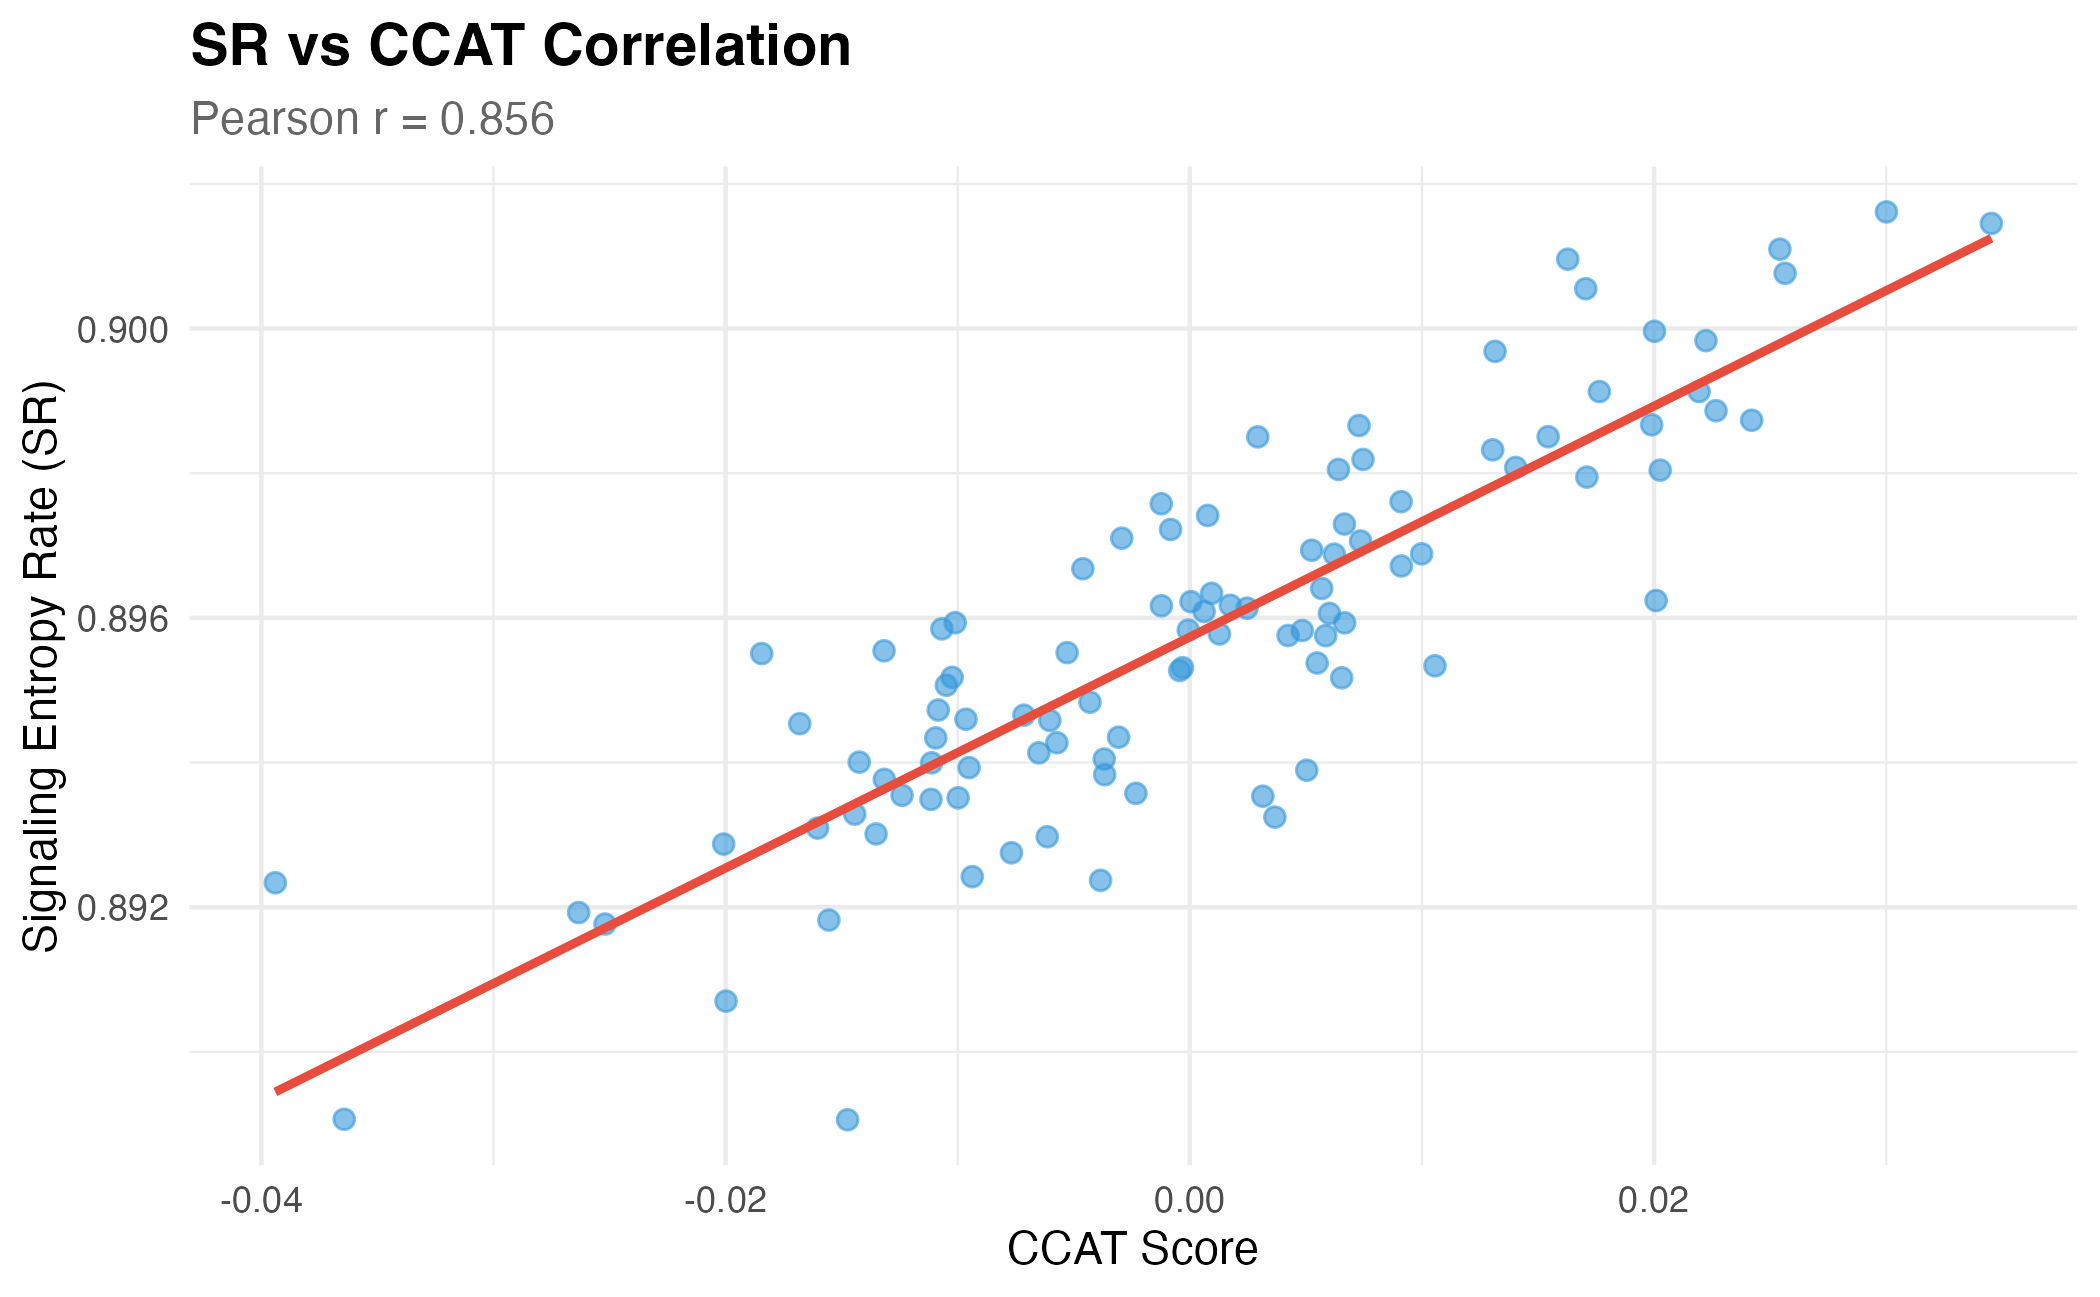
# Correlation between SR and CCAT
cor_value <- cor(sr_result$SR, ccat_scores)
cat("SR-CCAT correlation: r =", round(cor_value, 3), "\n")
#> SR-CCAT correlation: r = 0.856

# Visualization
df <- data.frame(
  SR = sr_result$SR,
  CCAT = ccat_scores,
  Cell = colnames(exp_matrix)
)

ggplot(df, aes(x = CCAT, y = SR)) +
  geom_point(alpha = 0.6, color = "#3498db", size = 2) +
  geom_smooth(method = "lm", color = "#e74c3c", se = FALSE) +
  labs(
    title = "SR vs CCAT Correlation",
    subtitle = paste("Pearson r =", round(cor_value, 3)),
    x = "CCAT Score",
    y = "Signaling Entropy Rate (SR)"
  ) +
  theme_minimal() +
  theme(
    plot.title = element_text(face = "bold", size = 14),
    plot.subtitle = element_text(color = "gray40")
  )
Interpretation
- Higher SR/CCAT scores indicate higher differentiation potency (more stem-like)
- Lower scores indicate more differentiated states
When to Use Each Method
| Scenario | Recommended Method |
|---|---|
| Quick screening | CCAT |
| Publication-quality results | SR |
| Large datasets (>10,000 cells) | CCAT first, then SR on subset |
| Time-sensitive analysis | CCAT |
Session Info
sessionInfo()
#> R version 4.4.0 (2024-04-24)
#> Platform: aarch64-apple-darwin20
#> Running under: macOS 15.6.1
#>
#> Matrix products: default
#> BLAS:   /Library/Frameworks/R.framework/Versions/4.4-arm64/Resources/lib/libRblas.0.dylib
#> LAPACK: /Library/Frameworks/R.framework/Versions/4.4-arm64/Resources/lib/libRlapack.dylib;  LAPACK version 3.12.0
#>
#> locale:
#> [1] C
#>
#> time zone: Asia/Shanghai
#> tzcode source: internal
#>
#> attached base packages:
#> [1] stats     graphics  grDevices utils     datasets  methods   base
#>
#> other attached packages:
#> [1] ggplot2_4.0.1 SCENT_2.0.0
#>
#> loaded via a namespace (and not attached):
#>  [1] Matrix_1.7-4       gtable_0.3.6       jsonlite_2.0.0     dplyr_1.1.4
#>  [5] compiler_4.4.0     tidyselect_1.2.1   Rcpp_1.1.1         dichromat_2.0-0.1
#>  [9] jquerylib_0.1.4    splines_4.4.0      systemfonts_1.3.1  scales_1.4.0
#> [13] textshaping_1.0.4  yaml_2.3.12        fastmap_1.2.0      lattice_0.22-7
#> [17] R6_2.6.1           labeling_0.4.3     generics_0.1.4     igraph_2.2.1
#> [21] knitr_1.51         htmlwidgets_1.6.4  tibble_3.3.1       desc_1.4.3
#> [25] pillar_1.11.1      bslib_0.9.0        RColorBrewer_1.1-3 rlang_1.1.7
#> [29] cachem_1.1.0       xfun_0.56          fs_1.6.6           sass_0.4.10
#> [33] S7_0.2.1           otel_0.2.0         cli_3.6.5          mgcv_1.9-3
#> [37] withr_3.0.2        pkgdown_2.1.3      magrittr_2.0.4     digest_0.6.39
#> [41] grid_4.4.0         nlme_3.1-168       lifecycle_1.0.5    vctrs_0.7.0
#> [45] evaluate_1.0.5     glue_1.8.0         farver_2.1.2       ragg_1.5.0
#> [49] rmarkdown_2.30     tools_4.4.0        pkgconfig_2.0.3    htmltools_0.5.9