Algorithm and Mathematical Framework
Zaoqu Liu
2026-01-29
Source:vignettes/algorithm.Rmd
algorithm.RmdOverview
SCORPION implements the PANDA (Passing Attributes between Networks for Data Assimilation) algorithm, adapted for single-cell data through metacell aggregation. This vignette explains the mathematical framework underlying the algorithm.
The PANDA Algorithm
Core Concept
PANDA is a message-passing algorithm that integrates multiple data sources to infer gene regulatory networks. It iteratively updates three networks:
- Regulatory Network (W): TF → Gene relationships
-
Co-regulatory Network (C): Gene-Gene co-expression
patterns
- Cooperative Network (P): TF-TF cooperation patterns
Mathematical Formulation
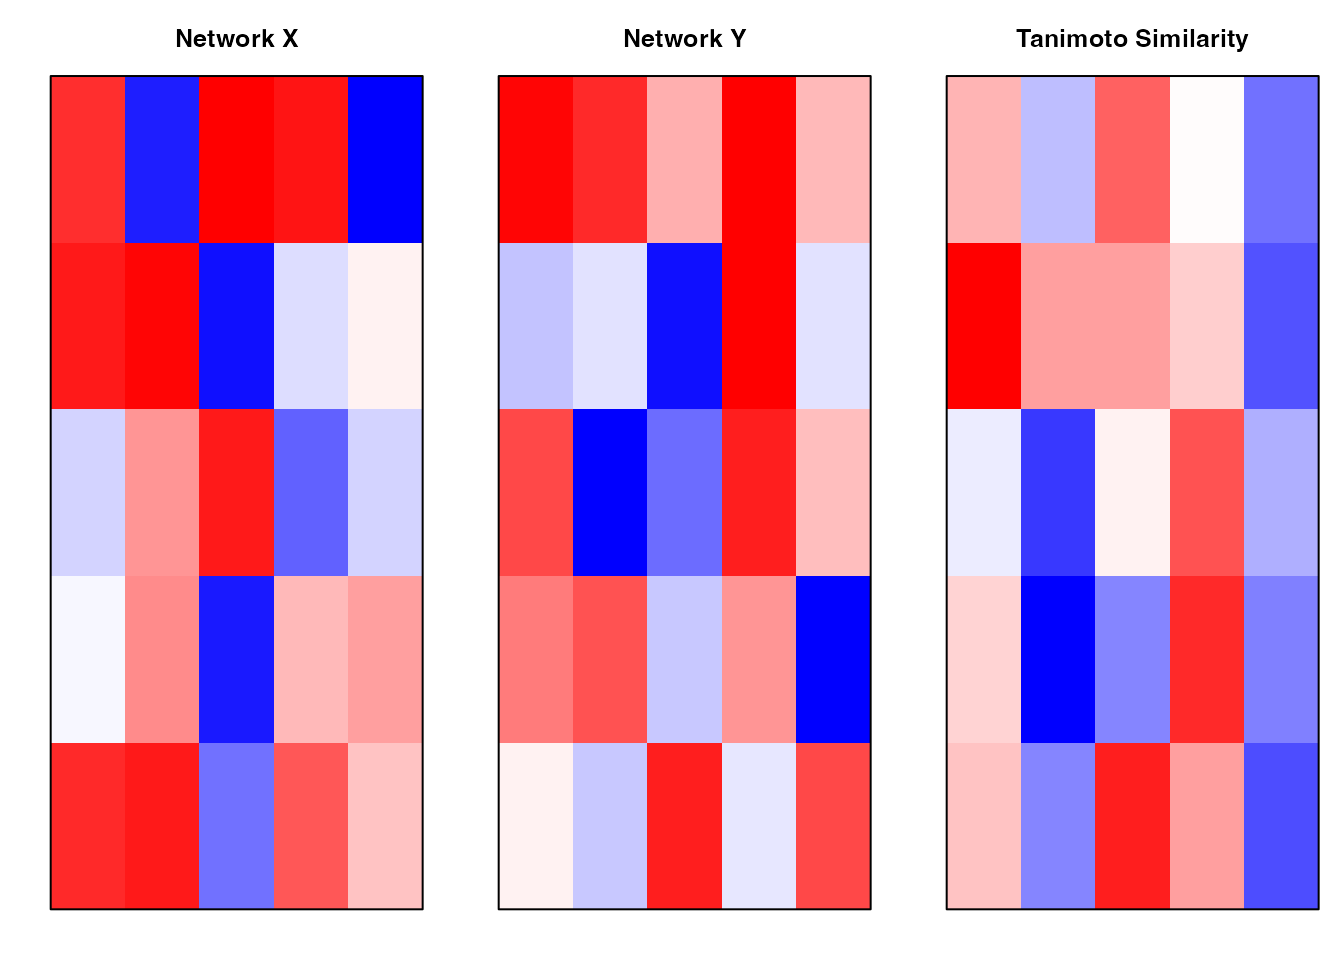
Convergence Criterion
The algorithm converges when the Hamming distance between consecutive regulatory networks falls below a threshold:
# Run SCORPION and track convergence
data(scorpionTest)
set.seed(123)

# Run with high hamming to see more iterations
result <- scorpion(
  tfMotifs = scorpionTest$tf,
  gexMatrix = scorpionTest$gex,
  ppiNet = scorpionTest$ppi,
  gammaValue = 10,
  alphaValue = 0.1,
  hammingValue = 0.001,
  showProgress = FALSE
)

# Simulated convergence curve for illustration
iterations <- 0:10
hamming <- 1 * exp(-0.8 * iterations)

plot(iterations, hamming, type = "b", pch = 19, col = "steelblue",
     xlab = "Iteration", ylab = "Hamming Distance",
     main = "PANDA Convergence", ylim = c(0, 1))
abline(h = 0.001, col = "red", lty = 2)
text(8, 0.05, "Threshold = 0.001", col = "red")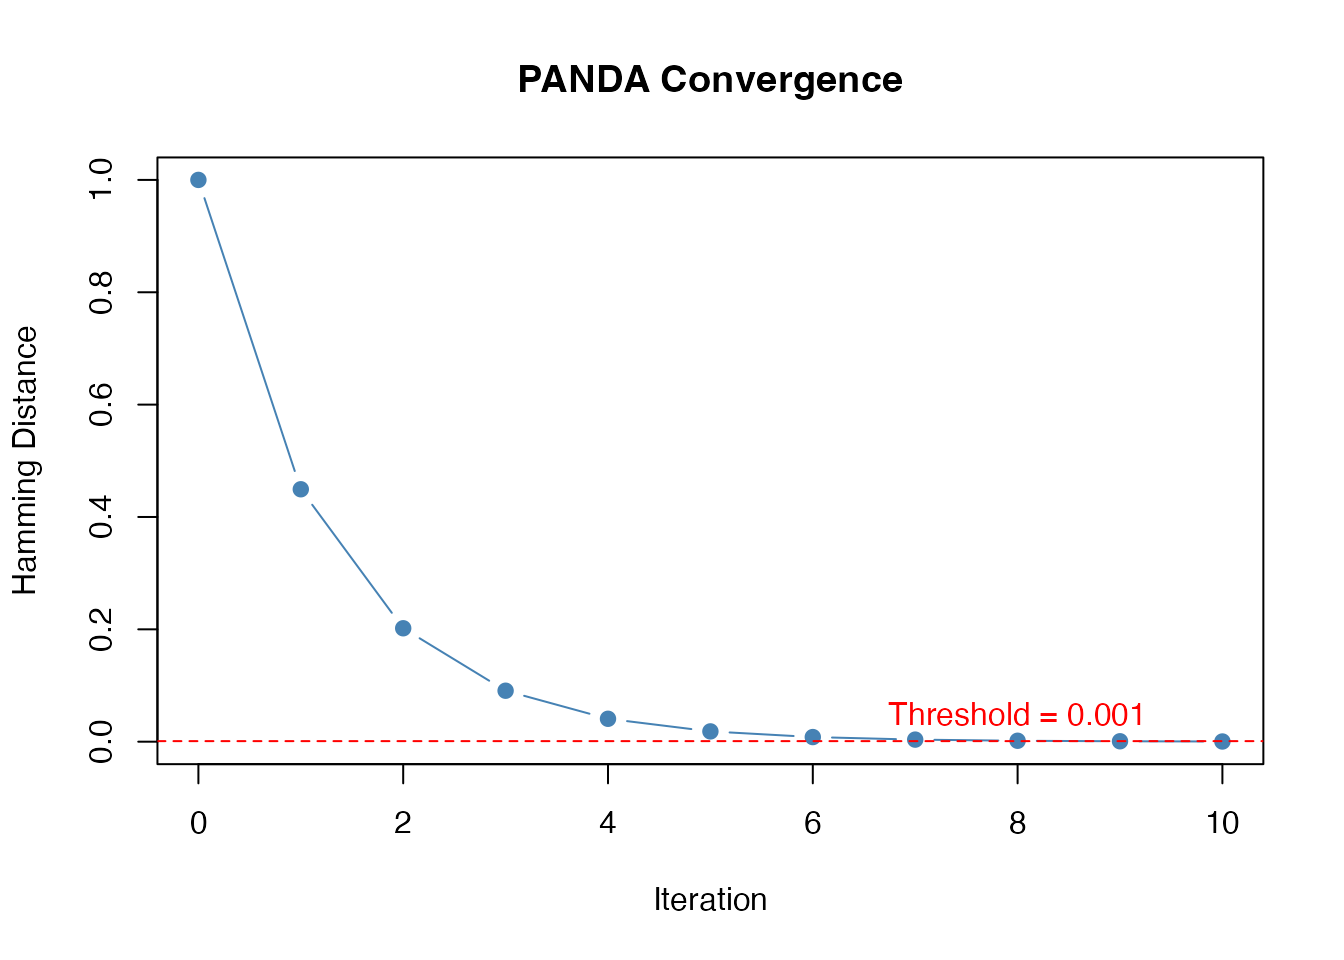
Convergence of PANDA algorithm
Metacell Aggregation
The Sparsity Problem
Single-cell RNA-seq data is inherently sparse due to: - Technical dropout events - Low capture efficiency - Biological variability
Solution: Metacells
SCORPION addresses sparsity by aggregating similar cells into “metacells”:
- PCA dimensionality reduction on variable genes
- k-NN graph construction in PCA space
- Walktrap clustering to identify cell communities
- Expression averaging within clusters
# Illustration of metacell concept
set.seed(42)
n_cells <- 100
n_genes <- 50

# Simulated single-cell data (sparse)
sc_data <- matrix(rpois(n_cells * n_genes, lambda = 0.5), n_genes, n_cells)
sc_data[sc_data > 3] <- 3

# Simulated metacell data (denser)
n_metacells <- 10
mc_data <- matrix(rpois(n_metacells * n_genes, lambda = 5), n_genes, n_metacells)

par(mfrow = c(1, 2), mar = c(4, 4, 3, 1))

# Single-cell heatmap
image(t(sc_data), main = paste0("Single-cell (", n_cells, " cells)"),
      col = colorRampPalette(c("white", "navy"))(100),
      xlab = "Cells", ylab = "Genes", axes = FALSE)
mtext(paste0("Sparsity: ", round(100*mean(sc_data == 0), 1), "%"), side = 1, line = 2.5)

# Metacell heatmap
image(t(mc_data), main = paste0("Metacells (", n_metacells, " metacells)"),
      col = colorRampPalette(c("white", "navy"))(100),
      xlab = "Metacells", ylab = "Genes", axes = FALSE)
mtext(paste0("Sparsity: ", round(100*mean(mc_data == 0), 1), "%"), side = 1, line = 2.5)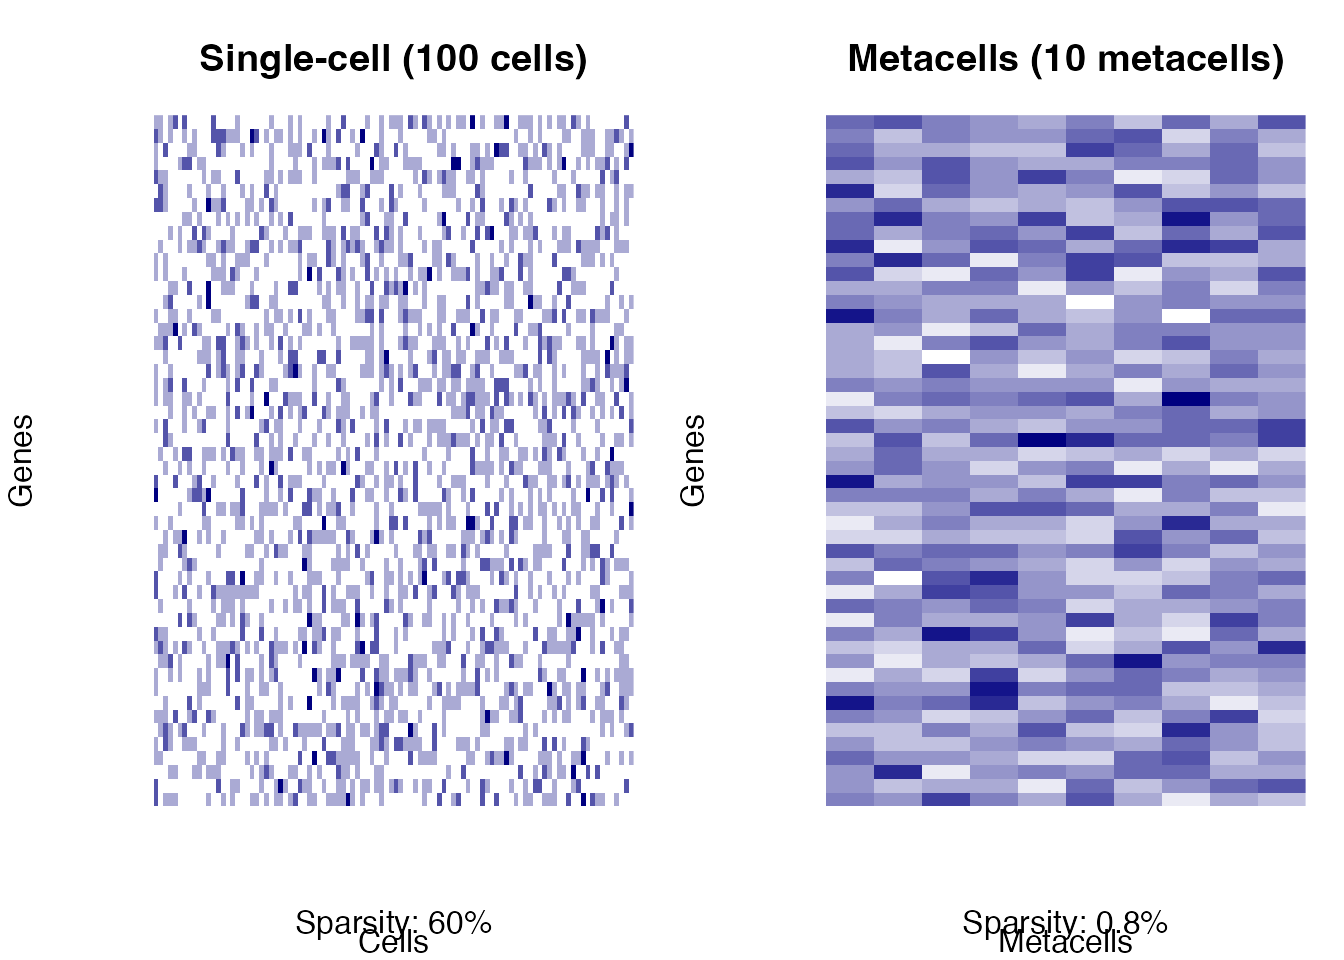
Metacell aggregation concept
Network Normalization
Double Z-score Normalization
Before message passing, all networks are normalized using a double Z-score approach:
where:
This ensures that both row-wise (TF) and column-wise (gene) statistics are considered.
# Illustration of normalization effect
set.seed(42)
raw <- matrix(rnorm(100, mean = 5, sd = 2), 10, 10)
raw[1:3, ] <- raw[1:3, ] + 10  # Add row bias

# Row-wise z-score
z_row <- t(scale(t(raw)))

# Column-wise z-score
z_col <- scale(raw)

# Double z-score
z_double <- (z_row + z_col) / sqrt(2)

par(mfrow = c(2, 2), mar = c(2, 2, 3, 1))
image(raw, main = "Raw Matrix", col = colorRampPalette(c("blue", "white", "red"))(100), axes = FALSE)
image(z_row, main = "Row Z-score", col = colorRampPalette(c("blue", "white", "red"))(100), axes = FALSE)
image(z_col, main = "Column Z-score", col = colorRampPalette(c("blue", "white", "red"))(100), axes = FALSE)
image(z_double, main = "Double Z-score", col = colorRampPalette(c("blue", "white", "red"))(100), axes = FALSE)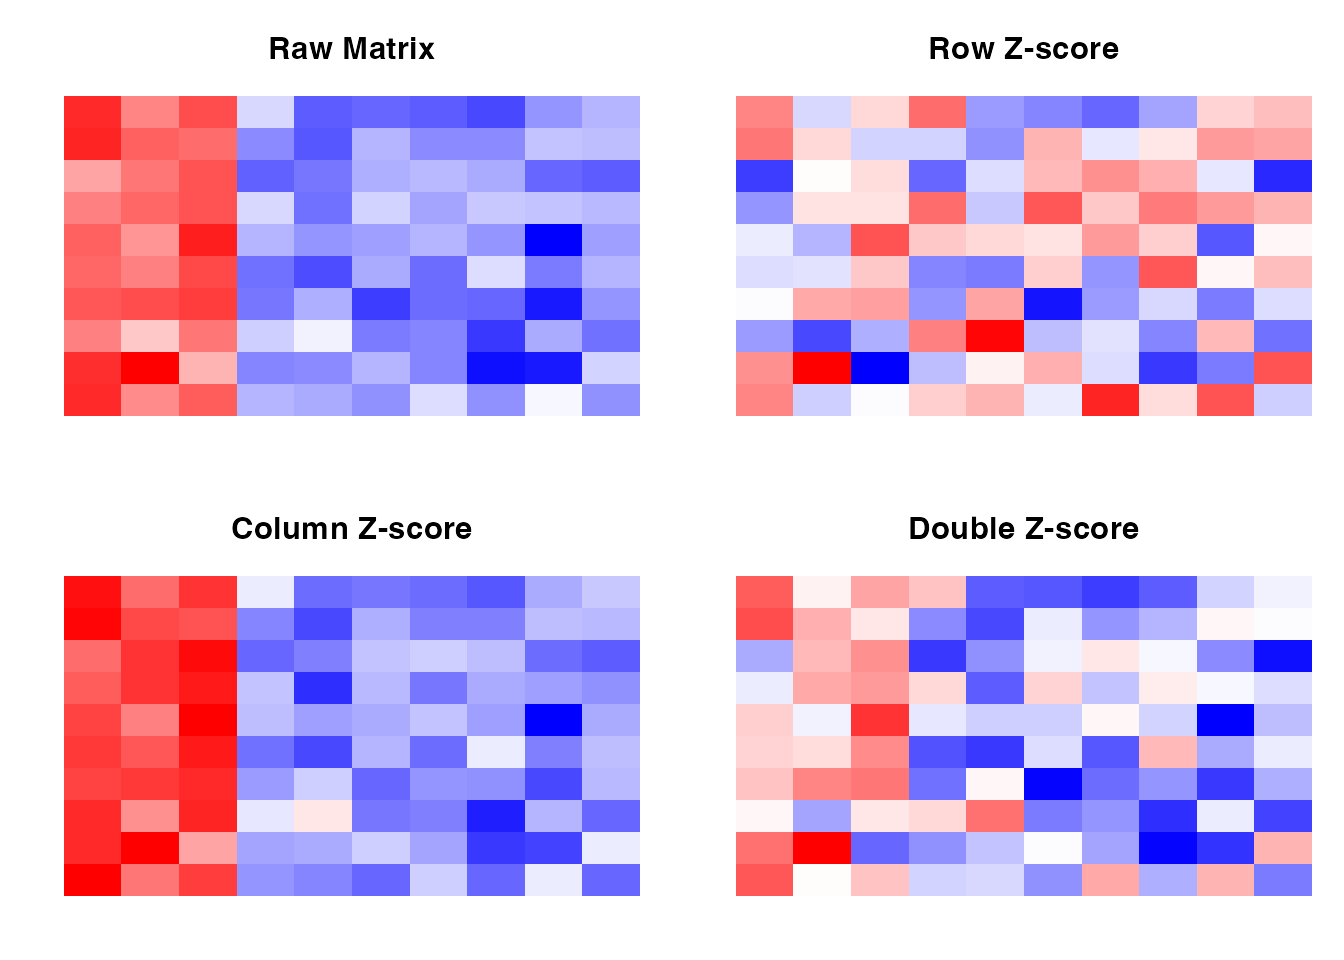
Effect of double Z-score normalization
Computational Complexity
| Operation | Complexity |
|---|---|
| Tanimoto similarity | O(n²m) |
| Network update | O(n²m) |
| Total per iteration | O(n²m) |
| Metacell aggregation | O(c × g) |
Where: - n = number of TFs - m = number of genes - c = number of cells - g = number of genes used for PCA
References
Glass, K., et al. (2013). Passing Messages between Biological Networks to Refine Predicted Interactions. PLoS ONE.
Osorio, D., et al. (2023). Population-level comparisons of gene regulatory networks modeled on high-throughput single-cell transcriptomics data. Nature Computational Science.
Session Information
sessionInfo()
#> R version 4.4.0 (2024-04-24)
#> Platform: aarch64-apple-darwin20
#> Running under: macOS 15.6.1
#>
#> Matrix products: default
#> BLAS:   /Library/Frameworks/R.framework/Versions/4.4-arm64/Resources/lib/libRblas.0.dylib
#> LAPACK: /Library/Frameworks/R.framework/Versions/4.4-arm64/Resources/lib/libRlapack.dylib;  LAPACK version 3.12.0
#>
#> locale:
#> [1] C
#>
#> time zone: Asia/Shanghai
#> tzcode source: internal
#>
#> attached base packages:
#> [1] stats     graphics  grDevices utils     datasets  methods   base
#>
#> other attached packages:
#> [1] SCORPION_1.2.1
#>
#> loaded via a namespace (and not attached):
#>  [1] cli_3.6.5         knitr_1.51        rlang_1.1.7       xfun_0.56
#>  [5] otel_0.2.0        textshaping_1.0.4 jsonlite_2.0.0    htmltools_0.5.9
#>  [9] ragg_1.5.0        sass_0.4.10       rmarkdown_2.30    grid_4.4.0
#> [13] evaluate_1.0.5    jquerylib_0.1.4   fastmap_1.2.0     yaml_2.3.12
#> [17] lifecycle_1.0.5   compiler_4.4.0    igraph_2.2.1      irlba_2.3.5.1
#> [21] fs_1.6.6          pkgconfig_2.0.3   htmlwidgets_1.6.4 pbapply_1.7-4
#> [25] systemfonts_1.3.1 lattice_0.22-7    digest_0.6.39     R6_2.6.1
#> [29] RANN_2.6.2        parallel_4.4.0    magrittr_2.0.4    bslib_0.9.0
#> [33] Matrix_1.7-4      tools_4.4.0       pkgdown_2.2.0     cachem_1.1.0
#> [37] desc_1.4.3