Overview
fastCNV is an R package developed for efficient and accurate inference of Copy Number Variations (CNVs) from single-cell RNA sequencing (scRNA-seq) and spatial transcriptomics data. It provides a comprehensive framework for:
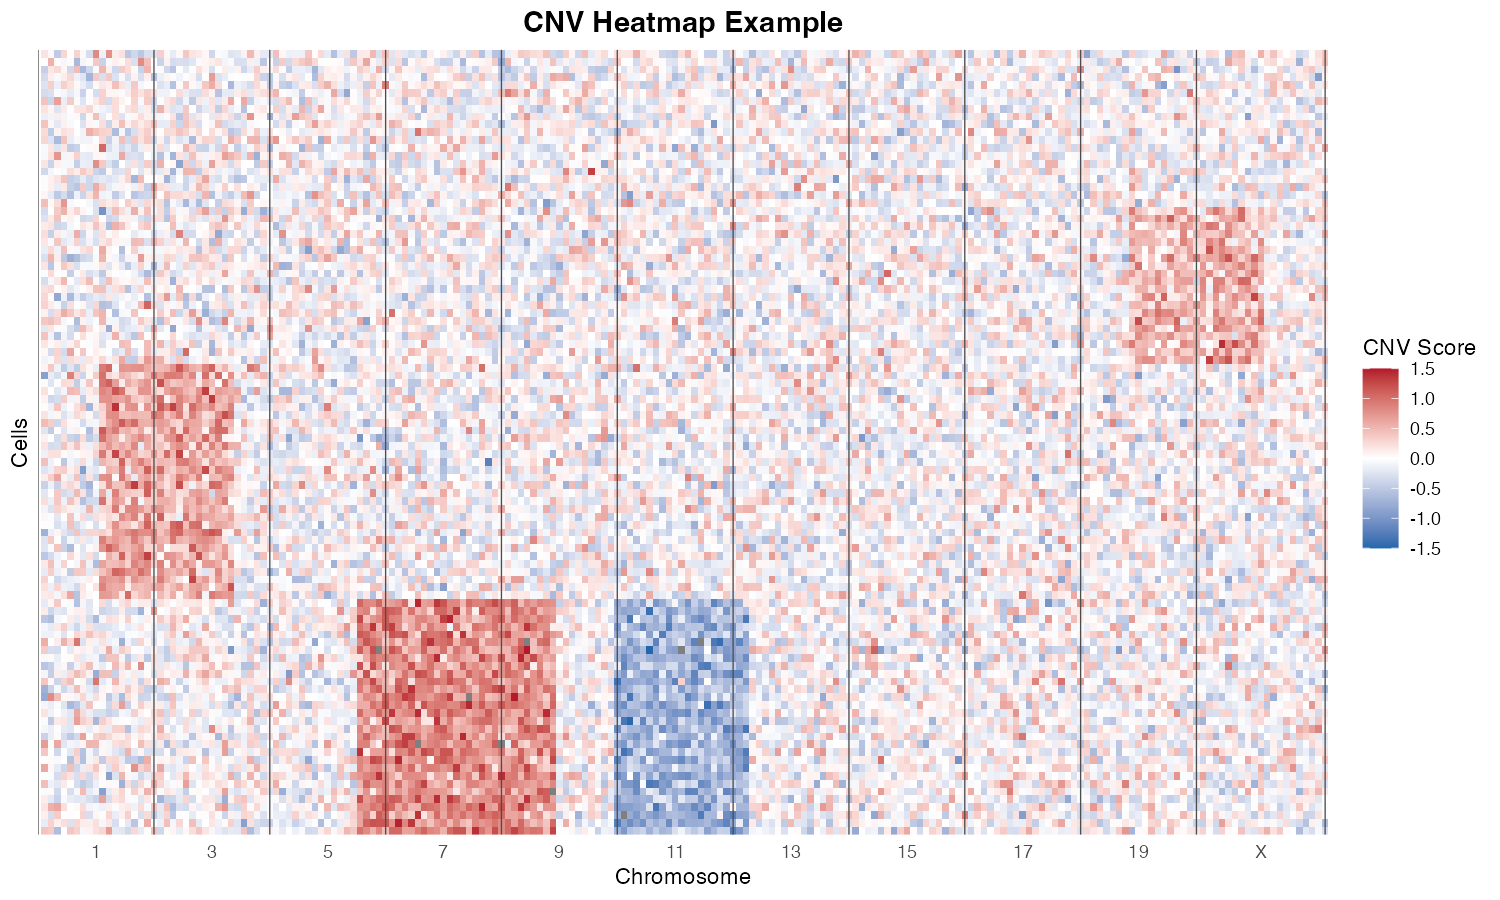
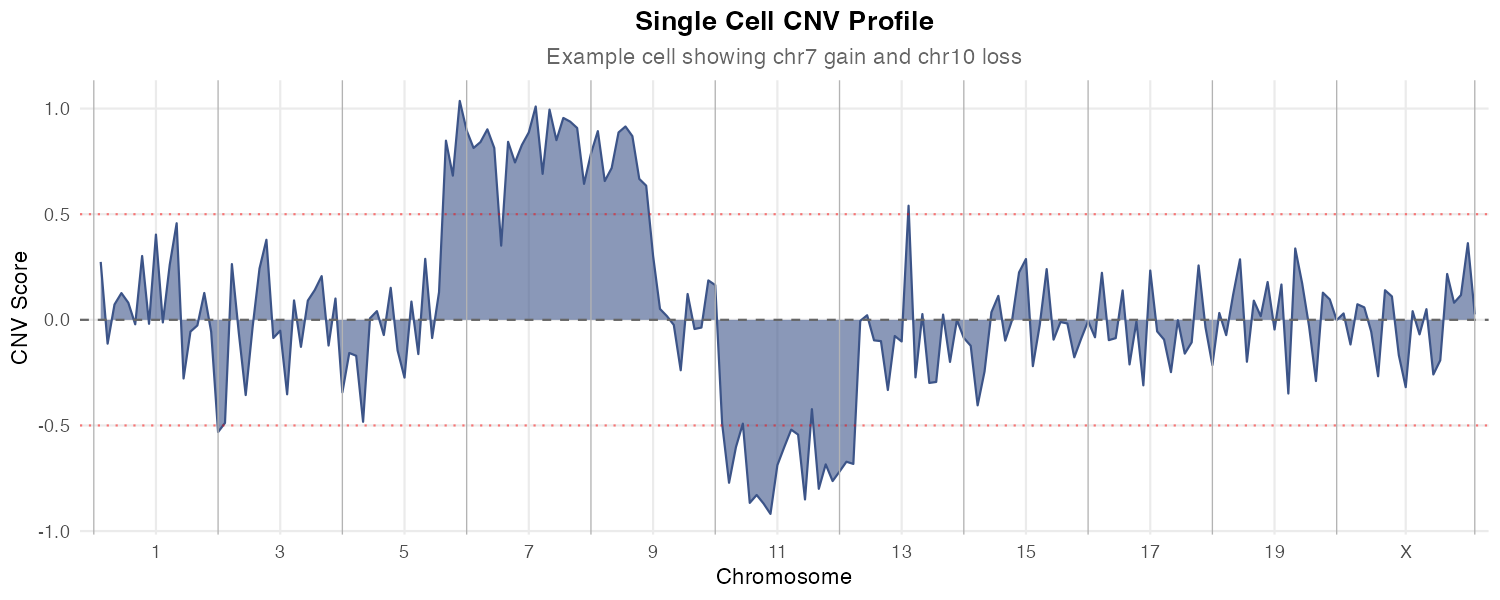
- Detecting chromosomal amplifications and deletions
- Identifying tumor subclones based on CNV profiles
- Reconstructing clonal phylogenetic trees
- Generating publication-ready visualizations
Installation
From R-universe (Recommended)
install.packages("fastCNV", repos = "https://zaoqu-liu.r-universe.dev")From GitHub
if (!requireNamespace("remotes", quietly = TRUE)) {
  install.packages("remotes")
}
remotes::install_github("Zaoqu-Liu/fastCNV")
Quick Start
Basic Workflow
The main function fastCNV() provides an all-in-one
workflow:
library(fastCNV)

# Load your Seurat object
# seurat_obj <- readRDS("your_seurat_object.rds")

# Run CNV analysis
result <- fastCNV(
  seuratObj = seurat_obj,
  sampleName = "Sample1",
  referenceVar = "cell_type",
  referenceLabel = c("Normal_epithelial", "Fibroblast"),
  prepareCounts = TRUE,
  getCNVPerChromosomeArm = TRUE,
  getCNVClusters = TRUE,
  doPlot = TRUE
)
Understanding the Parameters
| Parameter | Description | Default |
|---|---|---|
seuratObj |
Seurat object or list of Seurat objects | Required |
sampleName |
Sample identifier(s) | Required |
referenceVar |
Metadata column for cell type annotation | Required |
referenceLabel |
Cell types to use as reference | Required |
windowSize |
Number of genes per sliding window | 150 |
topNGenes |
Top expressed genes to consider | 7000 |
prepareCounts |
Aggregate counts (for spatial data) | TRUE |
aggregFactor |
Aggregation factor for spatial data | 10 |
Examining Results
After running fastCNV(), the results are stored in the
Seurat object’s metadata:
Supported Data Types
10X Visium HD
result <- fastCNV_10XHD(
  seuratObjHD = visium_hd_seurat,
  sampleName = "VisiumHD_sample",
  referenceVar = "region",
  referenceLabel = c("Normal_tissue"),
  doPlot = TRUE
)
Next Steps
- See the Algorithm Methodology vignette for detailed explanations
- Explore Advanced Visualization options
- Learn about Multi-Sample Analysis workflows
Session Info
sessionInfo()
#> R version 4.4.0 (2024-04-24)
#> Platform: aarch64-apple-darwin20
#> Running under: macOS 15.6.1
#>
#> Matrix products: default
#> BLAS:   /Library/Frameworks/R.framework/Versions/4.4-arm64/Resources/lib/libRblas.0.dylib
#> LAPACK: /Library/Frameworks/R.framework/Versions/4.4-arm64/Resources/lib/libRlapack.dylib;  LAPACK version 3.12.0
#>
#> locale:
#> [1] C
#>
#> time zone: Asia/Shanghai
#> tzcode source: internal
#>
#> attached base packages:
#> [1] stats     graphics  grDevices utils     datasets  methods   base
#>
#> loaded via a namespace (and not attached):
#>  [1] digest_0.6.39     desc_1.4.3        R6_2.6.1          fastmap_1.2.0
#>  [5] xfun_0.56         cachem_1.1.0      knitr_1.51        htmltools_0.5.9
#>  [9] rmarkdown_2.30    lifecycle_1.0.5   cli_3.6.5         sass_0.4.10
#> [13] pkgdown_2.1.3     textshaping_1.0.4 jquerylib_0.1.4   systemfonts_1.3.1
#> [17] compiler_4.4.0    tools_4.4.0       ragg_1.5.0        bslib_0.9.0
#> [21] evaluate_1.0.5    yaml_2.3.12       otel_0.2.0        jsonlite_2.0.0
#> [25] rlang_1.1.7       fs_1.6.6          htmlwidgets_1.6.4