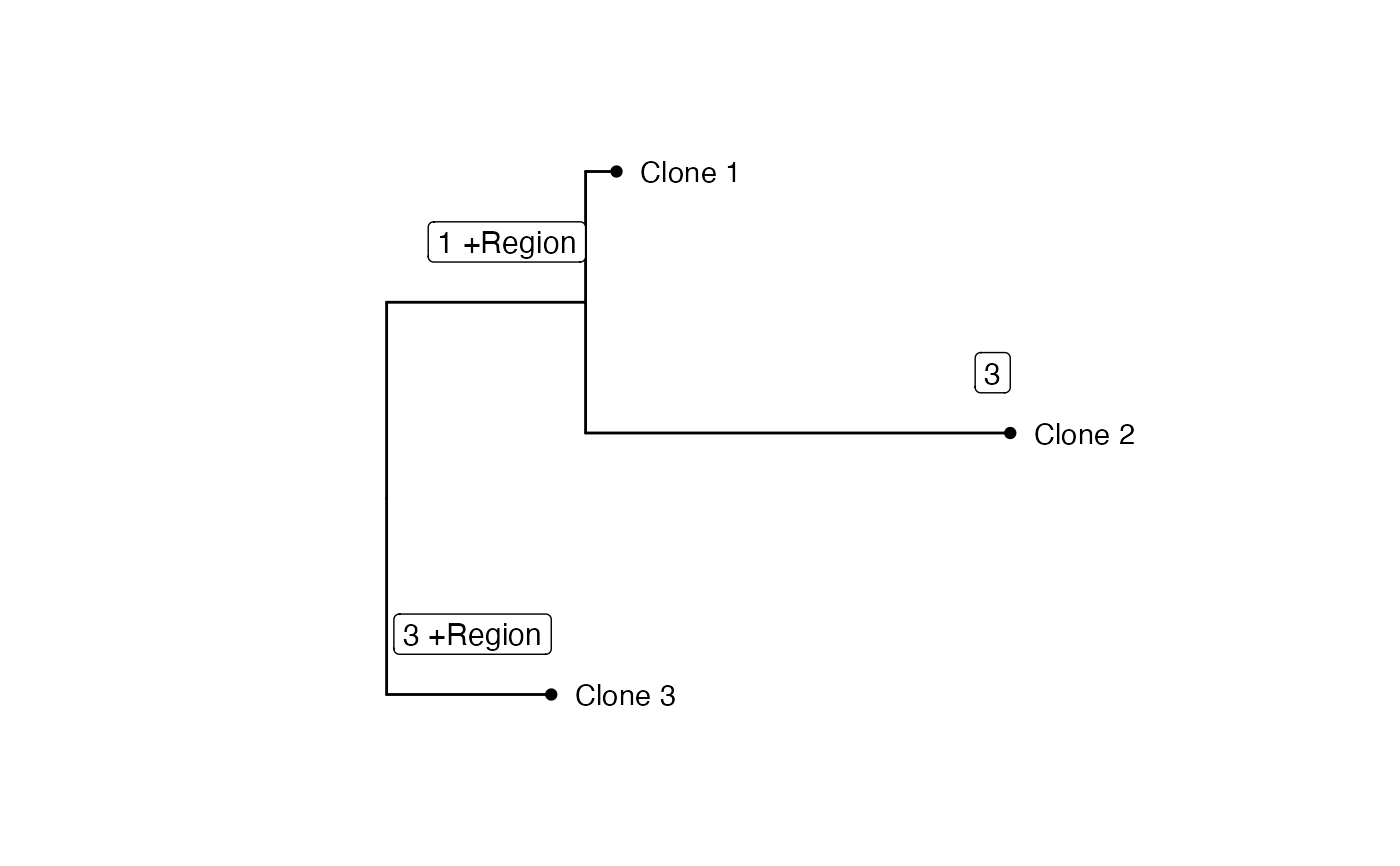
This function generates a plot of an annotated phylogenetic tree using ggtree.
It displays tip labels, tip points, and labels for CNV events associated with
each node.
Arguments
- tree_data
A data frame containing tree structure and annotations, typically produced by
annotateCNVtree.- clone_cols
a color palette to color the clones. If NULL, points are not colored. If TRUE, clones are colored using default color palette. If a palette is given, clones are colored following the palette, with values passed to
scale_color_manual.
Examples
cnv_matrix <- structure(c(0.2, 0.4, 0, 0, 0.1, 0, 0.1, 0.2, 0.2), dim = c(
  3L,
  3L
), dimnames = list(c("Clone 1", "Clone 2", "Clone 3"), c(
  "Region 1",
  "Region 2", "Region 3"
)))
tree <- buildCNVTree(cnv_matrix)
tree_data <- annotateCNVTree(tree, cnv_matrix)
plotCNVTree(tree_data)
#> Warning: `aes_()` was deprecated in ggplot2 3.0.0.
#> i Please use tidy evaluation idioms with `aes()`
#> i The deprecated feature was likely used in the ggtree package.
#>   Please report the issue at <https://github.com/YuLab-SMU/ggtree/issues>.
#> Warning: Arguments in `...` must be used.
#> x Problematic arguments:
#> * layout = layout
#> * mrsd = mrsd
#> * as.Date = as.Date
#> * yscale = yscale
#> * yscale_mapping = yscale_mapping
#> * ladderize = ladderize
#> * right = right
#> * branch.length = branch.length
#> * root.position = root.position
#> * hang = hang
#> i Did you misspell an argument name?
#> Warning: `aes_string()` was deprecated in ggplot2 3.0.0.
#> i Please use tidy evaluation idioms with `aes()`.
#> i See also `vignette("ggplot2-in-packages")` for more information.
#> i The deprecated feature was likely used in the ggtree package.
#>   Please report the issue at <https://github.com/YuLab-SMU/ggtree/issues>.