Advanced Usage and Parameter Tuning
Zaoqu Liu
2026-01-23
Source:vignettes/advanced-usage.Rmd
advanced-usage.RmdIntroduction
This vignette covers advanced usage scenarios and parameter tuning for scTenifoldKnk.
library(scTenifoldKnk)
library(Matrix)

# Load example data
data_path <- system.file("single-cell/example.csv", package = "scTenifoldKnk")
scRNAseq <- as.matrix(read.csv(data_path, row.names = 1))
Parameter Reference
Main Function Parameters
| Parameter | Default | Description |
|---|---|---|
qc_mtThreshold |
0.1 | Max mitochondrial ratio |
qc_minLSize |
1000 | Min library size |
nc_nNet |
10 | Number of networks |
nc_nCells |
500 | Cells per network |
nc_nComp |
3 | Principal components |
nc_q |
0.9 | Quantile threshold |
td_K |
3 | Tensor rank |
td_maxIter |
1000 | Max iterations |
ma_nDim |
2 | Manifold dimensions |
Using Individual Functions
2. Network Construction
# Build single network
net_single <- pcNetFast(
  qc_data,
  nComp = 5,           # More PCs for complex data
  scaleScores = TRUE,
  symmetric = FALSE,
  q = 0.95,            # Higher threshold = sparser network
  verbose = FALSE
)

# Check network properties
cat("Non-zero edges:", sum(net_single != 0), "\n")
#> Non-zero edges: 495
cat("Sparsity:", round(1 - sum(net_single != 0) / length(net_single), 4), "\n")
#> Sparsity: 0.9505
3. Multiple Networks
# Build multiple networks for tensor decomposition
networks <- makeNetworksFast(
  qc_data,
  nNet = 10,
  nCells = min(200, ncol(qc_data)),
  nComp = 3,
  q = 0.9,
  nCores = 1,
  verbose = FALSE,
  seed = 42
)

cat("Generated", length(networks), "networks\n")
#> Generated 10 networks
4. Tensor Decomposition
# Denoise networks
denoised <- tensorDecomposition(
  xList = networks,
  K = 3,              # Tensor rank
  maxIter = 500,
  maxError = 1e-5,
  useCpp = TRUE       # Use C++ for speed
)

cat("Denoised network dimensions:", dim(denoised$X), "\n")
#> Denoised network dimensions: 100 100
5. Manifold Alignment
# Prepare networks
WT <- as.matrix(denoised$X)
diag(WT) <- 0

# Create knockout
KO <- WT
KO["G50", ] <- 0

# Align manifolds
aligned <- manifoldAlignment(
  Matrix(WT, sparse = TRUE),
  Matrix(KO, sparse = TRUE),
  d = 3  # 3D embedding
)

cat("Aligned dimensions:", dim(aligned), "\n")
#> Aligned dimensions: 200 3
6. Differential Regulation
# Analyze differential regulation
dr <- dRegulation(aligned, gKO = "G50")
head(dr)
#>     gene     distance         Z          FC   p.value     p.adj
#> G50  G50 1.840410e-04 -6.162861 7233.906098 0.0000000 0.0000000
#> G70  G70 2.592935e-06 -1.905387    1.435909 0.2308025 0.3429468
#> G74  G74 2.424365e-06 -1.292623    1.255277 0.2625470 0.3429468
#> G43  G43 2.424365e-06 -1.292623    1.255277 0.2625470 0.3429468
#> G53  G53 2.424365e-06 -1.292623    1.255277 0.2625470 0.3429468
#> G55  G55 2.424365e-06 -1.292623    1.255277 0.2625470 0.3429468
Parameter Tuning Guidelines
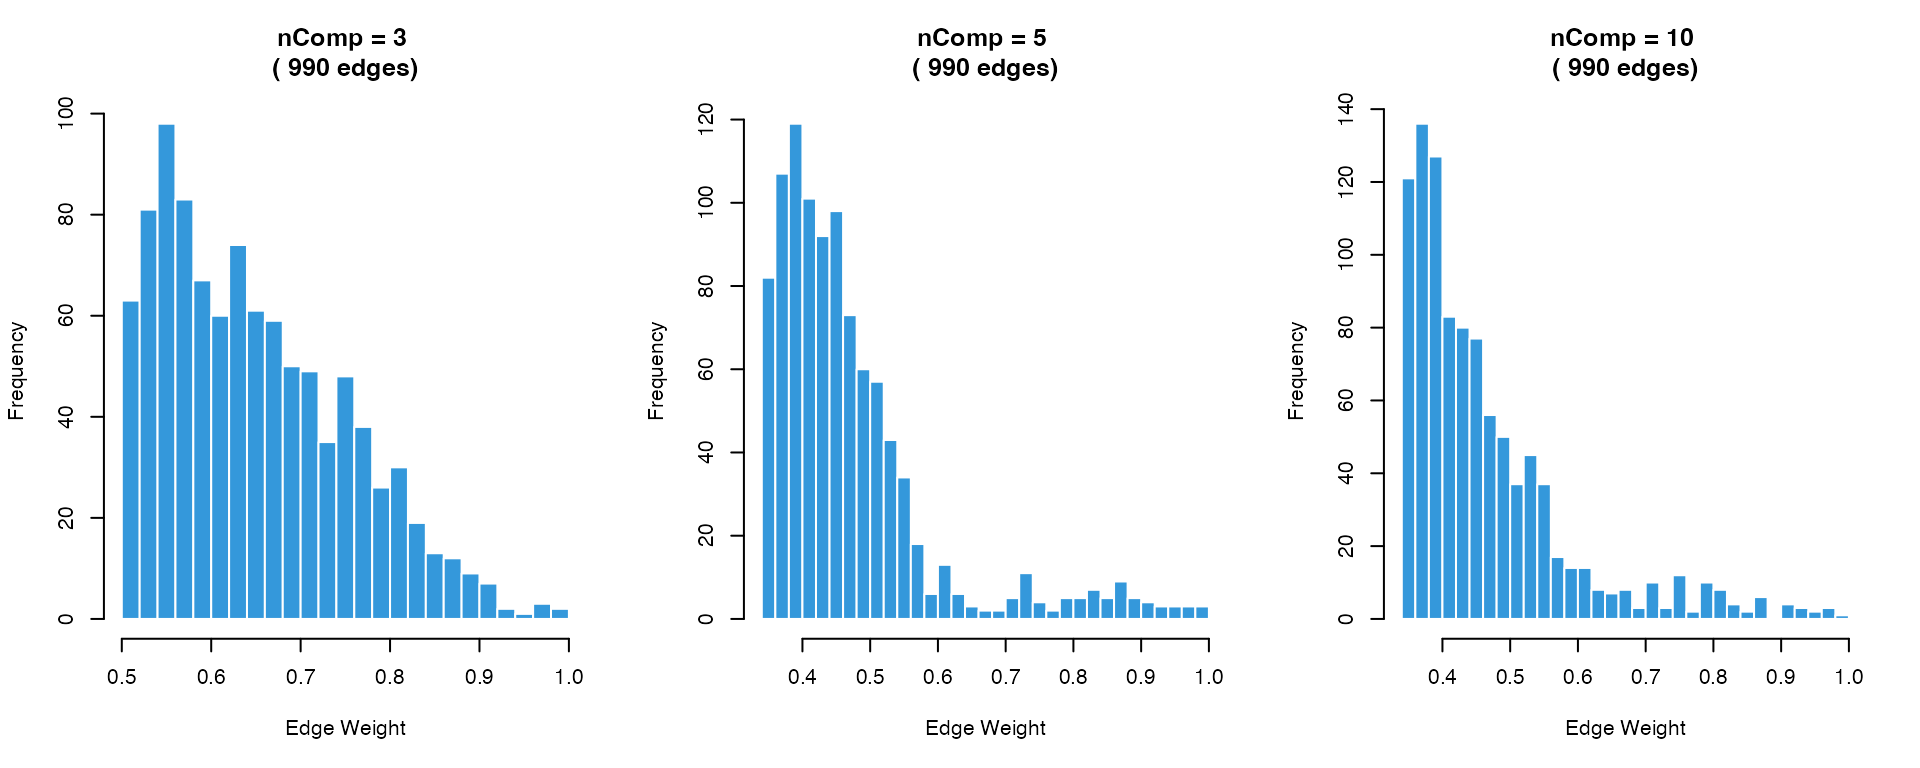
Network Construction Parameters
# Compare different nComp values
par(mfrow = c(1, 3))

for (nc in c(3, 5, 10)) {
  net <- pcNetFast(qc_data, nComp = nc, q = 0.9, verbose = FALSE)
  nnz <- sum(net != 0)

  # Visualize edge weight distribution
  weights <- abs(net@x)
  hist(weights, breaks = 30, col = "#3498DB", border = "white",
       main = paste("nComp =", nc, "\n(", nnz, "edges)"),
       xlab = "Edge Weight", cex.main = 1.2)
}
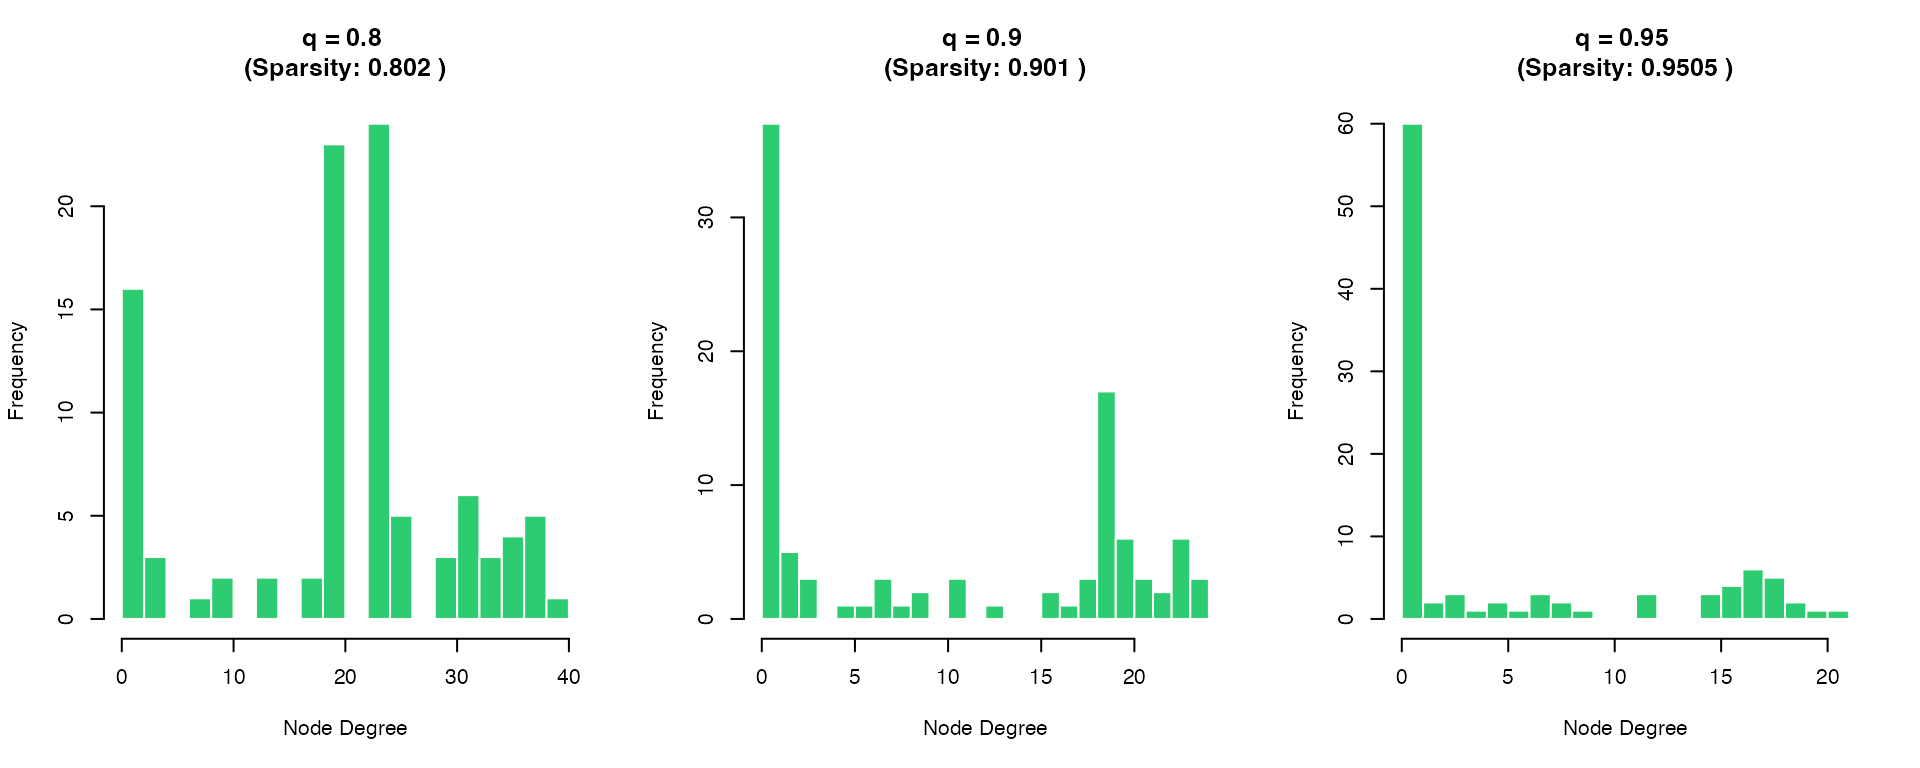
Quantile Threshold Effect
par(mfrow = c(1, 3))

q_values <- c(0.8, 0.9, 0.95)
for (q in q_values) {
  net <- pcNetFast(qc_data, nComp = 3, q = q, verbose = FALSE)
  nnz <- sum(net != 0)
  sparsity <- round(1 - nnz / prod(dim(net)), 4)

  # Network degree distribution
  degrees <- rowSums(net != 0)
  hist(degrees, breaks = 20, col = "#2ECC71", border = "white",
       main = paste("q =", q, "\n(Sparsity:", sparsity, ")"),
       xlab = "Node Degree", cex.main = 1.2)
}
Tensor Rank Selection
# Compare reconstruction error for different K values
networks_small <- makeNetworksFast(qc_data, nNet = 5, nCells = 100,
                                    nComp = 3, verbose = FALSE, seed = 1)

k_values <- c(2, 3, 5, 7, 10)
errors <- numeric(length(k_values))

for (i in seq_along(k_values)) {
  td <- tensorDecomposition(networks_small, K = k_values[i],
                             maxIter = 100, useCpp = TRUE)
  # Compute reconstruction error
  reconstructed <- as.matrix(td$X)
  original_mean <- Reduce(`+`, lapply(networks_small, as.matrix)) / length(networks_small)
  errors[i] <- sqrt(mean((reconstructed - original_mean)^2))
}

plot(k_values, errors, type = "b", pch = 19, col = "#E74C3C", lwd = 2,
     xlab = "Tensor Rank (K)", ylab = "Reconstruction RMSE",
     main = "Tensor Rank Selection")
grid()

# Mark elbow point
optimal_k <- k_values[which.min(diff(diff(errors)) > 0)]
abline(v = optimal_k, lty = 2, col = "#3498DB")
legend("topright", paste("Suggested K =", optimal_k), bty = "n")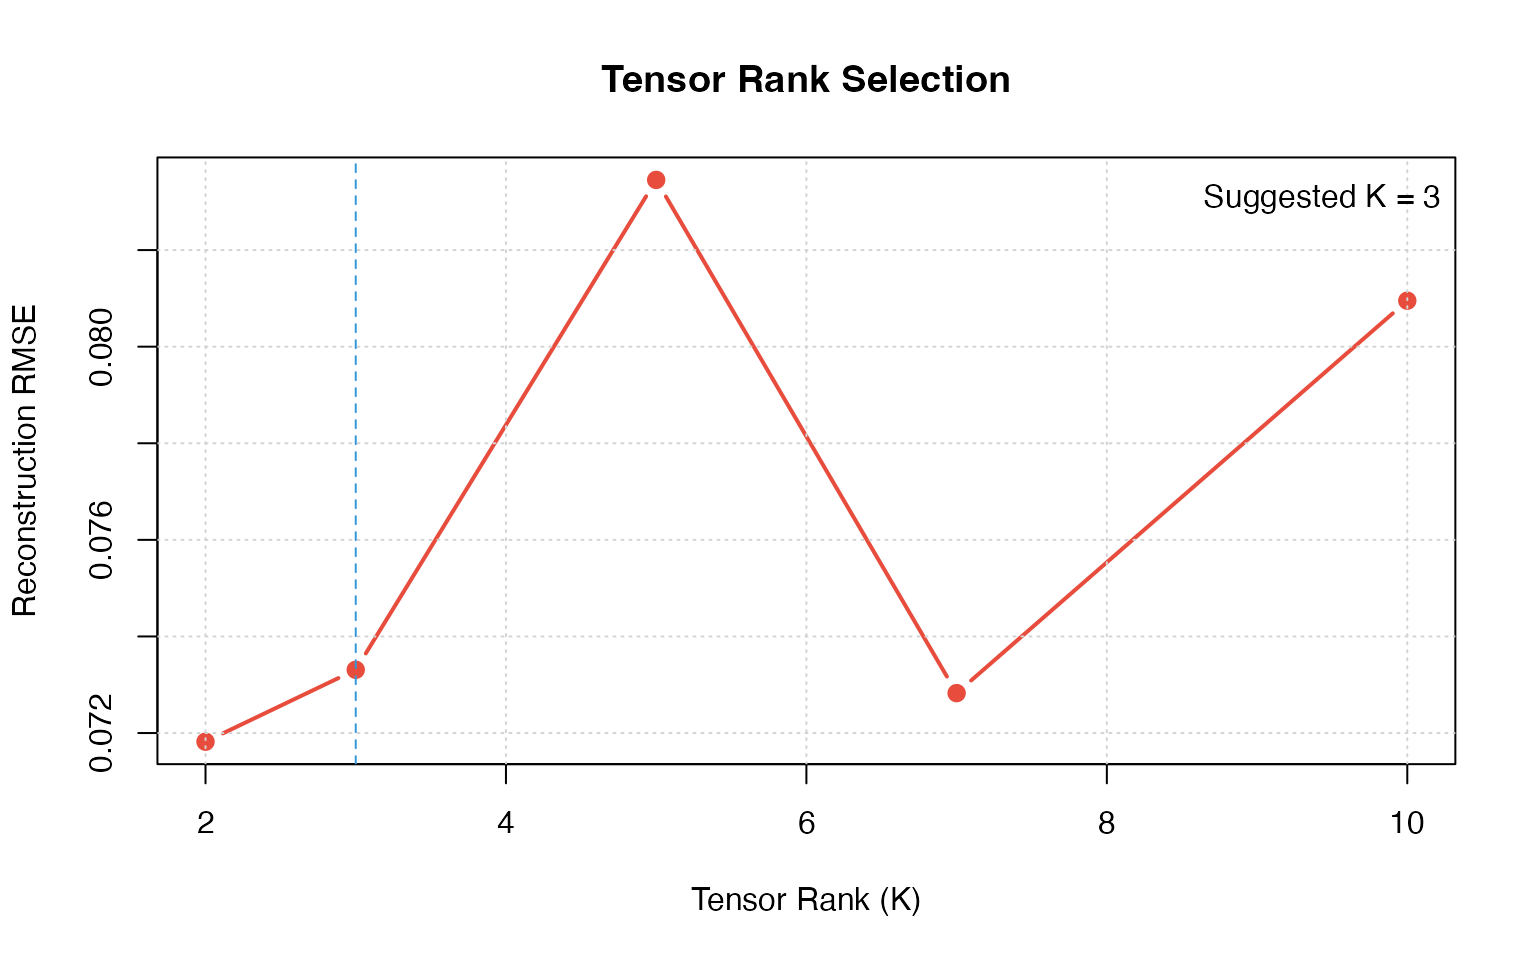
Comparing Multiple Knockouts
# Compare knockouts of different genes
ko_genes <- c("G1", "G50", "G100")
ko_results <- list()

for (gene in ko_genes) {
  ko_results[[gene]] <- scTenifoldKnk(
    scRNAseq, gKO = gene,
    qc_minLSize = 0, nc_nNet = 3, nc_nCells = 100,
    verbose = FALSE
  )
}

# Compare top affected genes
par(mar = c(5, 8, 4, 2))

comparison_data <- sapply(ko_genes, function(g) {
  dr <- ko_results[[g]]$diffRegulation
  dr$FC[1:10]
})
rownames(comparison_data) <- ko_results[[ko_genes[1]]]$diffRegulation$gene[1:10]

barplot(t(comparison_data), beside = TRUE,
        col = c("#E74C3C", "#3498DB", "#2ECC71"),
        las = 2,
        main = "Top 10 Affected Genes by Different Knockouts",
        ylab = "Fold Change",
        cex.names = 0.8)
legend("topright", legend = paste("KO:", ko_genes),
       fill = c("#E74C3C", "#3498DB", "#2ECC71"), bty = "n")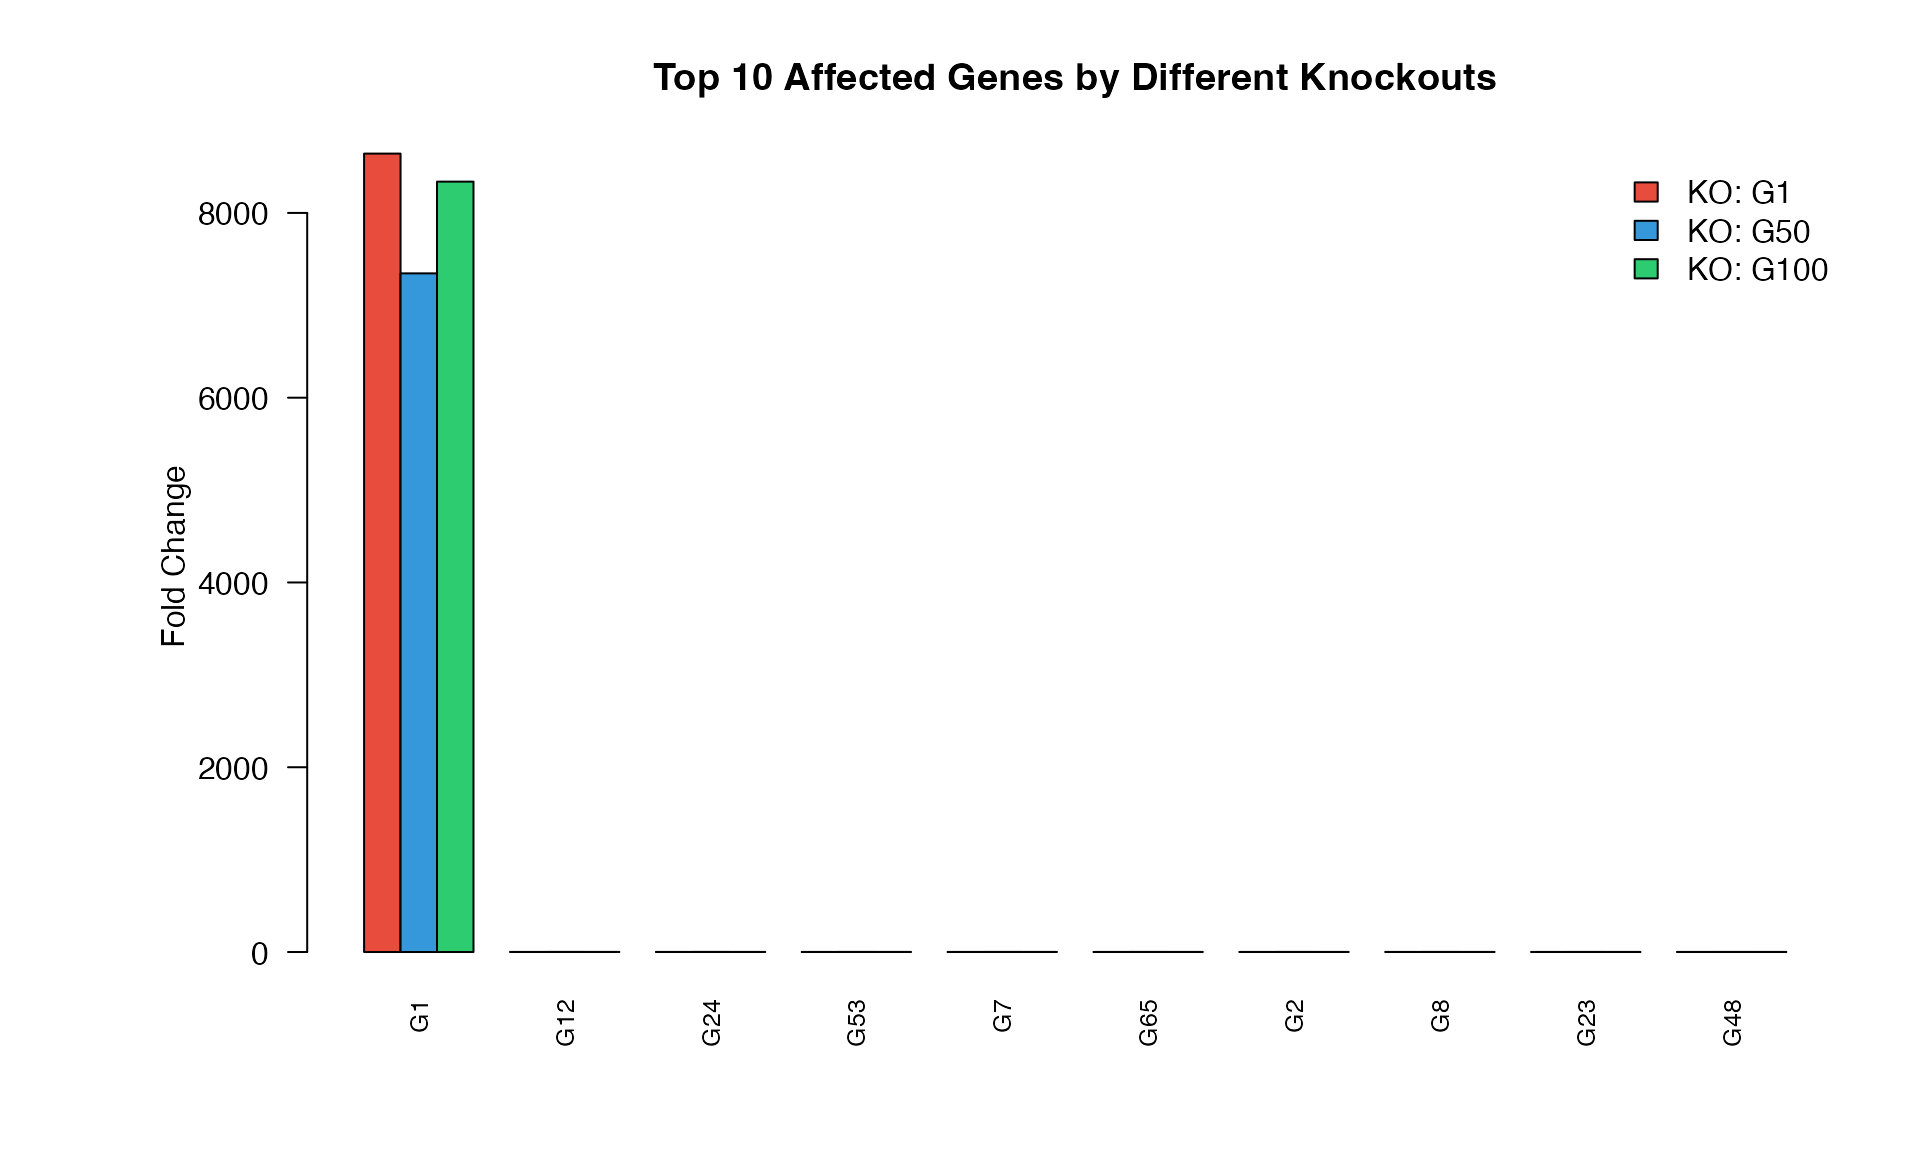
Performance Considerations
Memory Usage
# Estimate memory for different dataset sizes
estimate_memory <- function(n_genes, n_cells, n_networks) {
  # Network matrix: n_genes x n_genes x 8 bytes (double)
  net_size <- n_genes^2 * 8 / 1e6  # MB
  # Total for all networks
  total <- net_size * n_networks * 2  # WT + KO
  return(round(total, 2))
}

sizes <- expand.grid(
  genes = c(100, 500, 1000, 2000),
  networks = c(5, 10, 20)
)
sizes$memory_MB <- mapply(estimate_memory, sizes$genes, 1000, sizes$networks)

knitr::kable(sizes,
             col.names = c("Genes", "Networks", "Est. Memory (MB)"),
caption = "Estimated Memory Usage")| Genes | Networks | Est. Memory (MB) |
|---|---|---|
| 100 | 5 | 0.8 |
| 500 | 5 | 20.0 |
| 1000 | 5 | 80.0 |
| 2000 | 5 | 320.0 |
| 100 | 10 | 1.6 |
| 500 | 10 | 40.0 |
| 1000 | 10 | 160.0 |
| 2000 | 10 | 640.0 |
| 100 | 20 | 3.2 |
| 500 | 20 | 80.0 |
| 1000 | 20 | 320.0 |
| 2000 | 20 | 1280.0 |
Parallel Processing
# Check available cores
cat("Available cores:", parallel::detectCores(), "\n")
#> Available cores: 12

# Benchmark sequential vs parallel (if multiple cores available)
if (parallel::detectCores() > 1) {
  # Sequential
  t1 <- system.time({
    nets1 <- makeNetworksFast(qc_data, nNet = 5, nCells = 50,
                               nCores = 1, verbose = FALSE)
  })

  # Parallel
  t2 <- system.time({
    nets2 <- makeNetworksFast(qc_data, nNet = 5, nCells = 50,
                               nCores = 2, verbose = FALSE)
  })

  cat("Sequential time:", round(t1[3], 2), "s\n")
  cat("Parallel time:", round(t2[3], 2), "s\n")
  cat("Speedup:", round(t1[3] / t2[3], 2), "x\n")
}
#> Sequential time: 0.15 s
#> Parallel time: 0.15 s
#> Speedup: 1.01 x
Best Practices
Session Info
sessionInfo()
#> R version 4.4.0 (2024-04-24)
#> Platform: aarch64-apple-darwin20
#> Running under: macOS 15.6.1
#>
#> Matrix products: default
#> BLAS:   /Library/Frameworks/R.framework/Versions/4.4-arm64/Resources/lib/libRblas.0.dylib
#> LAPACK: /Library/Frameworks/R.framework/Versions/4.4-arm64/Resources/lib/libRlapack.dylib;  LAPACK version 3.12.0
#>
#> locale:
#> [1] C
#>
#> time zone: Asia/Shanghai
#> tzcode source: internal
#>
#> attached base packages:
#> [1] stats     graphics  grDevices utils     datasets  methods   base
#>
#> other attached packages:
#> [1] Matrix_1.7-4        scTenifoldKnk_2.1.0
#>
#> loaded via a namespace (and not attached):
#>  [1] cli_3.6.5         knitr_1.51        rlang_1.1.7       xfun_0.56
#>  [5] otel_0.2.0        textshaping_1.0.4 jsonlite_2.0.0    htmltools_0.5.9
#>  [9] ragg_1.5.0        sass_0.4.10       rmarkdown_2.30    grid_4.4.0
#> [13] evaluate_1.0.5    jquerylib_0.1.4   MASS_7.3-65       fastmap_1.2.0
#> [17] yaml_2.3.12       lifecycle_1.0.5   compiler_4.4.0    RSpectra_0.16-2
#> [21] fs_1.6.6          htmlwidgets_1.6.4 Rcpp_1.1.1        lattice_0.22-7
#> [25] systemfonts_1.3.1 digest_0.6.39     R6_2.6.1          parallel_4.4.0
#> [29] bslib_0.9.0       tools_4.4.0       pkgdown_2.1.3     cachem_1.1.0
#> [33] desc_1.4.3