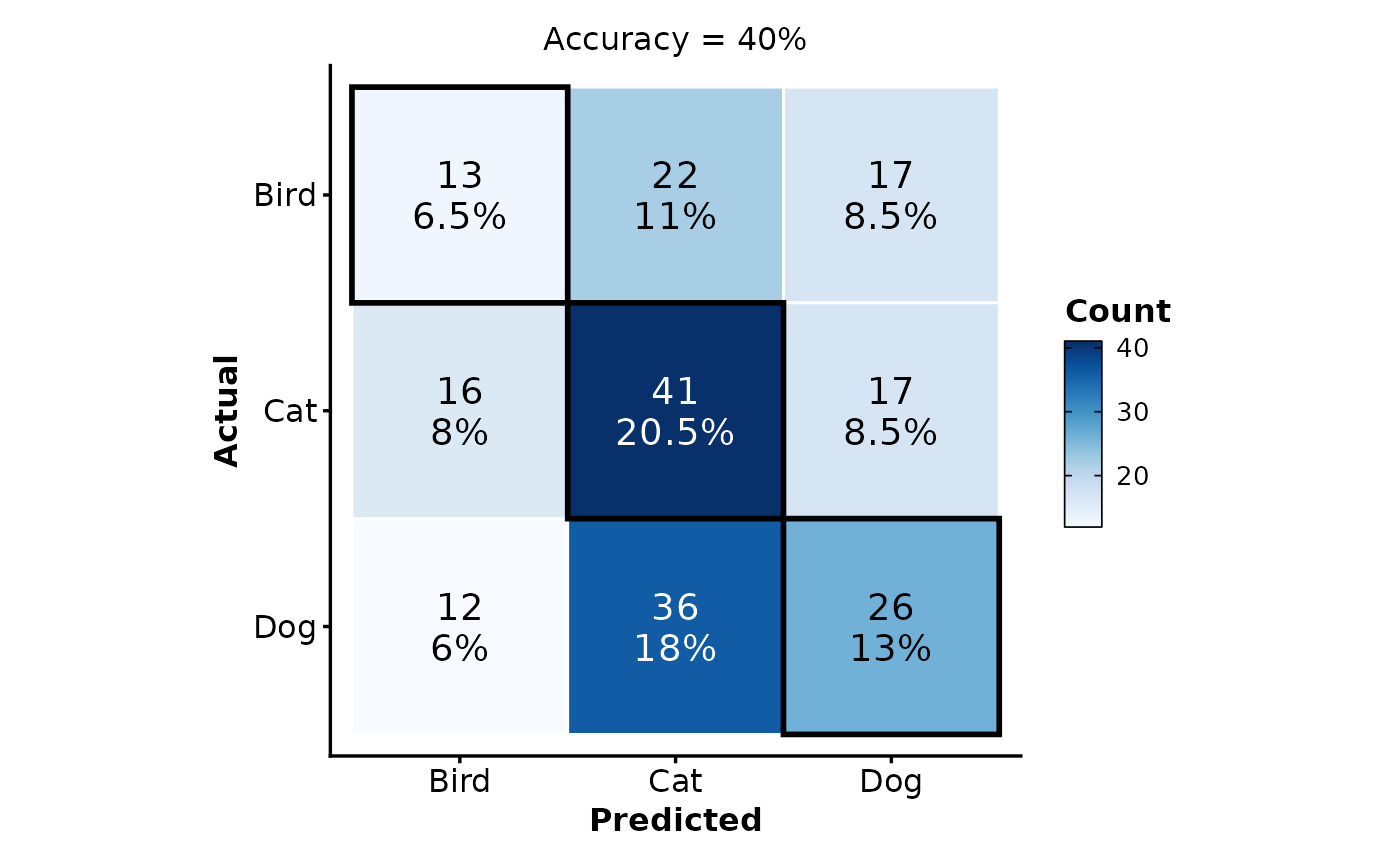
Creates a confusion matrix heatmap for classification results. Shows predicted vs. actual classes with counts and/or percentages, diagonal highlighting, and optional accuracy annotation.
Usage
ConfusionMatrixPlot(
  data,
  truth,
  predicted,
  normalize = FALSE,
  show_counts = TRUE,
  show_percent = TRUE,
  show_accuracy = TRUE,
  text_size = 5,
  text_color = "auto",
  diag_border = "black",
  diag_border_width = 1,
  split_by = NULL,
  split_by_sep = "_",
  theme = "theme_ggforge",
  theme_args = list(),
  palette = "Blues",
  palcolor = NULL,
  alpha = 1,
  legend.position = "right",
  legend.direction = "vertical",
  title = NULL,
  subtitle = NULL,
  xlab = NULL,
  ylab = NULL,
  seed = 8525,
  combine = TRUE,
  nrow = NULL,
  ncol = NULL,
  byrow = TRUE,
  axes = NULL,
  axis_titles = NULL,
  guides = NULL,
  design = NULL,
  ...
)
Arguments
- data
A data frame containing the data to plot
- truth
Column for true/actual classes.
- predicted
Column for predicted classes.
- normalize
Whether to normalize by row ("row"), column ("col"), total ("all"), or not at all (FALSE).
- show_counts
Whether to show count numbers in cells.
- show_percent
Whether to show percentages in cells.
- show_accuracy
Whether to annotate overall accuracy.
- text_size
Size of cell text.
- text_color
Color of cell text (or "auto" for contrast).
- diag_border
Color of diagonal cell borders.
- diag_border_width
Width of diagonal borders.
- split_by
Column name(s) to split data into multiple plots
- split_by_sep
Separator when concatenating multiple split_by columns
- theme
Theme name (string) or theme function
- theme_args
List of arguments passed to theme function
- palette
Color palette name
- palcolor
Custom colors for palette
- alpha
Transparency level (0-1)
- legend.position
Legend position: "none", "left", "right", "bottom", "top"
- legend.direction
Legend direction: "horizontal" or "vertical"
- title
Plot title
- subtitle
Plot subtitle
- xlab
X-axis label
- ylab
Y-axis label
- seed
Random seed for reproducibility
- combine
Whether to combine split plots into one
- nrow
Number of rows when combining plots
- ncol
Number of columns when combining plots
- byrow
Fill combined plots by row
- axes
How to handle axes in combined plots ("keep", "collect", "collect_x", "collect_y")
- axis_titles
How to handle axis titles in combined plots
- guides
How to handle guides in combined plots ("collect", "keep", "auto")
- design
Custom layout design for combined plots
- ...
Additional arguments passed to atomic plotting functions.
Examples
# \donttest{
set.seed(42)
data <- data.frame(
  actual = sample(c("Cat", "Dog", "Bird"), 200, replace = TRUE,
    prob = c(0.4, 0.35, 0.25)),
  predicted = sample(c("Cat", "Dog", "Bird"), 200, replace = TRUE,
    prob = c(0.45, 0.35, 0.2))
)
ConfusionMatrixPlot(data, truth = "actual", predicted = "predicted")

# }
# }