Creates a Manhattan plot for visualizing genome-wide association study (GWAS) results.
This function is adapted from ggmanh::manhattan_plot() with several enhancements:
Parameter names use underscores instead of dots for consistency
chr.colname,pos.colname,pval.colnameandlabel.colnameare renamed tochr_by,pos_by,pval_byandlabel_byThe
chromosomeandchr.orderarguments are merged intochromosomesThe
highlight.colnameargument is replaced withhighlight, which can be a vector of indices or a character expression to select variants, instead of a column namePoint styling controlled by
pt_*arguments (size, color, alpha, shape)Label styling controlled by
label_*argumentsHighlight styling controlled by
highlight_*argumentsFlexible p-value transformation via
pval_transformfunctionImproved significance threshold handling
Usage
ManhattanPlot(
  data,
  chr_by,
  pos_by,
  pval_by,
  split_by = NULL,
  split_by_sep = "_",
  label_by = NULL,
  chromosomes = NULL,
  pt_size = 0.75,
  pt_color = NULL,
  pt_alpha = alpha,
  pt_shape = 19,
  label_size = 3,
  label_fg = NULL,
  highlight = NULL,
  highlight_color = NULL,
  highlight_size = 1.5,
  highlight_alpha = 1,
  highlight_shape = 19,
  preserve_position = TRUE,
  chr_gap_scaling = 1,
  pval_transform = "-log10",
  signif = c(5e-08, 1e-05),
  signif_color = NULL,
  signif_rel_pos = 0.2,
  signif_label = TRUE,
  signif_label_size = 3.5,
  signif_label_pos = c("left", "right"),
  thin = NULL,
  thin_n = 1000,
  thin_bins = 200,
  rescale = TRUE,
  rescale_ratio_threshold = 5,
  palette = "Dark2",
  palcolor = NULL,
  palreverse = FALSE,
  alpha = 1,
  theme = "theme_ggforge",
  theme_args = list(),
  title = NULL,
  subtitle = NULL,
  xlab = NULL,
  ylab = expression("-" * log[10](p)),
  seed = 8525,
  combine = TRUE,
  nrow = NULL,
  ncol = NULL,
  byrow = TRUE,
  axes = NULL,
  axis_titles = NULL,
  guides = NULL,
  facet_by = NULL,
  design = NULL,
  ...
)
Arguments
- data
A data frame or
GenomicRanges::GRangescontaining the data to be plotted.- chr_by
Column name for chromosome (default: "chr").
- pos_by
Column name for position (default: "pos").
- pval_by
Column name for p-value (default: "pval").
- split_by
Column name(s) to split data into multiple plots
- split_by_sep
Separator when concatenating multiple split_by columns
- label_by
Column name for the variants to be labeled (default: NULL). Only the variants with non-empty values in this column will be labeled.
- chromosomes
A vector of chromosomes to be plotted (default: NULL). If NULL, all chromosomes will be plotted. Can be used to select chromosomes to be plotted or to set the order of the chromosomes.
- pt_size
A numeric value to specify the size of the points in the plot.
- pt_color
A character string to specify the color of the points in the plot. By default, the color of the points will be controlled by
paletteorpalcolorarguments. This is useful to color the background points whenhighlightandhighlight_colorare specified.- pt_alpha
A numeric value to specify the transparency of the points in the plot.
- pt_shape
A numeric value to specify the shape of the points in the plot.
- label_size
A numeric value to specify the size of the labels in the plot.
- label_fg
A character string to specify the color of the labels in the plot. If NULL, the color of the labels will be the same as the points.
- highlight
Either a vector of indices or a character expression to select the variants to be highlighted (default: NULL). If NULL, no variants will be highlighted.
- highlight_color
A character string to specify the color of the highlighted points.
- highlight_size
A numeric value to specify the size of the highlighted points.
- highlight_alpha
A numeric value to specify the transparency of the highlighted points.
- highlight_shape
A numeric value to specify the shape of the highlighted points.
- preserve_position
If TRUE, the width of each chromosome reflects the number of variants and the position of each variant is correctly scaled. If FALSE, the width of each chromosome is equal and the variants are equally spaced.
- chr_gap_scaling
A numeric value to specify the scaling of the gap between chromosomes. It is used to adjust the gap between chromosomes in the plot.
- pval_transform
A function to transform the p-values (default: "-log10"). If it is a character, it will be evaluated as a function.
- signif
A vector of significance thresholds (default: c(5e-08, 1e-05)).
- signif_color
A character vector of equal length as signif. It contains colors for the lines drawn at signif. If NULL, the smallest value is colored black while others are grey.
- signif_rel_pos
A numeric between 0.1 and 0.9. If the plot is rescaled, where should the significance threshold be positioned?
- signif_label
A logical value indicating whether to label the significance thresholds (default: TRUE).
- signif_label_size
A numeric value to specify the size of the significance labels.
- signif_label_pos
A character string specifying the position of the significance labels. It can be either "left" or "right" (default: "left").
- thin
A logical value indicating whether to thin the data (default: NULL). Defaults to TRUE when
chromosomesis specified and the length of it is less than the number of chromosomes in the data. Defaults to FALSE otherwise.- thin_n
Number of max points per horizontal partitions of the plot. Defaults to 1000.
- thin_bins
Number of bins to partition the data. Defaults to 200.
- rescale
A logical value indicating whether to rescale the plot (default: TRUE).
- rescale_ratio_threshold
A numeric value to specify the ratio threshold for rescaling.
- palette
Color palette name
- palcolor
Custom colors for palette
- palreverse
A logical value indicating whether to reverse the palette for chromosomes (default: FALSE).
- alpha
Transparency level (0-1)
- theme
Theme name (string) or theme function
- theme_args
List of arguments passed to theme function
- title
Plot title
- subtitle
Plot subtitle
- xlab
X-axis label
- ylab
Y-axis label
- seed
Random seed for reproducibility
- combine
Whether to combine split plots into one
- nrow
Number of rows when combining plots
- ncol
Number of columns when combining plots
- byrow
Fill combined plots by row
- axes
How to handle axes in combined plots ("keep", "collect", "collect_x", "collect_y")
- axis_titles
How to handle axis titles in combined plots
- guides
How to handle guides in combined plots ("collect", "keep", "auto")
- facet_by
Column name(s) for faceting the plot
- design
Custom layout design for combined plots
- ...
Additional arguments passed to atomic plotting functions.
Value
A ggplot object or wrap_plots object or a list of ggplot objects.
If no split_by is provided, a single plot (ggplot object) will be returned.
If 'combine' is TRUE, a wrap_plots object will be returned.
If 'combine' is FALSE, a list of ggplot objects will be returned.
See also
Other genomics-plots:
UpsetPlot(),
VennDiagram(),
VolcanoPlot()
Examples
# \donttest{
set.seed(1000)
nsim <- 50000
simdata <- data.frame(
"chromosome" = sample(c(1:22, "X"), size = nsim, replace = TRUE),
"position" = sample(1:100000000, size = nsim),
"P.value" = rbeta(nsim, shape1 = 5, shape2 = 1)^7,
"cohort" = sample(c("A", "B"), size = nsim, replace = TRUE)
)
simdata$chromosome <- factor(simdata$chromosome, c(1:22, "X"))
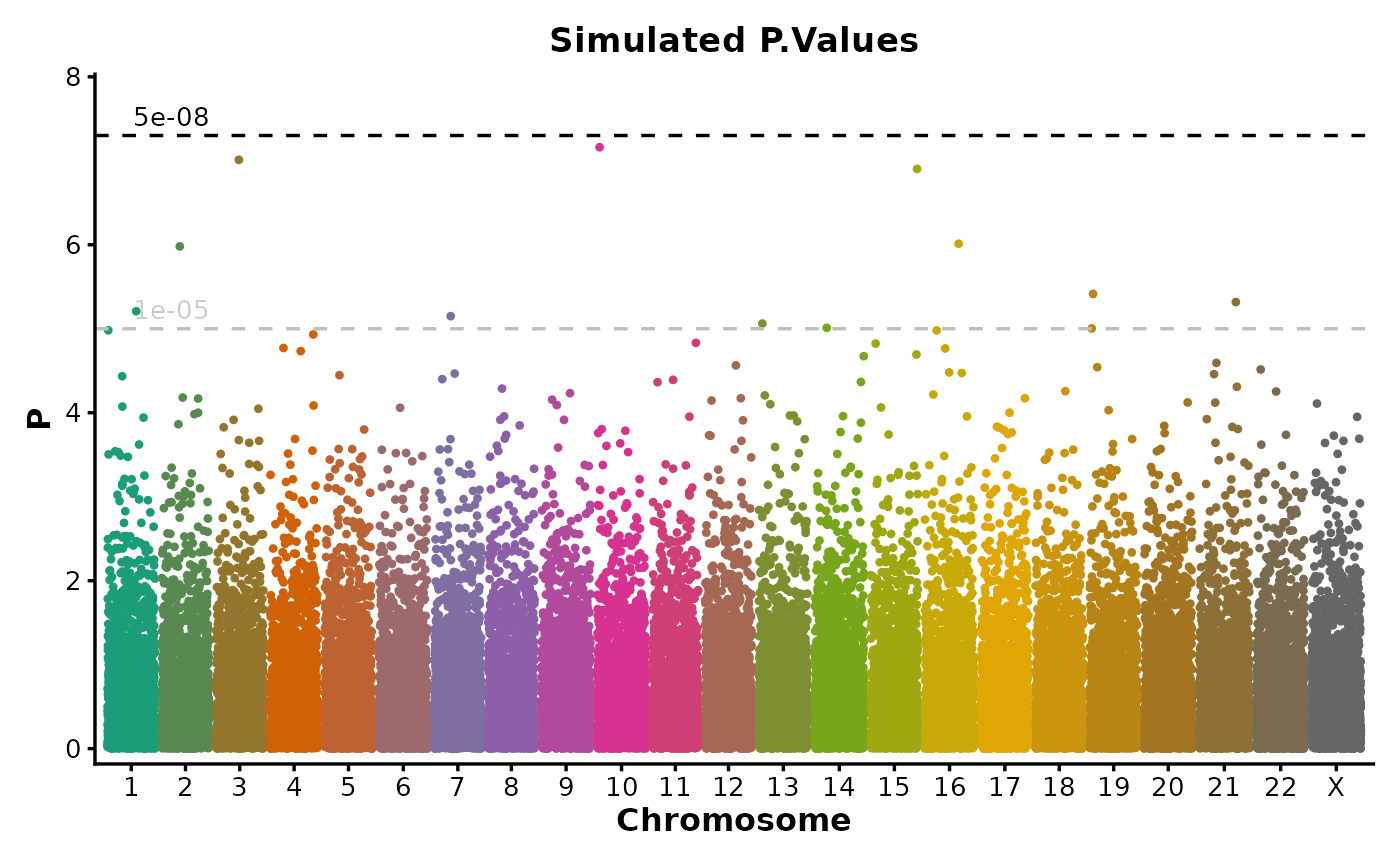
if (requireNamespace("ggmanh", quietly = TRUE)) {
ManhattanPlot(
simdata,
pval_by = "P.value", chr_by = "chromosome", pos_by = "position",
title = "Simulated P.Values", ylab = "P"
)
}
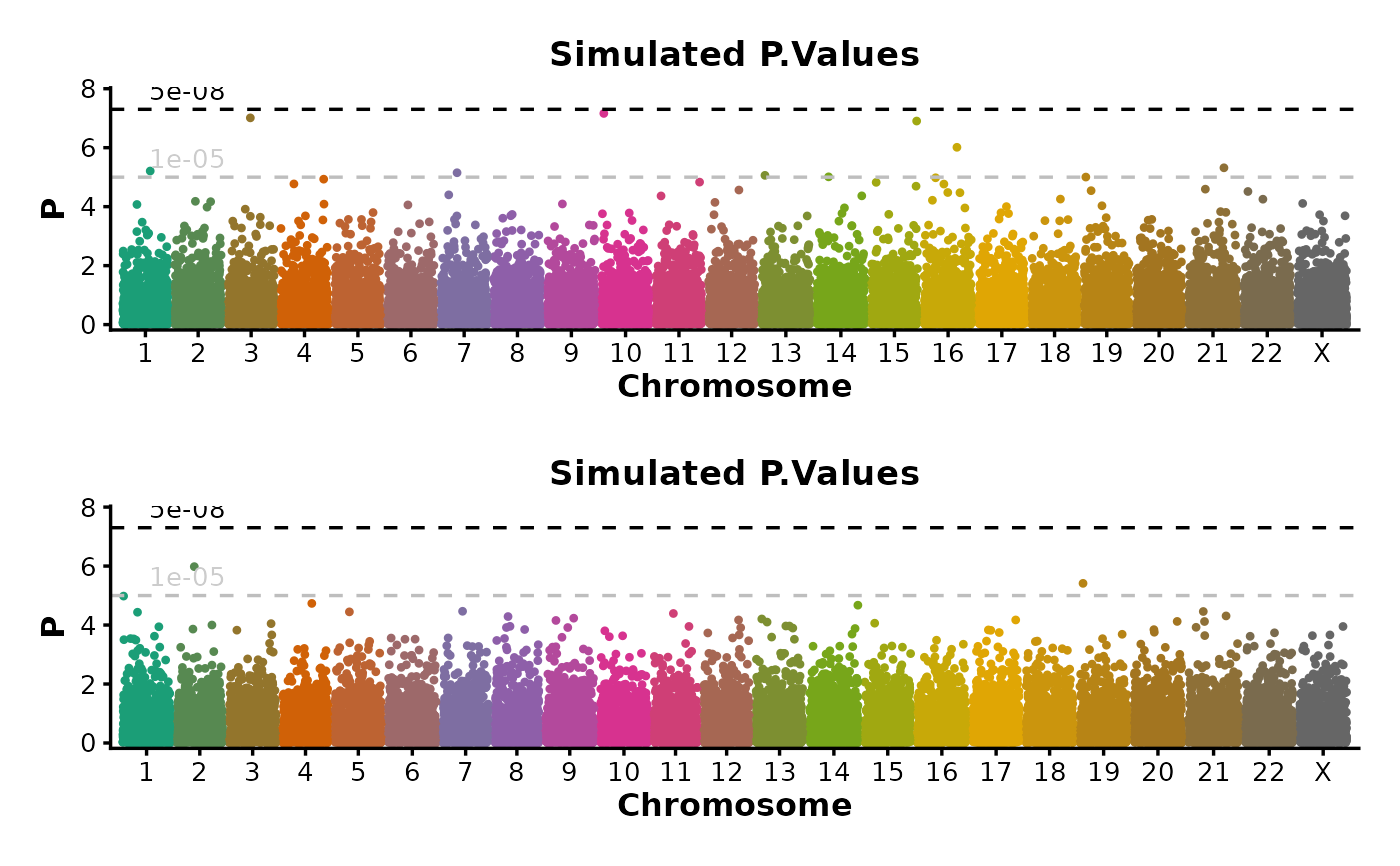
 if (requireNamespace("ggmanh", quietly = TRUE)) {
# split_by
ManhattanPlot(
simdata,
pval_by = "P.value", chr_by = "chromosome", pos_by = "position",
title = "Simulated P.Values", ylab = "P", split_by = "cohort", ncol = 1
)
}
if (requireNamespace("ggmanh", quietly = TRUE)) {
# split_by
ManhattanPlot(
simdata,
pval_by = "P.value", chr_by = "chromosome", pos_by = "position",
title = "Simulated P.Values", ylab = "P", split_by = "cohort", ncol = 1
)
}
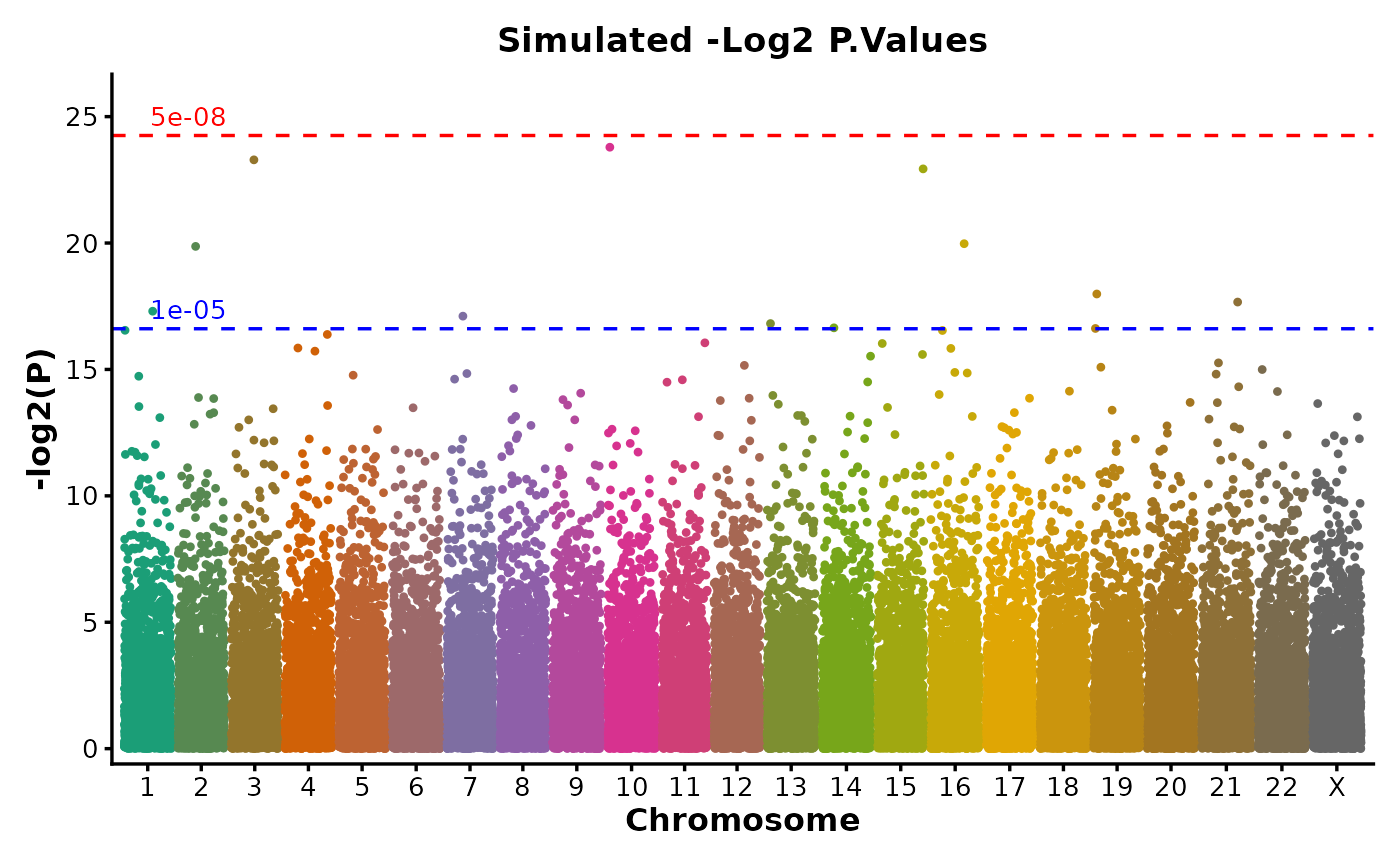
 if (requireNamespace("ggmanh", quietly = TRUE)) {
# Customized p-value transformation and significance threshold line colors
ManhattanPlot(
simdata,
pval_by = "P.value", chr_by = "chromosome", pos_by = "position",
title = "Simulated -Log2 P.Values", ylab = "-log2(P)", pval_transform = "-log2",
signif_color = c("red", "blue")
)
}
if (requireNamespace("ggmanh", quietly = TRUE)) {
# Customized p-value transformation and significance threshold line colors
ManhattanPlot(
simdata,
pval_by = "P.value", chr_by = "chromosome", pos_by = "position",
title = "Simulated -Log2 P.Values", ylab = "-log2(P)", pval_transform = "-log2",
signif_color = c("red", "blue")
)
}
 # }
# }