Overview
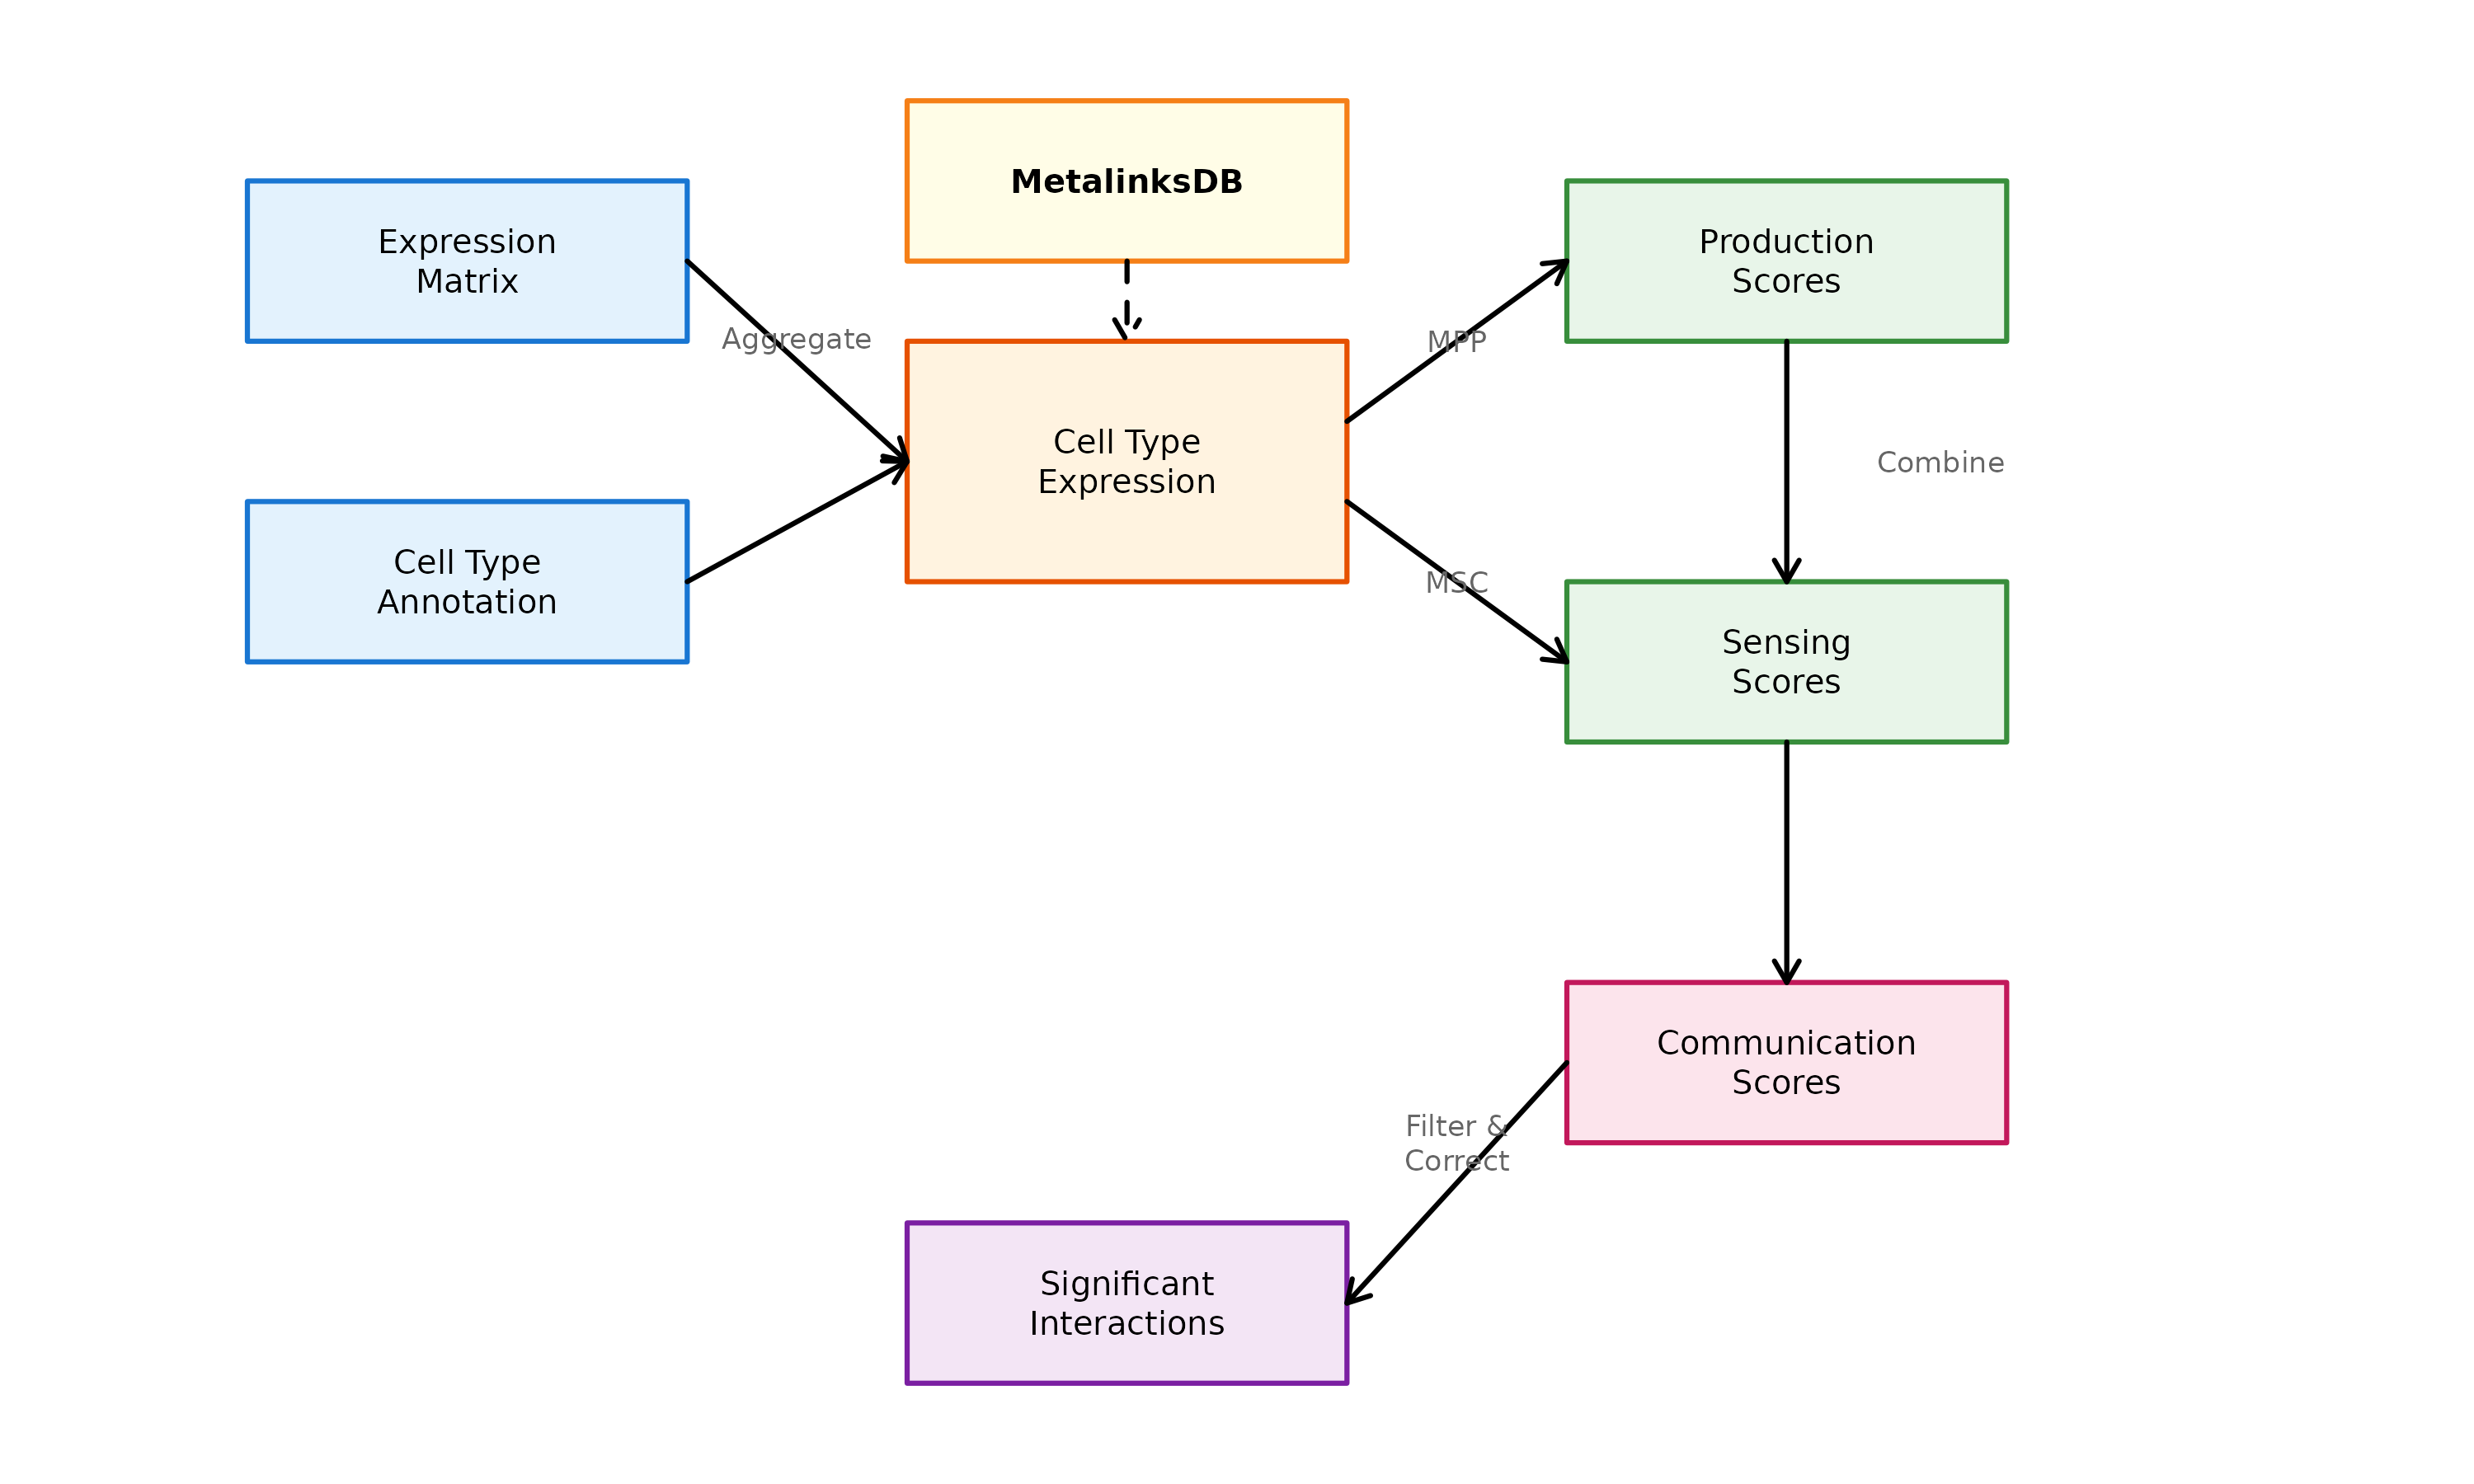
scMetaLink models metabolite-mediated cell communication as a two-step process:
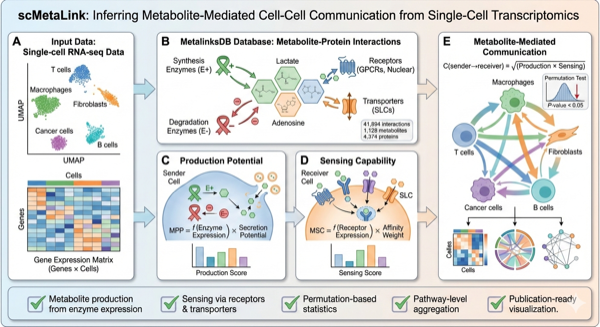
Figure 1: scMetaLink Workflow. Schematic overview of the analysis pipeline for inferring metabolite-mediated cell-cell communication.
The MetalinksDB Knowledge Base
scMetaLink uses MetalinksDB, a comprehensive database of metabolite-protein interactions.
library(scMetaLink)

# Load and explore the database
db <- scMetaLink:::.load_metalinksdb()

cat("=== MetalinksDB Statistics ===\n")
#> === MetalinksDB Statistics ===
cat("Metabolites:", nrow(db$metabolites), "\n")
#> Metabolites: 1128
cat("Proteins:", nrow(db$proteins), "\n")
#> Proteins: 4374
cat("Interactions:", nrow(db$edges), "\n")
#> Interactions: 41894
cat("Pathways:", length(unique(db$pathway$pathway)), "\n")
#> Pathways: 36806
Interaction Types
# Two main interaction types
cat("=== Interaction Types ===\n")
#> === Interaction Types ===
print(table(db$edges$type))
#>
#>    lr    pd
#> 11869 30025

cat("\n- lr (ligand-receptor): Direct metabolite-receptor binding\n")
#>
#> - lr (ligand-receptor): Direct metabolite-receptor binding
cat("- pd (produce-degrade): Enzymatic production/degradation\n")
#> - pd (produce-degrade): Enzymatic production/degradation
Mode of Regulation (MOR)
For pd type interactions, MOR indicates the
direction:
pd_edges <- db$edges[db$edges$type == "pd", ]
cat("=== Mode of Regulation for pd interactions ===\n")
#> === Mode of Regulation for pd interactions ===
print(table(pd_edges$mor))
#>
#>    -1     1
#> 13144 16881

cat("\n- mor = 1: Enzyme produces/secretes the metabolite\n")
#>
#> - mor = 1: Enzyme produces/secretes the metabolite
cat("- mor = -1: Enzyme degrades/consumes the metabolite\n")
#> - mor = -1: Enzyme degrades/consumes the metabolite
cat("- mor = 0: Enzyme binds without direction change\n")
#> - mor = 0: Enzyme binds without direction change
Protein Types
cat("=== Protein Classifications ===\n")
#> === Protein Classifications ===
print(table(db$proteins$protein_type, useNA = "ifany"))
#>
#> catalytic_receptor             enzyme               gpcr               lgic
#>                179                918                306                 71
#>                nhr           other_ic      other_protein        transporter
#>                 43                 39                 28                393
#>               vgic               <NA>
#>                 73               2324

cat("\n")
cat("Receptors: gpcr, lgic, nhr, vgic, catalytic_receptor, other_ic\n")
#> Receptors: gpcr, lgic, nhr, vgic, catalytic_receptor, other_ic
cat("Enzymes: enzyme (or NA in protein_type)\n")
#> Enzymes: enzyme (or NA in protein_type)
cat("Transporters: transporter\n")
#> Transporters: transporter
Mathematical Framework
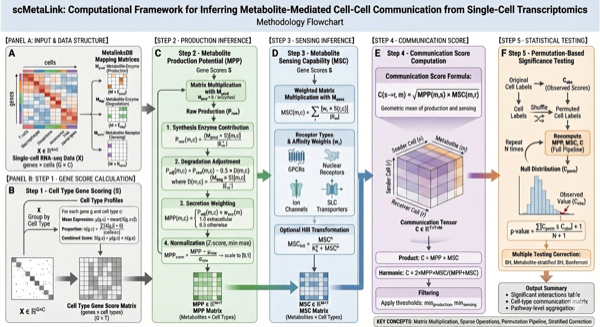
Figure 2: Computational Algorithm. Schematic illustration of the mathematical framework for computing metabolite production, sensing, and communication scores.
1. Metabolite Production Potential (MPP)
The production potential for metabolite in cell type is:
Where: - : Set of enzymes that produce metabolite - : Set of enzymes that degrade metabolite - : Degradation weight factor - : Gene expression score for gene in cell type
Gene Expression Scoring
Three methods are available:
| Method | Formula | Use Case |
|---|---|---|
mean |
Simple average expression | |
proportion |
Proportion of expressing cells | |
combined |
Balanced (recommended) |
| Method | Formula | Value |
|---|---|---|
| mean | mean(expr) | 0.610 |
| proportion | mean(expr > 0) | 0.300 |
| combined | mean x proportion | 0.183 |
Trimean Option
For single-cell data with high dropout, trimean provides a robust alternative:
# Example: Trimean vs Arithmetic Mean
expr_with_outlier <- c(0, 0, 0, 1, 2, 3, 100) # Outlier = 100

cat("Data:", paste(expr_with_outlier, collapse = ", "), "\n")
#> Data: 0, 0, 0, 1, 2, 3, 100
cat("Arithmetic mean:", round(mean(expr_with_outlier), 2), "\n")
#> Arithmetic mean: 15.14
cat("Median:", median(expr_with_outlier), "\n")
#> Median: 1

# Trimean calculation
q <- quantile(expr_with_outlier, c(0.25, 0.5, 0.75))
trimean <- (q[1] + 2 * q[2] + q[3]) / 4
cat("Trimean:", round(trimean, 2), "\n")
#> Trimean: 1.12
cat("\nTrimean is robust to the outlier!\n")
#>
#> Trimean is robust to the outlier!
2. Metabolite Sensing Capability (MSC)
The sensing capability for metabolite in cell type is:
Where: - : Set of receptors/transporters for metabolite - : Affinity weight based on interaction confidence score
Hill Function (Optional)
To model receptor saturation kinetics, an optional Hill transformation can be applied:
Where: - : Expression level (normalized) - : Hill coefficient (cooperativity) - : Half-maximal threshold
# Hill function visualization
x <- seq(0, 1, 0.01)
hill <- function(x, n, Kh) x^n / (Kh^n + x^n)

plot(x, x,
  type = "l", lty = 2, col = "gray",
  xlab = "Expression (normalized)", ylab = "Response",
  main = "Hill Function Transformation"
)
lines(x, hill(x, n = 1, Kh = 0.5), col = "blue", lwd = 2)
lines(x, hill(x, n = 2, Kh = 0.5), col = "red", lwd = 2)
lines(x, hill(x, n = 0.5, Kh = 0.5), col = "green", lwd = 2)
legend("bottomright",
  legend = c("Linear", "n=1 (Michaelis-Menten)", "n=2 (Cooperative)", "n=0.5"),
  col = c("gray", "blue", "red", "green"),
  lty = c(2, 1, 1, 1), lwd = 2
)
abline(h = 0.5, v = 0.5, lty = 3, col = "gray")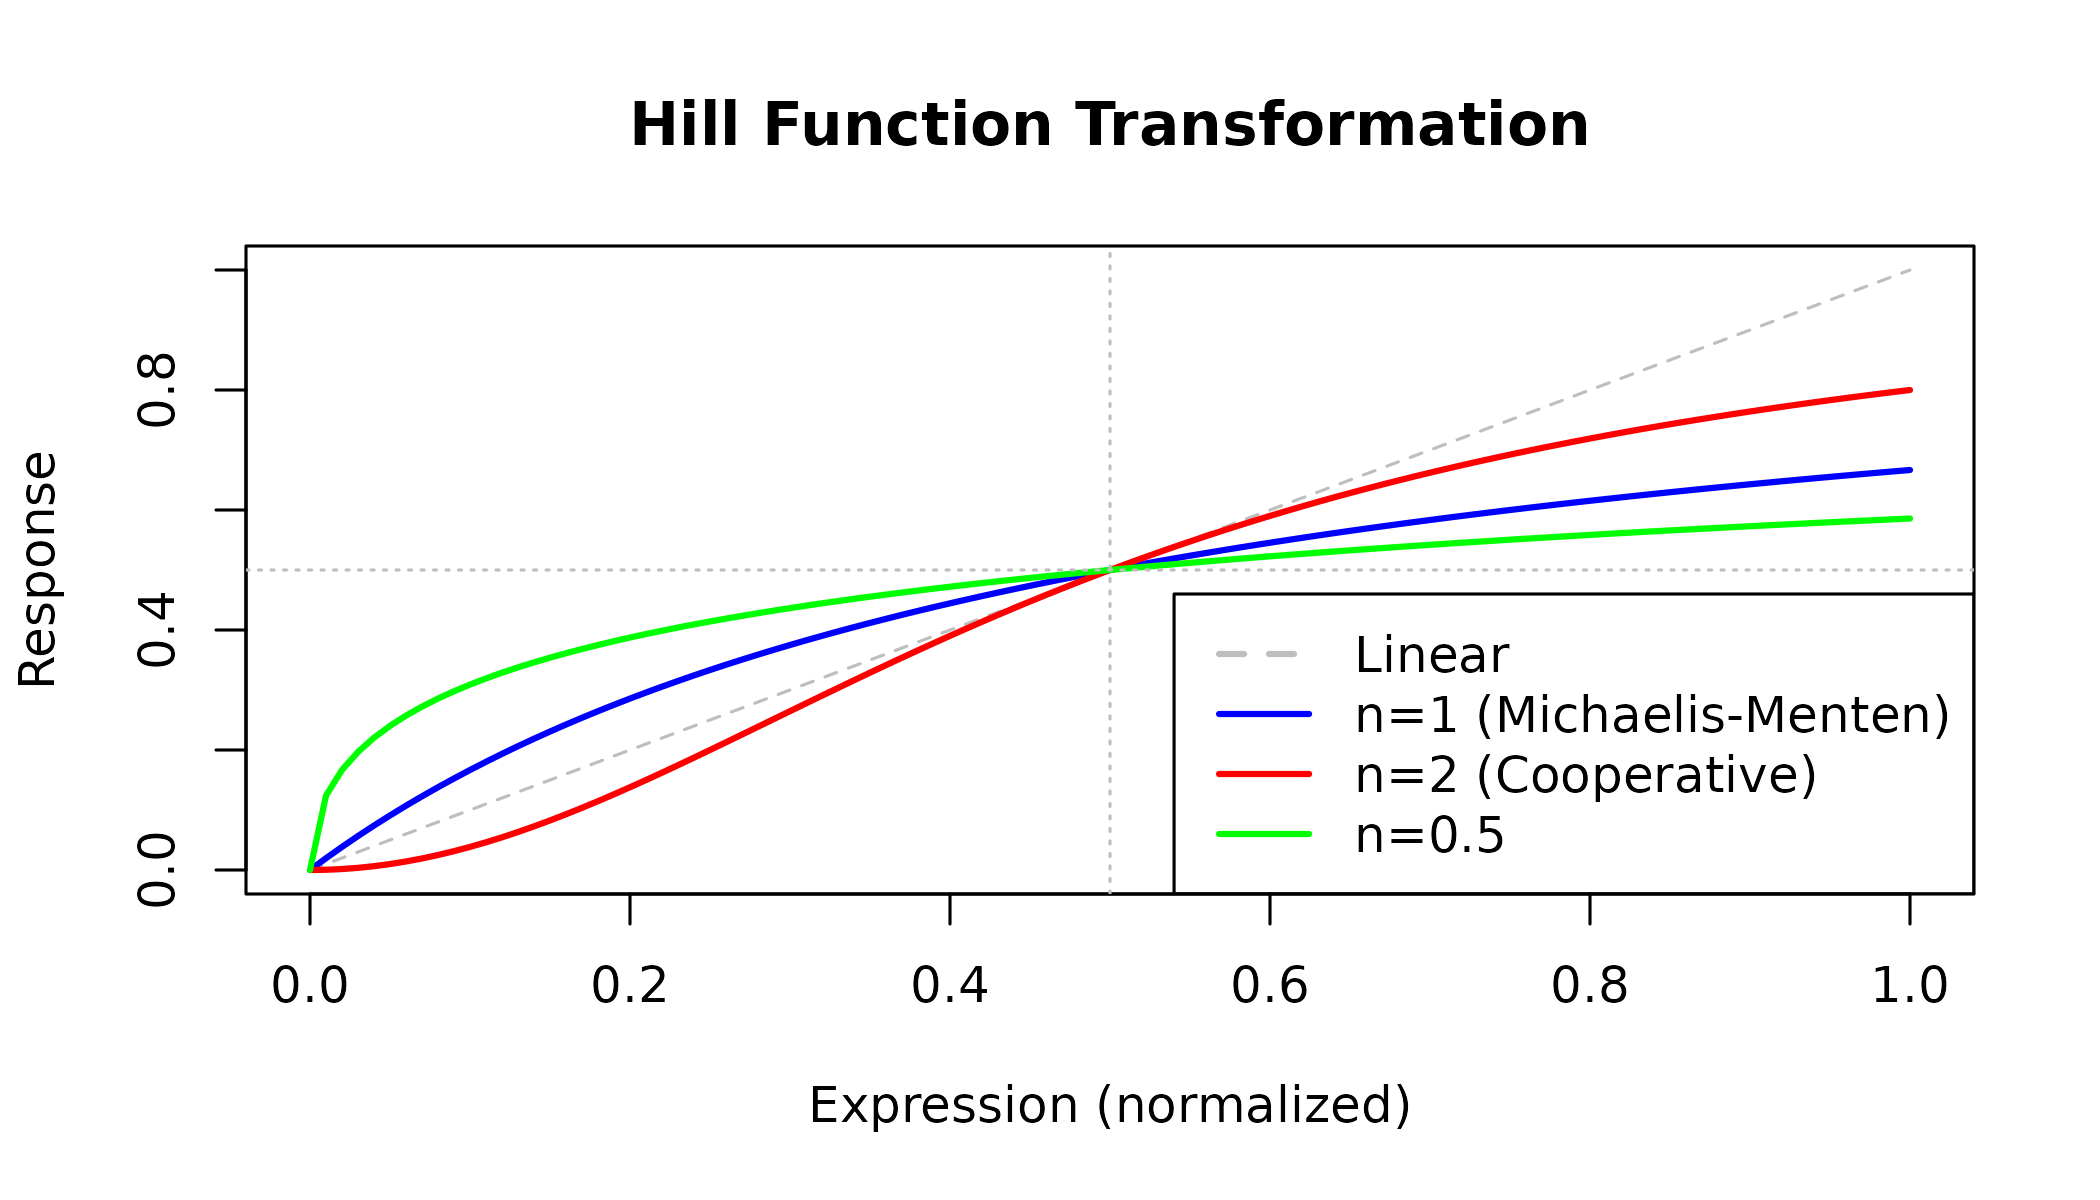
Figure 1: Hill Function Transformation. Different Hill coefficients (n) produce different response curves. n=1 gives standard Michaelis-Menten kinetics. n>1 indicates positive cooperativity (steeper curve). The half-maximal response occurs at x=Kh.
3. Communication Score
The communication score from sender to receiver via metabolite :
Three aggregation methods are available:
| Method | Formula | Properties |
|---|---|---|
geometric |
Balanced, penalizes imbalance | |
product |
Emphasizes strong bilateral signals | |
harmonic |
Strongly penalizes imbalance |
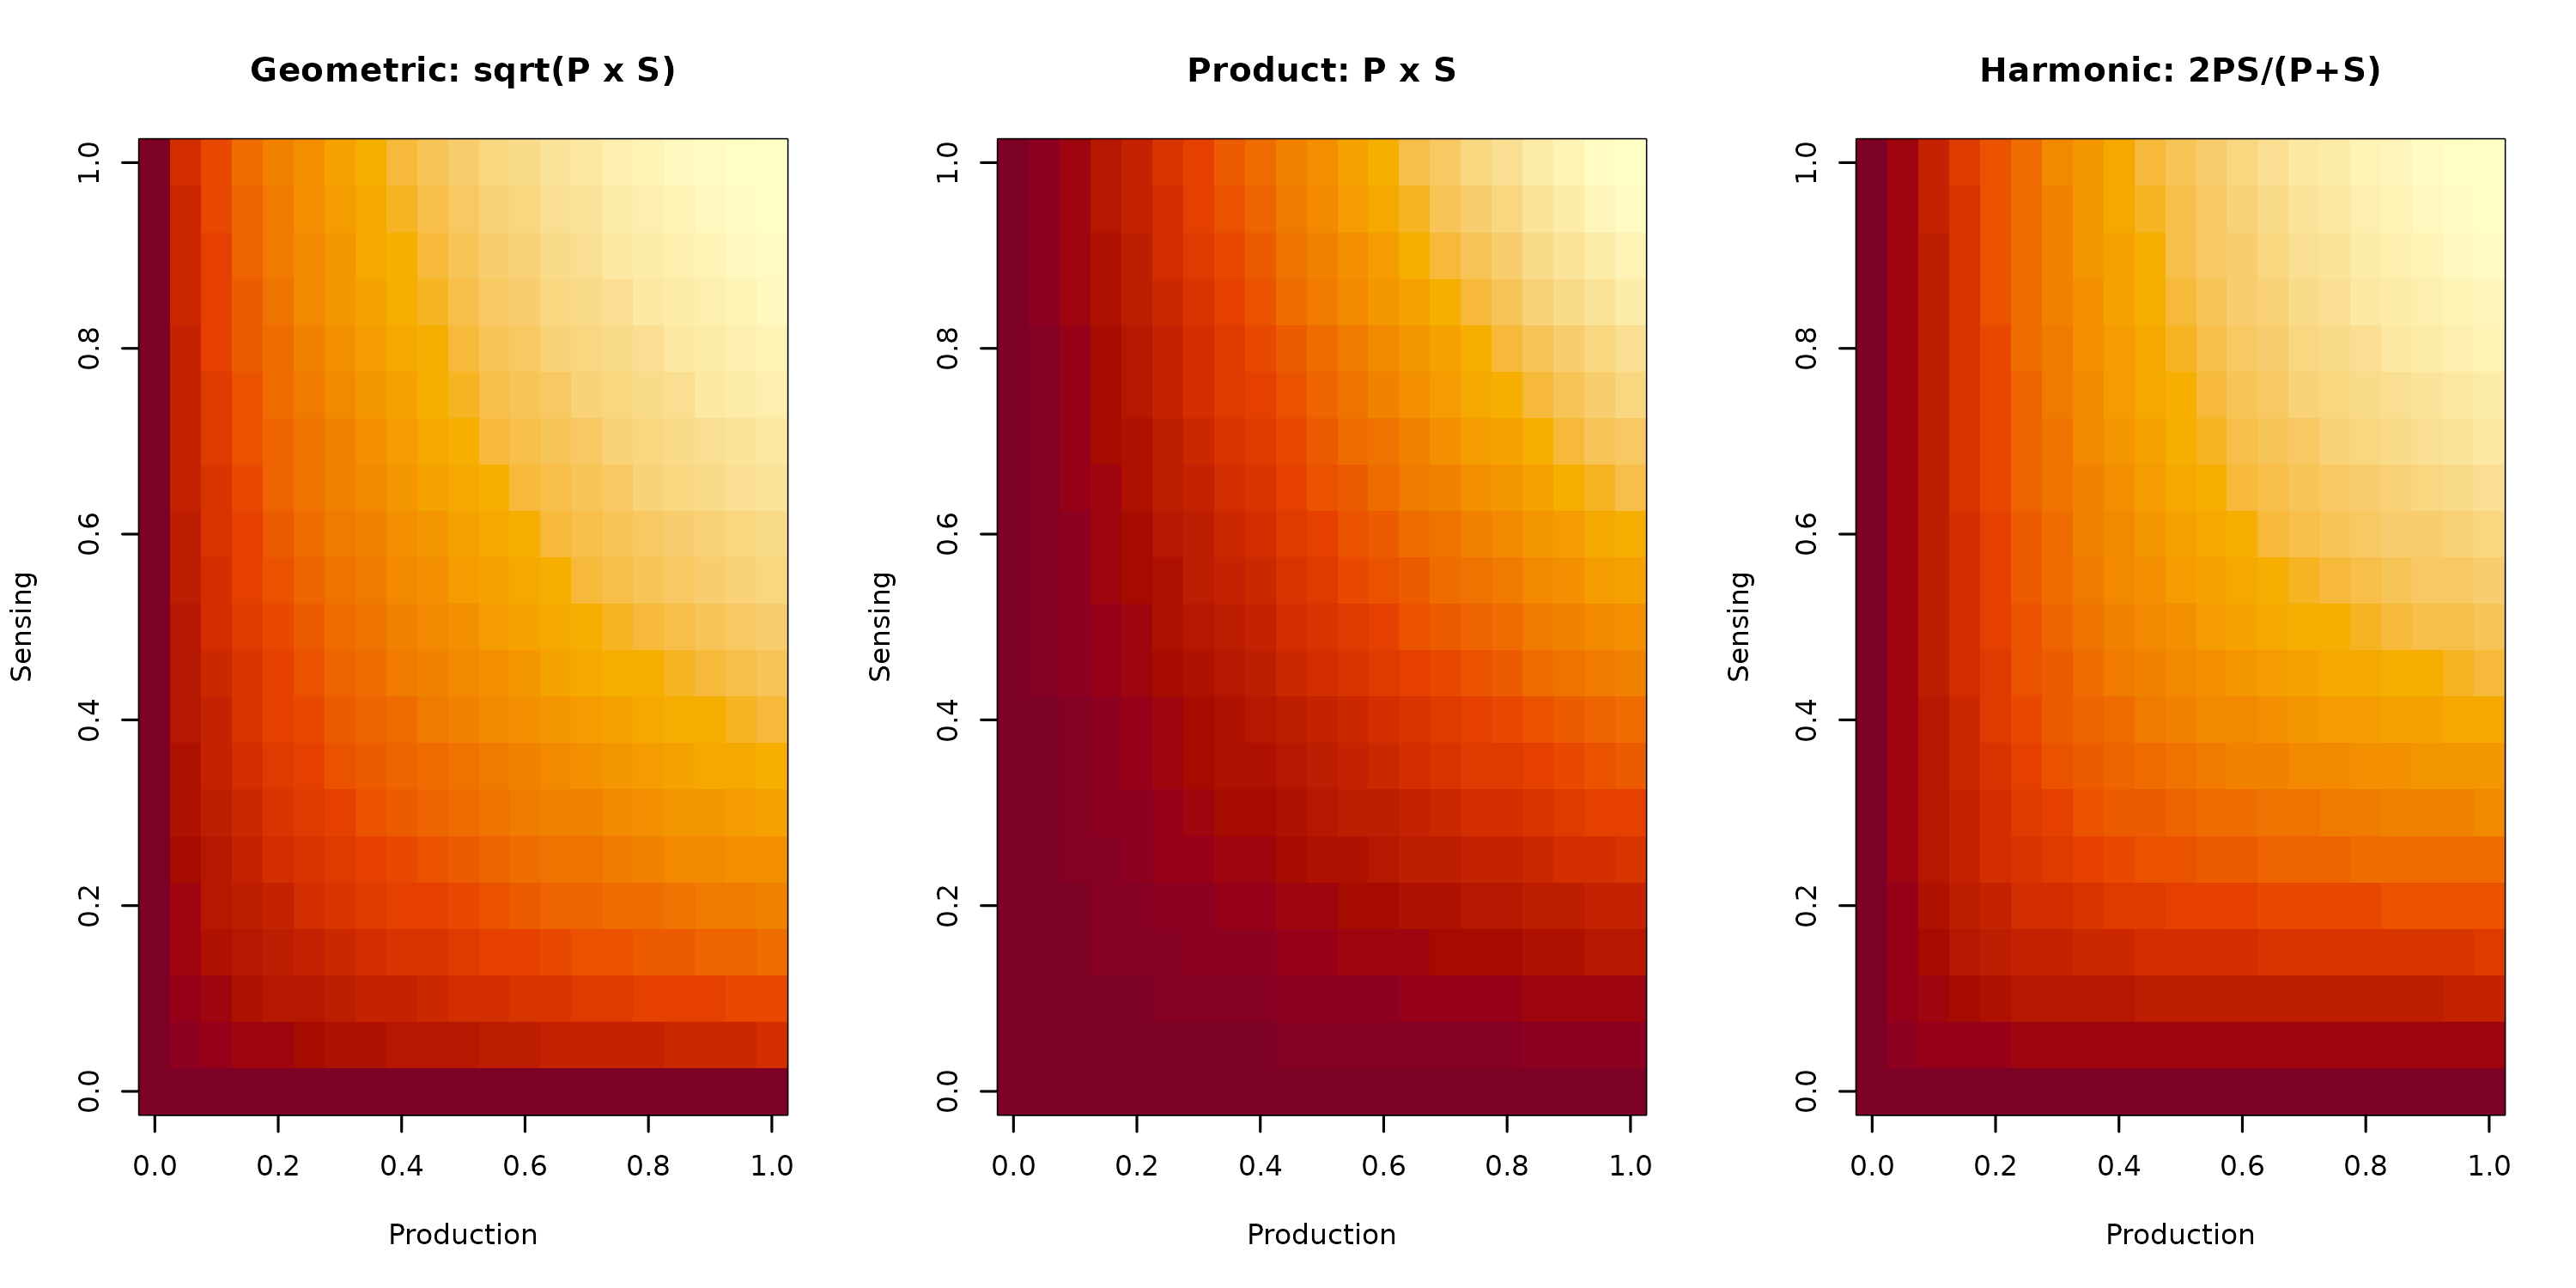
Figure 2: Communication Score Methods. Heat maps showing how different methods combine production (x-axis) and sensing (y-axis) scores. Geometric mean (left) provides balanced weighting. Product (center) emphasizes strong bilateral signals. Harmonic mean (right) penalizes imbalanced communication.
Statistical Framework
Permutation Test
To assess significance, cell type labels are randomly shuffled:
- Shuffle cell type labels times (default: 100-1000)
- Recalculate production, sensing, and communication for each permutation
- Compute empirical p-value:
Multiple Testing Correction
Three strategies for handling multiple comparisons:
| Method | Description |
|---|---|
metabolite_stratified |
BH correction within each metabolite (recommended) |
BH |
Global Benjamini-Hochberg |
bonferroni |
Global Bonferroni (very conservative) |
Why metabolite_stratified?
- Metabolites are independent biological signals
- Global correction is overly conservative
- Per-metabolite correction preserves biological interpretability
Key Assumptions
- Gene expression correlates with protein activity: Enzyme/receptor expression levels reflect functional activity
- Metabolites can diffuse between cells: Produced metabolites are available for sensing by neighboring cells
- Cell type labels are accurate: Incorrect annotations will affect results
- Adequate cell sampling: Each cell type needs sufficient cells for robust estimation
Comparison with Ligand-Receptor Methods
| Aspect | Ligand-Receptor (e.g., CellChat) | Metabolite-Mediated (scMetaLink) |
|---|---|---|
| Signal type | Proteins | Small molecules |
| Diffusion range | Short (juxtacrine/paracrine) | Variable (paracrine/endocrine) |
| Database | CellChatDB, CellPhoneDB | MetalinksDB |
| Key genes | Ligands, receptors | Enzymes, transporters, receptors |
| Signal complexity | Direct binding | Synthesis -> Secretion -> Sensing |
References
Schafer, S., et al. (2023). MetalinksDB: a knowledgebase of metabolite-centric signaling. Nature Communications.
Xiao, Z., et al. (2022). Metabolite-mediated intercellular communication in tumor microenvironment. Frontiers in Cell and Developmental Biology.
Next
- Production & Sensing Analysis: Detailed parameter tuning
- Communication Analysis: Advanced communication analysis
- Spatial Analysis: Spatial transcriptomics support