Spot metadata for the colon Visium example dataset
st_metaFormat
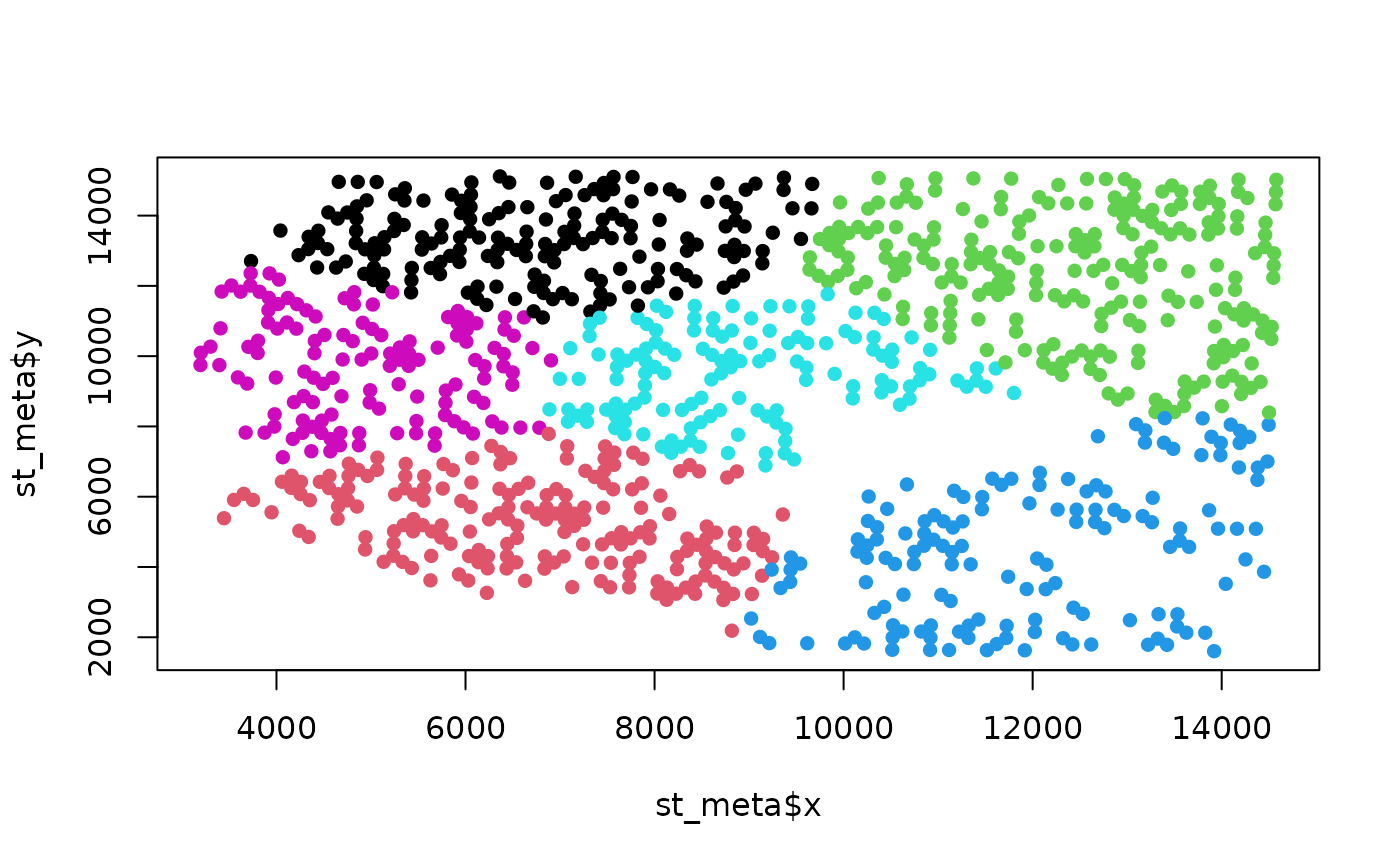
A data.frame with 1,000 rows (spots) and 5 columns:
- x
X coordinate in image pixels (imagecol)
- y
Y coordinate in image pixels (imagerow)
- array_row
Row position in the Visium array
- array_col
Column position in the Visium array
- cell_type
Cell type annotation (mock clusters for testing)
Details
The cell_type column contains mock cell type annotations generated by spatial k-means clustering. In real analysis, users should provide cell type annotations from deconvolution methods (e.g., RCTD, cell2location, SPOTlight) or manual annotation.
Cell type distribution in this example:
Epithelial: ~189 spots
Fibroblast: ~232 spots
Endothelial: ~174 spots
Immune: ~145 spots
Stromal: ~133 spots
Tumor: ~127 spots