Overview
scPAS is a computational framework for identifying phenotype-associated cell subpopulations from single-cell RNA sequencing (scRNA-seq) data through the integration of bulk transcriptomic profiles and clinical phenotypes. The methodology employs network-regularized sparse regression to quantify the strength of association between individual cells and phenotypic outcomes, enabling both quantitative scoring and statistical inference at single-cell resolution.
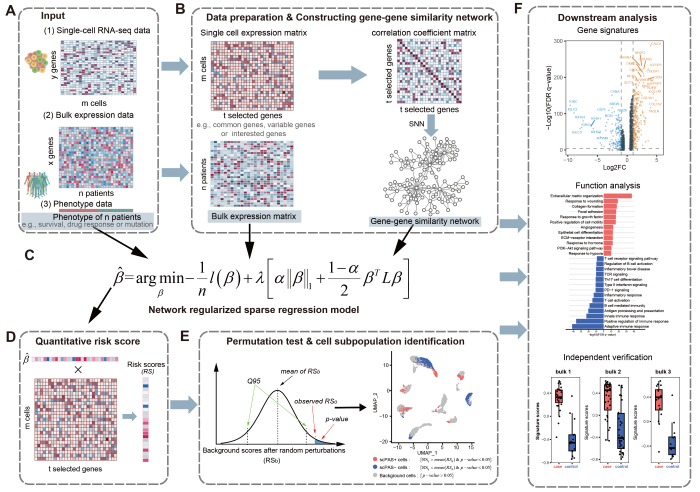
Methodological Framework
Statistical Model
scPAS implements the Augmented and Penalized Minimization with L0 (APML0) algorithm, which combines:
- L1 regularization (LASSO) for sparsity
- Laplacian regularization for incorporating gene network structure
- Cross-validation for optimal parameter selection
Supported Regression Families
| Family | Phenotype Type | Application |
|---|---|---|
| Gaussian | Continuous | Age, BMI, gene expression levels |
| Binomial | Binary | Case-control, treatment response |
| Cox | Time-to-event | Overall survival, progression-free survival |
Statistical Inference
Significance is assessed through permutation testing with FDR correction (Benjamini-Hochberg). Cells are classified as:
- scPAS+: Positively associated (risk score > 0, FDR < threshold)
-
scPAS-: Negatively associated (risk score < 0, FDR < threshold)
- Non-significant: FDR >= threshold
Installation
From R-universe (Recommended)
install.packages("scPAS", repos = c(
  "https://zaoqu-liu.r-universe.dev",
  "https://cloud.r-project.org"
))
From GitHub
if (!require("devtools")) install.packages("devtools")
devtools::install_github("Zaoqu-Liu/scPAS")
Dependencies
# Bioconductor dependency
if (!require("BiocManager")) install.packages("BiocManager")
BiocManager::install("preprocessCore")

# Optional: parallel computing
install.packages(c("future", "future.apply"))
Documentation
Comprehensive documentation: https://zaoqu-liu.github.io/scPAS/
| Vignette | Description |
|---|---|
| Quick Start | Basic usage and workflow |
| Algorithm | Mathematical methodology |
| Visualization | Publication-quality figures |
| Survival Analysis | Cox regression application |
| Binary Classification | Treatment response prediction |
Quick Start
library(scPAS)
library(Seurat)

# Run scPAS analysis
result <- scPAS(
  bulk_dataset = bulk_expression,
  sc_dataset = seurat_object,
  phenotype = phenotype_vector,
  family = "gaussian",
  nfeature = 3000,
  permutation_times = 1000,
  n_cores = 4
)

# Extract significant cells
significant_cells <- subset(result, subset = scPAS_FDR < 0.05)
table(significant_cells$scPAS)
Output Structure
| Column | Description |
|---|---|
scPAS_RS |
Raw risk score |
scPAS_NRS |
Normalized risk score (Z-statistic) |
scPAS_Pvalue |
Permutation-based p-value |
scPAS_FDR |
Benjamini-Hochberg adjusted p-value |
scPAS |
Cell classification (scPAS+/scPAS-/0) |
Key Features
- Multi-modal Integration: Bridges bulk and single-cell transcriptomics
- Network Regularization: Incorporates gene-gene co-expression structure
- Flexible Phenotypes: Supports continuous, binary, and survival outcomes
- Scalable Computation: Parallel processing for large-scale datasets
- Seurat Integration: Native support for Seurat v4 objects
Citation
If you use scPAS in your research, please cite:
Xie A, Wang H, Zhao J, Wang Z, Xu J, Xu Y. scPAS: single-cell phenotype-associated subpopulation identifier. Briefings in Bioinformatics. 2024;26(1):bbae655. DOI: 10.1093/bib/bbae655
Authors
- Aimin Xie - Original algorithm development
- Zaoqu Liu - Package maintenance (liuzaoqu@163.com)
License
GPL-3.0 | GNU General Public License v3.0