Building Custom References
Zaoqu Liu
2026-01-26
Source:vignettes/custom-reference.Rmd
custom-reference.RmdIntroduction
While CellProgramMapper provides pre-built references for common cell types, you may want to create custom references for:
- Novel cell types or tissues
- Specific biological contexts
- Combining multiple datasets
- Custom gene expression programs
This vignette covers the process of building and using custom references.
Reference Format
A reference consists of a spectra matrix where:
- Rows: Gene expression programs (GEPs)
- Columns: Genes
- Values: Non-negative weights representing gene contributions
Method 1: From cNMF Results
Running cNMF
First, run cNMF (consensus Non-negative Matrix Factorization) on your reference data using Python:
# In Python
from cnmf import cNMF
import scanpy as sc

# Load data
adata = sc.read_h5ad("reference_data.h5ad")

# Initialize cNMF
cnmf_obj = cNMF(output_dir='./cnmf_output', name='my_reference')

# Prepare data
cnmf_obj.prepare(counts_fn=adata, components=np.arange(5, 25),
                 n_iter=200, seed=42)

# Run factorization
cnmf_obj.factorize(worker_i=0, total_workers=1)

# Compute consensus
cnmf_obj.consensus(k=15, density_threshold=0.1)
Loading cNMF Results
library(CellProgramMapper)

# Load from cNMF output directory
spectra <- load_cnmf_spectra(
  cnmf_dir = "./cnmf_output",
  cnmf_name = "my_reference",
  k = 15  # Number of programs
)

# Use as reference
result <- CellProgramMapper(
  query = seurat_obj,
  reference = spectra
)
Method 2: Building Consensus Reference
When you have cNMF results from multiple datasets, use
BuildConsensusReference to create a unified reference:
# Initialize builder
builder <- BuildConsensusReference(
  output_dir = "./consensus_output",
  name = "my_consensus_reference"
)

# Add cNMF results from multiple datasets
builder$add_cnmf_result(
  cnmf_dir = "./dataset1/cnmf_output",
  cnmf_name = "dataset1",
  k = 15
)

builder$add_cnmf_result(
  cnmf_dir = "./dataset2/cnmf_output",
  cnmf_name = "dataset2",
  k = 12
)

# Compute correlations between all GEPs
builder$compute_gep_correlations()

# Cluster GEPs into consensus programs
builder$cluster_geps(
  correlation_threshold = 0.5,
  min_cluster_size = 2
)

# Get final consensus spectra
consensus_spectra <- builder$get_consensus_spectra()
Method 3: Manual Construction
From Known Gene Signatures
library(CellProgramMapper)
#> CellProgramMapper v1.0.0
#> Map single cells to reference gene expression programs
#> GitHub: https://github.com/Zaoqu-Liu/CellProgramMapper

# Define gene signatures
signatures <- list(
  Exhaustion = c("PDCD1", "LAG3", "HAVCR2", "TIGIT", "CTLA4"),
  Cytotoxicity = c("GZMA", "GZMB", "PRF1", "GNLY", "NKG7"),
  Proliferation = c("MKI67", "TOP2A", "PCNA", "CDK1", "CCNB1"),
  Memory = c("IL7R", "TCF7", "LEF1", "CCR7", "SELL")
)

# Create binary spectra
all_genes <- unique(unlist(signatures))
spectra <- matrix(0, nrow = length(signatures), ncol = length(all_genes))
rownames(spectra) <- names(signatures)
colnames(spectra) <- all_genes

for (i in seq_along(signatures)) {
  spectra[i, signatures[[i]]] <- 1
}

# View spectra
print(spectra)
#>               PDCD1 LAG3 HAVCR2 TIGIT CTLA4 GZMA GZMB PRF1 GNLY NKG7 MKI67
#> Exhaustion        1    1      1     1     1    0    0    0    0    0     0
#> Cytotoxicity      0    0      0     0     0    1    1    1    1    1     0
#> Proliferation     0    0      0     0     0    0    0    0    0    0     1
#> Memory            0    0      0     0     0    0    0    0    0    0     0
#>               TOP2A PCNA CDK1 CCNB1 IL7R TCF7 LEF1 CCR7 SELL
#> Exhaustion        0    0    0     0    0    0    0    0    0
#> Cytotoxicity      0    0    0     0    0    0    0    0    0
#> Proliferation     1    1    1     1    0    0    0    0    0
#> Memory            0    0    0     0    1    1    1    1    1
From Expression Data
# Simulate expression data for demonstration
set.seed(42)
n_cells <- 200
n_genes <- 50

# Create expression matrix
expression <- matrix(rpois(n_cells * n_genes, lambda = 5),
                    nrow = n_cells, ncol = n_genes)
colnames(expression) <- paste0("Gene", 1:n_genes)
rownames(expression) <- paste0("Cell", 1:n_cells)

# Define cell type labels
cell_types <- rep(c("TypeA", "TypeB", "TypeC", "TypeD"), each = 50)

# Compute mean expression per cell type
spectra <- do.call(rbind, lapply(unique(cell_types), function(ct) {
  cells <- which(cell_types == ct)
  colMeans(expression[cells, ])
}))
rownames(spectra) <- unique(cell_types)

# Ensure non-negativity
spectra[spectra < 0] <- 0

print(dim(spectra))
#> [1]  4 50
Validating Custom References
Quality Checks
validate_reference <- function(spectra) {
  checks <- list()

  # Check 1: Non-negativity
  checks$non_negative <- all(spectra >= 0)


  # Check 2: No all-zero programs
  checks$no_zero_programs <- all(rowSums(spectra) > 0)

  # Check 3: No all-zero genes
  checks$no_zero_genes <- all(colSums(spectra) > 0)

  # Check 4: Reasonable number of programs
  checks$reasonable_k <- nrow(spectra) >= 2 && nrow(spectra) <= 100

  # Check 5: Sufficient genes
  checks$sufficient_genes <- ncol(spectra) >= 100

  # Report
  cat("Reference validation:\n")
  for (check_name in names(checks)) {
    status <- if (checks[[check_name]]) "PASS" else "FAIL"
    cat(sprintf("  %s: %s\n", check_name, status))
  }

  return(all(unlist(checks)))
}

# Note: Our demo spectra has fewer genes than recommended
# validate_reference(spectra)
Visualize Reference
# Heatmap of spectra
if (!requireNamespace("pheatmap", quietly = TRUE)) {
  install.packages("pheatmap")
}

# For demonstration, use the signature-based spectra
library(pheatmap)
#> Warning: package 'pheatmap' was built under R version 4.4.1

pheatmap(
  spectra,
  cluster_rows = TRUE,
  cluster_cols = TRUE,
  show_colnames = TRUE,
  main = "Custom Reference Spectra",
  color = colorRampPalette(c("white", "#08306b"))(100)
)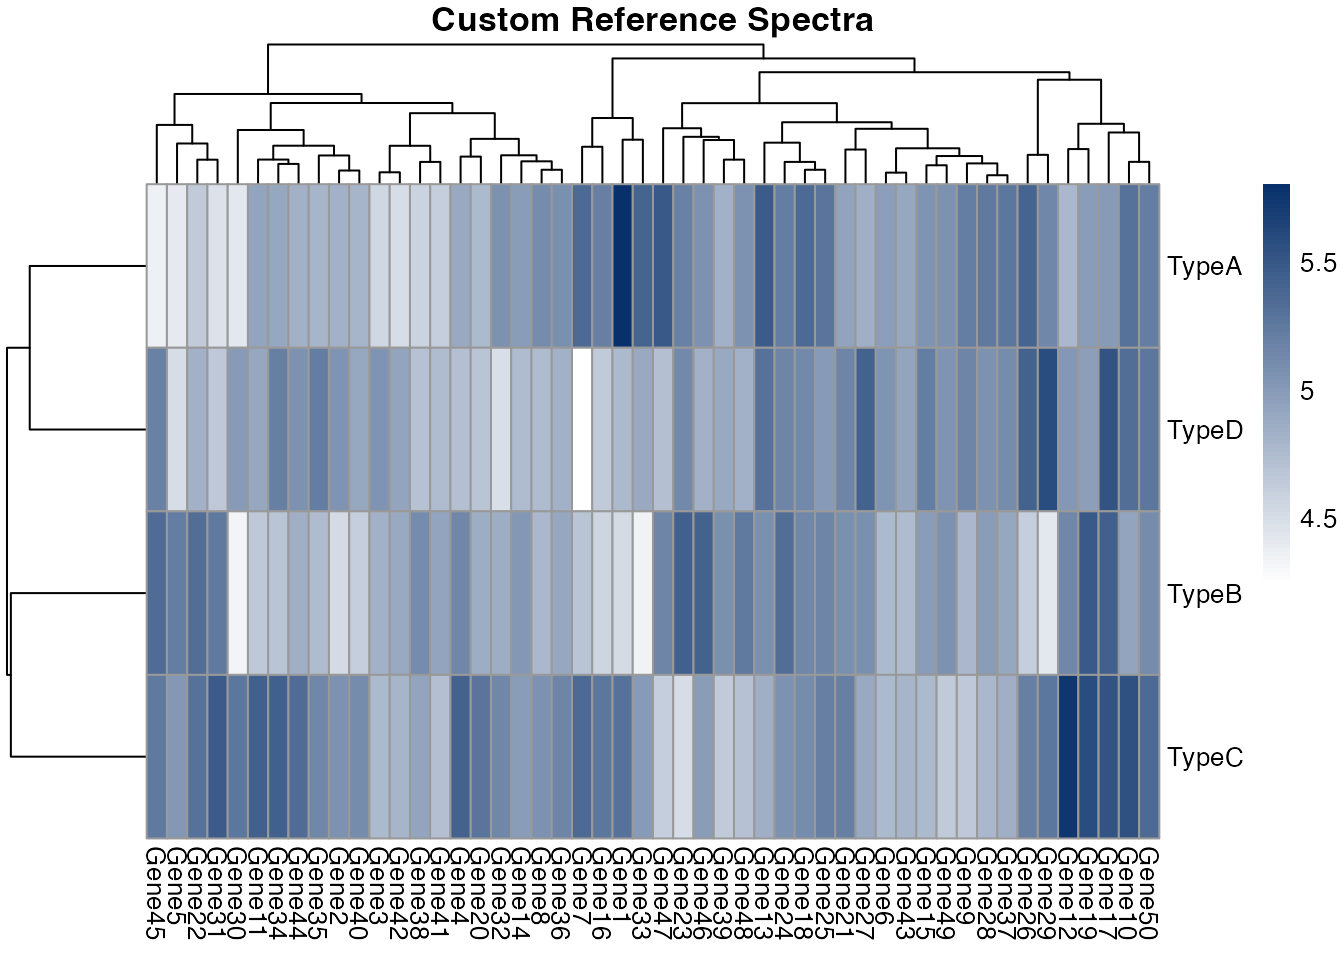
Visualization of reference spectra
Saving References
As TSV File
# Save spectra matrix
write.table(spectra, file = "my_reference.tsv",
            sep = "\t", quote = FALSE, row.names = TRUE)
With Metadata
# Save with additional information
reference_data <- list(
  spectra = spectra,
  metadata = list(
    name = "My Custom Reference",
    version = "1.0",
    description = "Reference for XYZ cell types",
    species = "Homo sapiens",
    source_datasets = c("Dataset1", "Dataset2"),
    date_created = Sys.Date()
  )
)

saveRDS(reference_data, "my_reference.rds")
Using Custom References
# Method 1: From file path
result <- CellProgramMapper(
  query = seurat_obj,
  reference = "path/to/my_reference.tsv"
)

# Method 2: From matrix object
result <- CellProgramMapper(
  query = seurat_obj,
  reference = spectra  # Your spectra matrix
)

# Method 3: From RDS file
ref_data <- readRDS("my_reference.rds")
result <- CellProgramMapper(
  query = seurat_obj,
  reference = ref_data$spectra
)
Best Practices
Reference Construction
- Use diverse data: Include cells from multiple donors/conditions
- Quality control: Remove low-quality cells before NMF
- Appropriate k: Choose number of programs based on biological complexity
- Gene selection: Use highly variable genes (1000-5000)
Gene Overlap
# Simulate query genes
query_genes <- c(paste0("Gene", 1:40), paste0("OtherGene", 1:20))
ref_genes <- colnames(spectra)

# Compute overlap
overlap <- intersect(query_genes, ref_genes)
query_only <- setdiff(query_genes, ref_genes)
ref_only <- setdiff(ref_genes, query_genes)

cat(sprintf("Query genes: %d\n", length(query_genes)))
#> Query genes: 60
cat(sprintf("Reference genes: %d\n", length(ref_genes)))
#> Reference genes: 50
cat(sprintf("Overlap: %d (%.1f%%)\n", length(overlap),
            100 * length(overlap) / length(ref_genes)))
#> Overlap: 40 (80.0%)

# Visualize
par(mar = c(2, 2, 2, 2))
venn_counts <- c(
  "Query only" = length(query_only),
  "Reference only" = length(ref_only),
  "Overlap" = length(overlap)
)
barplot(venn_counts, col = c("#e41a1c", "#377eb8", "#4daf4a"),
        main = "Gene Overlap", ylab = "Number of genes")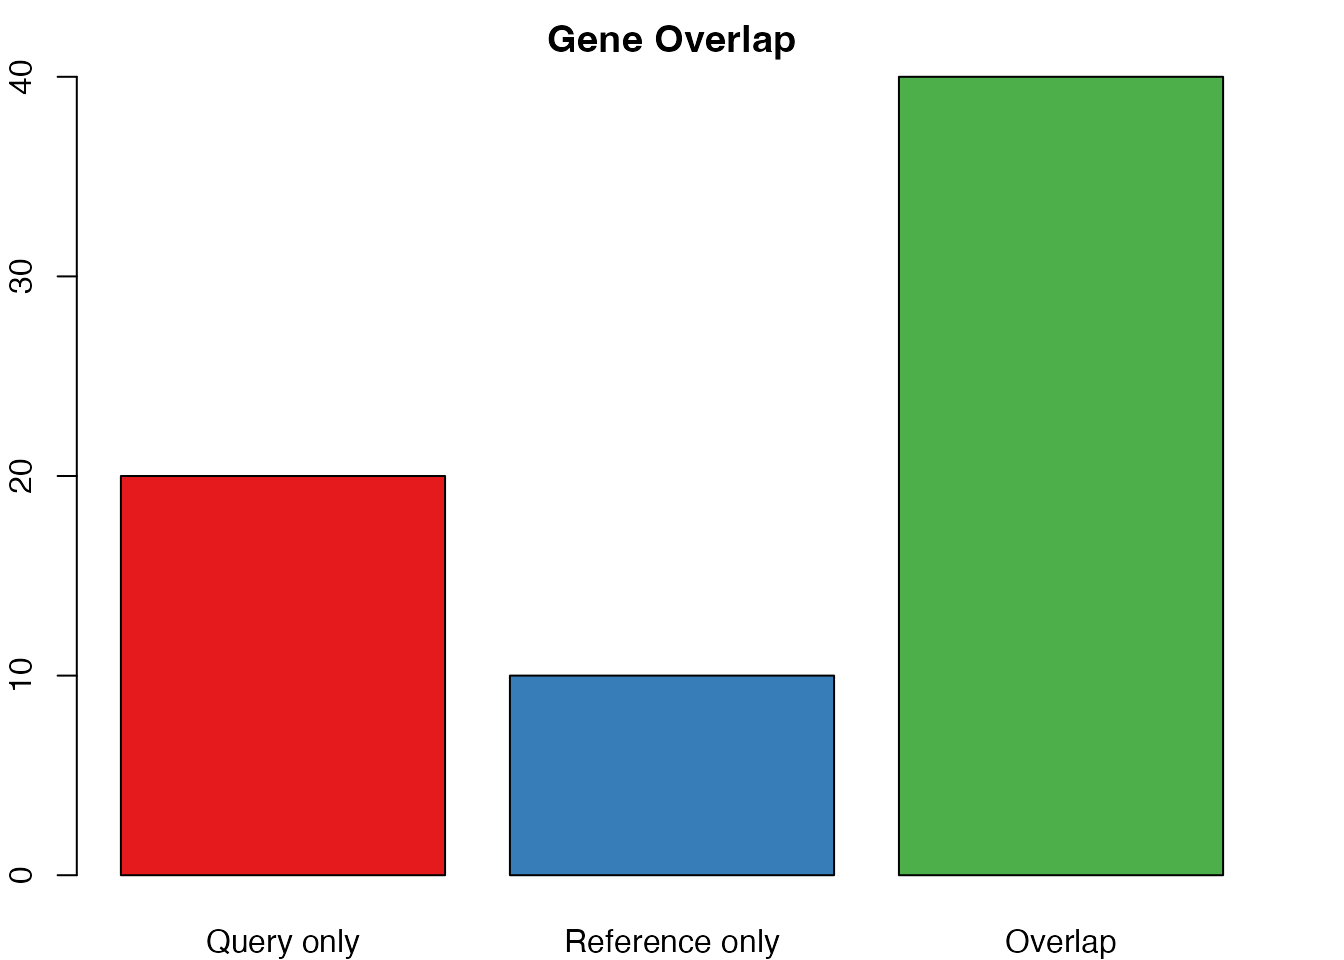
Checking gene overlap between query and reference
Troubleshooting
Low Gene Overlap
# Check overlap
ref_genes <- colnames(spectra)
query_genes <- rownames(GetAssayData(seurat_obj))
overlap <- intersect(query_genes, ref_genes)

if (length(overlap) / length(ref_genes) < 0.5) {
  warning("Low gene overlap - check gene naming conventions")

  # Try converting gene symbols
  # e.g., from ENSEMBL to symbol, or uppercase/lowercase
}
All-Zero Usage
If all usage values are zero:
- Check gene overlap (see above)
- Verify data is non-negative
- Check for extreme sparsity
Session Info
sessionInfo()
#> R version 4.4.0 (2024-04-24)
#> Platform: aarch64-apple-darwin20
#> Running under: macOS 15.6.1
#>
#> Matrix products: default
#> BLAS:   /Library/Frameworks/R.framework/Versions/4.4-arm64/Resources/lib/libRblas.0.dylib
#> LAPACK: /Library/Frameworks/R.framework/Versions/4.4-arm64/Resources/lib/libRlapack.dylib;  LAPACK version 3.12.0
#>
#> locale:
#> [1] C
#>
#> time zone: Asia/Shanghai
#> tzcode source: internal
#>
#> attached base packages:
#> [1] stats     graphics  grDevices utils     datasets  methods   base
#>
#> other attached packages:
#> [1] pheatmap_1.0.13         CellProgramMapper_1.0.0
#>
#> loaded via a namespace (and not attached):
#>  [1] Matrix_1.7-4        gtable_0.3.6        future.apply_1.20.1
#>  [4] jsonlite_2.0.0      compiler_4.4.0      Rcpp_1.1.1
#>  [7] dichromat_2.0-0.1   parallel_4.4.0      jquerylib_0.1.4
#> [10] scales_1.4.0        globals_0.18.0      systemfonts_1.3.1
#> [13] textshaping_1.0.4   yaml_2.3.12         fastmap_1.2.0
#> [16] lattice_0.22-7      R6_2.6.1            curl_7.0.0
#> [19] knitr_1.51          htmlwidgets_1.6.4   future_1.69.0
#> [22] desc_1.4.3          bslib_0.9.0         RColorBrewer_1.1-3
#> [25] rlang_1.1.7         cachem_1.1.0        xfun_0.56
#> [28] fs_1.6.6            sass_0.4.10         otel_0.2.0
#> [31] cli_3.6.5           pkgdown_2.2.0       digest_0.6.39
#> [34] grid_4.4.0          rappdirs_0.3.4      lifecycle_1.0.5
#> [37] glue_1.8.0          evaluate_1.0.5      data.table_1.18.0
#> [40] farver_2.1.2        listenv_0.10.0      codetools_0.2-20
#> [43] ragg_1.5.0          parallelly_1.46.1   rmarkdown_2.30
#> [46] tools_4.4.0         htmltools_0.5.9