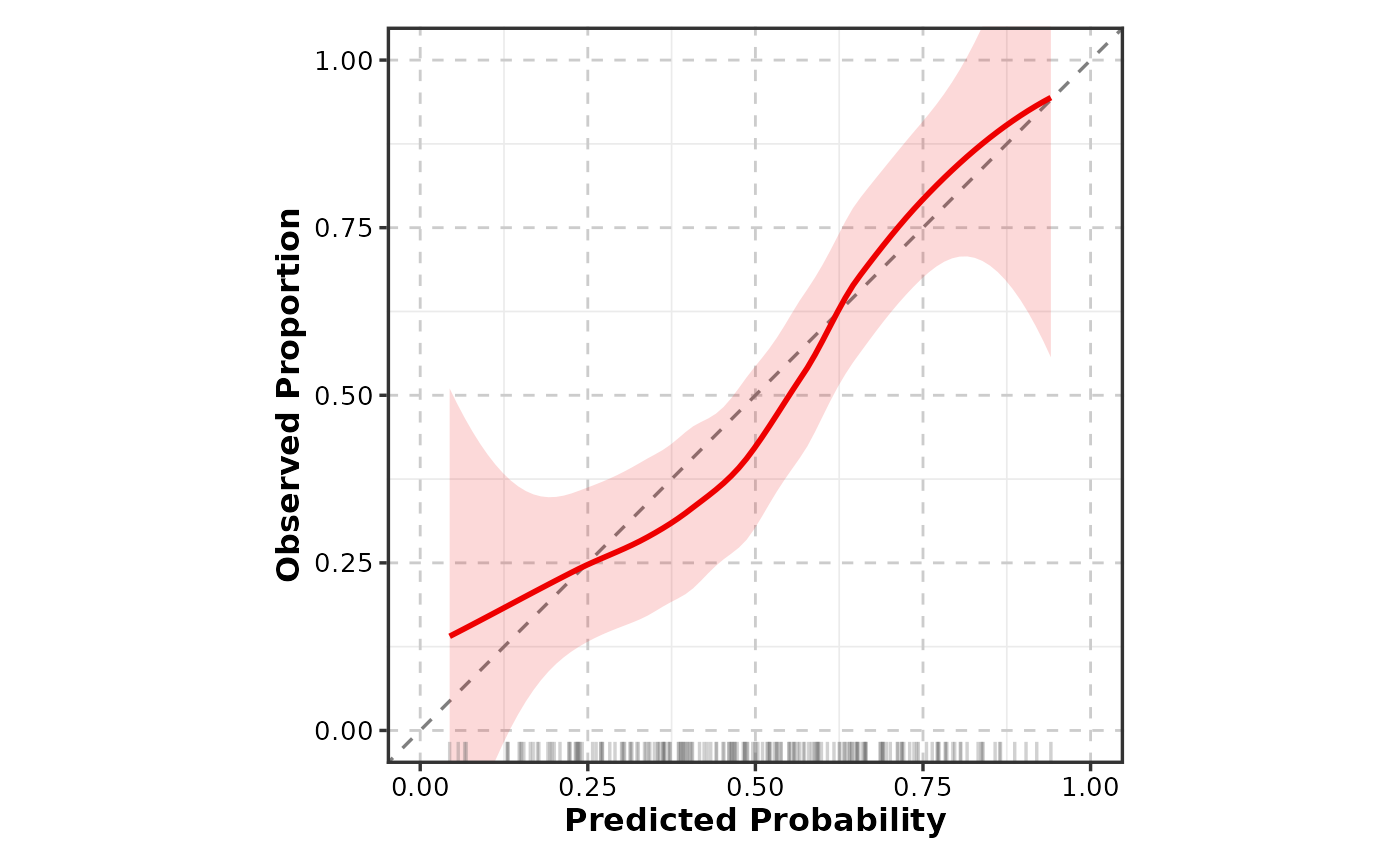
Creates calibration curves for assessing prediction model performance. Shows predicted probabilities vs. observed frequencies with an ideal reference line, LOESS smooth, and optional histogram of predictions.
Usage
CalibrationPlot(
  data,
  predicted,
  observed,
  n_bins = 10,
  method = c("loess", "bins"),
  add_histogram = TRUE,
  add_ci = TRUE,
  ideal_color = "grey50",
  smooth_color = "red2",
  smooth_width = 1,
  pt_size = 3,
  split_by = NULL,
  split_by_sep = "_",
  theme = "theme_ggforge_grid",
  theme_args = list(),
  palette = "forge",
  palcolor = NULL,
  alpha = 1,
  legend.position = "none",
  legend.direction = "vertical",
  title = NULL,
  subtitle = NULL,
  xlab = NULL,
  ylab = NULL,
  seed = 8525,
  combine = TRUE,
  nrow = NULL,
  ncol = NULL,
  byrow = TRUE,
  axes = NULL,
  axis_titles = NULL,
  guides = NULL,
  design = NULL,
  ...
)
Arguments
- data
A data frame containing the data to plot
- predicted
Column of predicted probabilities.
- observed
Column of binary observed outcomes (0/1).
- n_bins
Number of calibration bins (default 10).
- method
Smoothing method: "loess" or "bins".
- add_histogram
Whether to add a rug/histogram of predicted values.
- add_ci
Whether to show confidence intervals.
- ideal_color
Color for the ideal (diagonal) line.
- smooth_color
Color for the calibration curve.
- smooth_width
Line width for calibration curve.
- pt_size
Point size for binned calibration.
- split_by
Column name(s) to split data into multiple plots
- split_by_sep
Separator when concatenating multiple split_by columns
- theme
Theme name (string) or theme function
- theme_args
List of arguments passed to theme function
- palette
Color palette name
- palcolor
Custom colors for palette
- alpha
Transparency level (0-1)
- legend.position
Legend position: "none", "left", "right", "bottom", "top"
- legend.direction
Legend direction: "horizontal" or "vertical"
- title
Plot title
- subtitle
Plot subtitle
- xlab
X-axis label
- ylab
Y-axis label
- seed
Random seed for reproducibility
- combine
Whether to combine split plots into one
- nrow
Number of rows when combining plots
- ncol
Number of columns when combining plots
- byrow
Fill combined plots by row
- axes
How to handle axes in combined plots ("keep", "collect", "collect_x", "collect_y")
- axis_titles
How to handle axis titles in combined plots
- guides
How to handle guides in combined plots ("collect", "keep", "auto")
- design
Custom layout design for combined plots
- ...
Additional arguments passed to atomic plotting functions.
See also
Other clinical-prediction-plots:
DecisionCurvePlot(),
NomogramPlot()