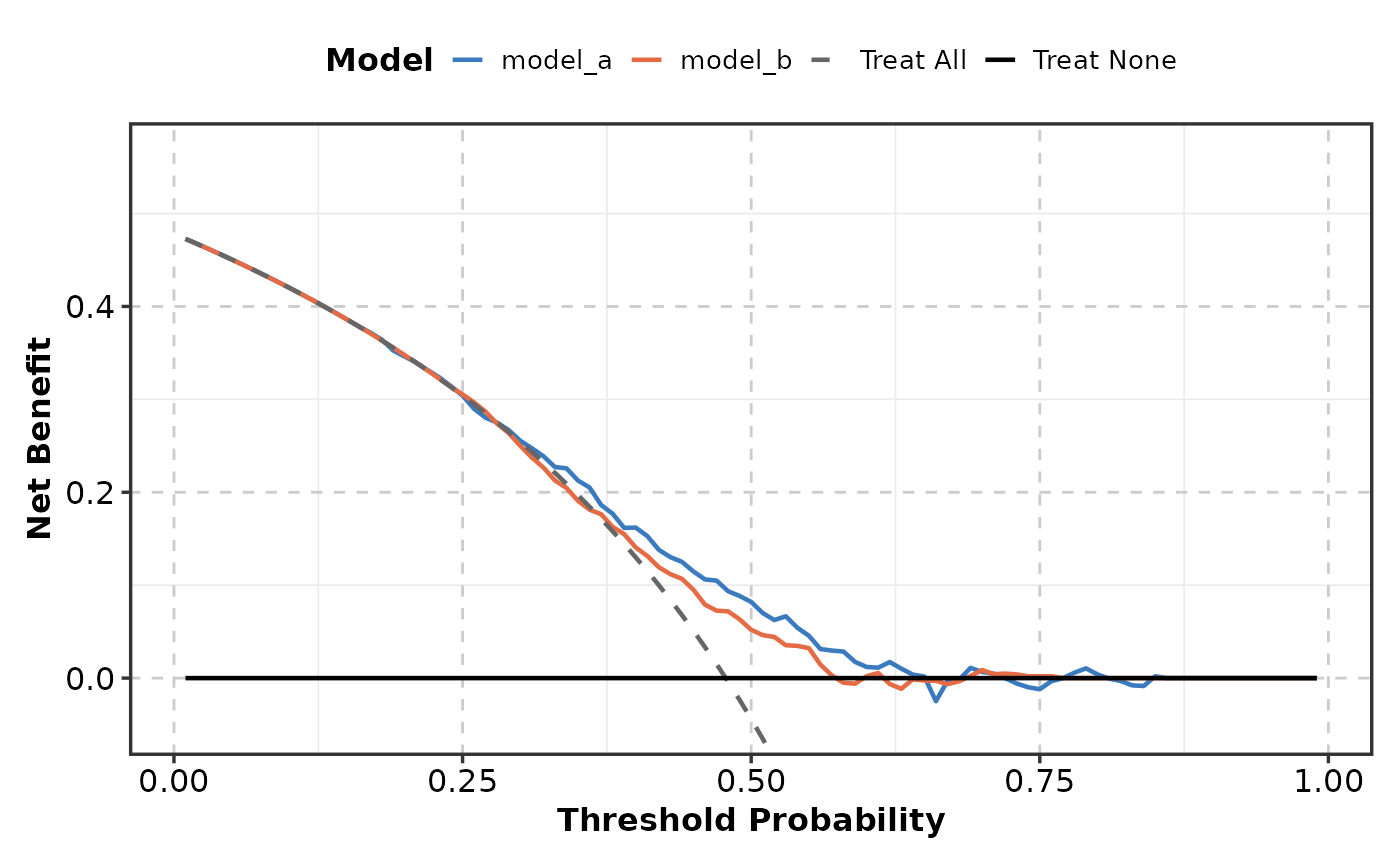
Creates decision curve analysis (DCA) plots for evaluating the clinical utility of prediction models. Shows net benefit across threshold probabilities, with reference strategies (treat-all, treat-none).
Usage
DecisionCurvePlot(
  data,
  outcome,
  predictors,
  thresholds = seq(0.01, 0.99, by = 0.01),
  predictor_names = NULL,
  show_treat_all = TRUE,
  show_treat_none = TRUE,
  treat_all_color = "grey40",
  treat_none_color = "black",
  line_width = 0.8,
  split_by = NULL,
  split_by_sep = "_",
  theme = "theme_ggforge_grid",
  theme_args = list(),
  palette = "forge",
  palcolor = NULL,
  alpha = 1,
  legend.position = "top",
  legend.direction = "horizontal",
  title = NULL,
  subtitle = NULL,
  xlab = NULL,
  ylab = NULL,
  seed = 8525,
  combine = TRUE,
  nrow = NULL,
  ncol = NULL,
  byrow = TRUE,
  axes = NULL,
  axis_titles = NULL,
  guides = NULL,
  design = NULL,
  ...
)
Arguments
- data
A data frame containing the data to plot
- outcome
Column for binary outcome (0/1).
- predictors
Character vector of column names for predicted probabilities or model scores. Each generates a separate curve.
- thresholds
Numeric vector of threshold probabilities to evaluate.
- predictor_names
Optional named vector for display names of predictors.
- show_treat_all
Whether to show the "treat all" reference line.
- show_treat_none
Whether to show the "treat none" reference line.
- treat_all_color
Color for treat-all line.
- treat_none_color
Color for treat-none line.
- line_width
Line width for curves.
- split_by
Column name(s) to split data into multiple plots
- split_by_sep
Separator when concatenating multiple split_by columns
- theme
Theme name (string) or theme function
- theme_args
List of arguments passed to theme function
- palette
Color palette name
- palcolor
Custom colors for palette
- alpha
Transparency level (0-1)
- legend.position
Legend position: "none", "left", "right", "bottom", "top"
- legend.direction
Legend direction: "horizontal" or "vertical"
- title
Plot title
- subtitle
Plot subtitle
- xlab
X-axis label
- ylab
Y-axis label
- seed
Random seed for reproducibility
- combine
Whether to combine split plots into one
- nrow
Number of rows when combining plots
- ncol
Number of columns when combining plots
- byrow
Fill combined plots by row
- axes
How to handle axes in combined plots ("keep", "collect", "collect_x", "collect_y")
- axis_titles
How to handle axis titles in combined plots
- guides
How to handle guides in combined plots ("collect", "keep", "auto")
- design
Custom layout design for combined plots
- ...
Additional arguments passed to atomic plotting functions.
See also
Other clinical-prediction-plots:
CalibrationPlot(),
NomogramPlot()
Examples
# \donttest{
set.seed(42)
n <- 500
x1 <- rnorm(n); x2 <- rnorm(n)
outcome <- rbinom(n, 1, plogis(0.5 * x1 + 0.3 * x2))
data <- data.frame(
  outcome = outcome,
  model_a = plogis(0.5 * x1 + 0.3 * x2 + rnorm(n, 0, 0.2)),
  model_b = plogis(0.3 * x1 + rnorm(n, 0, 0.3))
)
DecisionCurvePlot(data, outcome = "outcome",
  predictors = c("model_a", "model_b"))

# }
# }