A wrapped function around plotROC package to create ROC curves.
ROC (Receiver Operating Characteristic) curves are used to evaluate binary classification models
by plotting the true positive rate (sensitivity) against the false positive rate (1-specificity).
Usage
ROCCurve(
  data,
  truth_by,
  score_by,
  pos_label = NULL,
  split_by = NULL,
  split_by_sep = "_",
  group_by = NULL,
  group_by_sep = "_",
  group_name = NULL,
  x_axis_reverse = FALSE,
  percent = FALSE,
  ci = NULL,
  n_cuts = 0,
  cutoffs_at = NULL,
  cutoffs_labels = NULL,
  cutoffs_accuracy = 0.001,
  cutoffs_pt_size = 5,
  cutoffs_pt_shape = 4,
  cutoffs_pt_stroke = 1,
  cutoffs_labal_fg = "black",
  cutoffs_label_size = 4,
  cutoffs_label_bg = "white",
  cutoffs_label_bg_r = 0.1,
  show_auc = c("auto", "none", "legend", "plot"),
  auc_accuracy = 0.01,
  auc_size = 4,
  increasing = TRUE,
  theme = "theme_ggforge",
  theme_args = list(),
  palette = "Spectral",
  palcolor = NULL,
  alpha = 1,
  facet_by = NULL,
  facet_scales = "fixed",
  facet_ncol = NULL,
  facet_nrow = NULL,
  facet_byrow = TRUE,
  aspect.ratio = NULL,
  legend.position = "right",
  legend.direction = "vertical",
  title = NULL,
  subtitle = NULL,
  xlab = ifelse(x_axis_reverse, "Specificity", "1 - Specificity"),
  ylab = "Sensitivity",
  combine = TRUE,
  nrow = NULL,
  ncol = NULL,
  byrow = TRUE,
  seed = 8525,
  axes = NULL,
  axis_titles = axes,
  guides = NULL,
  design = NULL,
  ...
)
Arguments
- data
A data frame containing the data to plot
- truth_by
A character string of the column name that contains the true class labels. (a.k.a. the binary outcome, 1/0 or TRUE/FALSE.)
- score_by
character strings of the column names that contains the predicted scores. When multiple columns are provided, the ROC curve is plotted for each column.
- pos_label
A character string of the positive class label. When NULL, the labels will be handled by the
plotROCpackage.- split_by
Column name(s) to split data into multiple plots
- split_by_sep
Separator when concatenating multiple split_by columns
- group_by
Column name(s) for grouping data
- group_by_sep
Separator when concatenating multiple group_by columns
- group_name
A character string to name the legend of the ROC curve groups.
- x_axis_reverse
A logical to reverse the x-axis, that is from 1 to 0.
- percent
A logical to display the x and y axis as percentages.
- ci
A list of arguments to pass to
plotROC::geom_rocci()to add confidence intervals. When NULL, no confidence intervals are added.- n_cuts
An integer to specify the number of cutpoints on the ROC curve. It will be the quantiles of the predicted scores.
- cutoffs_at
Vector of user supplied cutoffs to plot as points. If non-NULL, it will override the values of n_cuts and plot the observed cutoffs closest to the user-supplied ones. Both
cutoffs_atandcutoffs.labelswill be passed toplotROC::geom_roc(). Other than numeric values, the following special values are allowed. These values are the methods ofOptimalCutpoints::optimal.cutpoints().- cutoffs_labels
vector of user-supplied labels for the cutoffs. Must be a character vector of the same length as cutoffs_at.
- cutoffs_accuracy
A numeric to specify the accuracy of the cutoff values to show.
- cutoffs_pt_size
A numeric to specify the size of the cutoff points.
- cutoffs_pt_shape
A numeric to specify the shape of the cutoff points.
- cutoffs_pt_stroke
A numeric to specify the stroke of the cutoff points.
- cutoffs_labal_fg
A character string to specify the color of the cutoff labels.
- cutoffs_label_size
A numeric to specify the size of the cutoff labels.
- cutoffs_label_bg
A character string to specify the background color of the cutoff labels.
- cutoffs_label_bg_r
A numeric to specify the radius of the background of the cutoff labels.
- show_auc
A character string to specify the position of the AUC values.
"auto" (default): Automatically determine the position based on the plot. When there is a single group or 'facet_by' is provided, the AUC is placed on the plot. Otherwise, the AUC is placed in the legend.
"none": Do not display the AUC values.
"legend": Display the AUC values in the legend.
"plot": Display the AUC values on the plot (left/right bottom corner).
- auc_accuracy
A numeric to specify the accuracy of the AUC values.
- auc_size
A numeric to specify the size of the AUC values when they are displayed on the plot.
- increasing
TRUE if the score is increasing with the truth (1), FALSE otherwise.
- theme
Theme name (string) or theme function
- theme_args
List of arguments passed to theme function
- palette
Color palette name
- palcolor
Custom colors for palette
- alpha
Transparency level (0-1)
- facet_by
Column name(s) for faceting the plot
- facet_scales
Scales for facets: "fixed", "free", "free_x", "free_y"
- facet_ncol
Number of columns in facet layout
- facet_nrow
Number of rows in facet layout
- facet_byrow
Fill facets by row (TRUE) or column (FALSE)
- aspect.ratio
Aspect ratio of plot panel
- legend.position
Legend position: "none", "left", "right", "bottom", "top"
- legend.direction
Legend direction: "horizontal" or "vertical"
- title
Plot title
- subtitle
Plot subtitle
- xlab
X-axis label
- ylab
Y-axis label
- combine
Whether to combine split plots into one
- nrow
Number of rows when combining plots
- ncol
Number of columns when combining plots
- byrow
Fill combined plots by row
- seed
Random seed for reproducibility
- axes
How to handle axes in combined plots ("keep", "collect", "collect_x", "collect_y")
- axis_titles
How to handle axis titles in combined plots
- guides
How to handle guides in combined plots ("collect", "keep", "auto")
- design
Custom layout design for combined plots
- ...
Additional arguments passed to atomic plotting functions.
Value
A patchwork::wrap_plots object or a list of them if combine is FALSE.
You can retrieve the AUC values using attr(p, "auc") if combine is TRUE.
If combine is FALSE, The AUC value of each plot can be retrieved using attr(p[[i]], "auc").
Examples
set.seed(8525)
D.ex <- rbinom(200, size = 1, prob = .5)
M1 <- rnorm(200, mean = D.ex, sd = .65)
M2 <- rnorm(200, mean = D.ex, sd = 1.5)
gender <- c("Male", "Female")[rbinom(200, 1, .49) + 1]
data <- data.frame(
D = D.ex, D.str = c("Healthy", "Ill")[D.ex + 1],
gender = gender, M1 = M1, M2 = M2
)
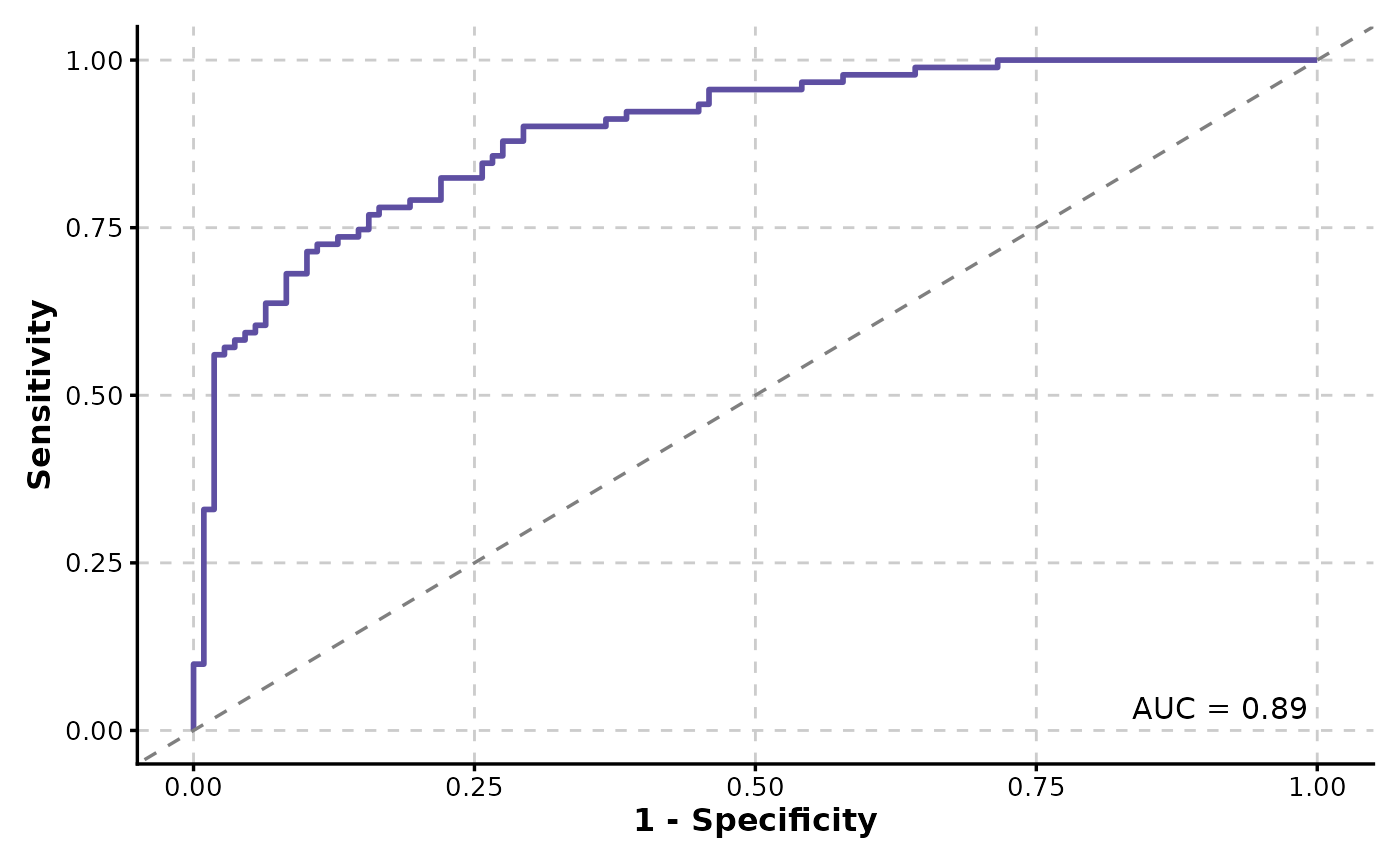
ROCCurve(data, truth_by = "D", score_by = "M1")
 # will warn about the positive label
ROCCurve(data, truth_by = "D.str", score_by = "M1")
#> Warning: `pos_label` is NULL, value "Ill" from "D.str" will be used as the positive
#> label.
# will warn about the positive label
ROCCurve(data, truth_by = "D.str", score_by = "M1")
#> Warning: `pos_label` is NULL, value "Ill" from "D.str" will be used as the positive
#> label.
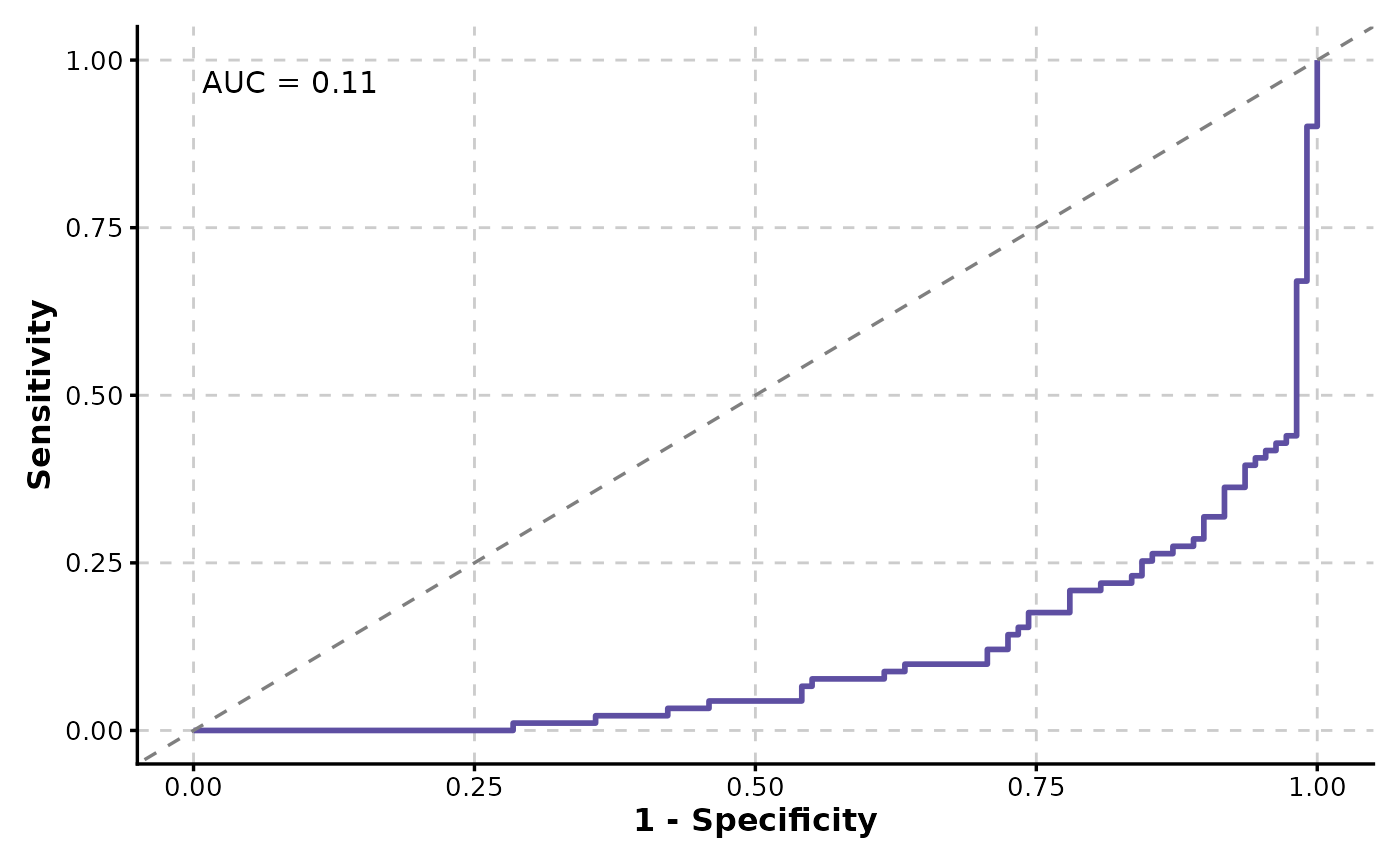
 ROCCurve(data, truth_by = "D", score_by = "M1", increasing = FALSE)
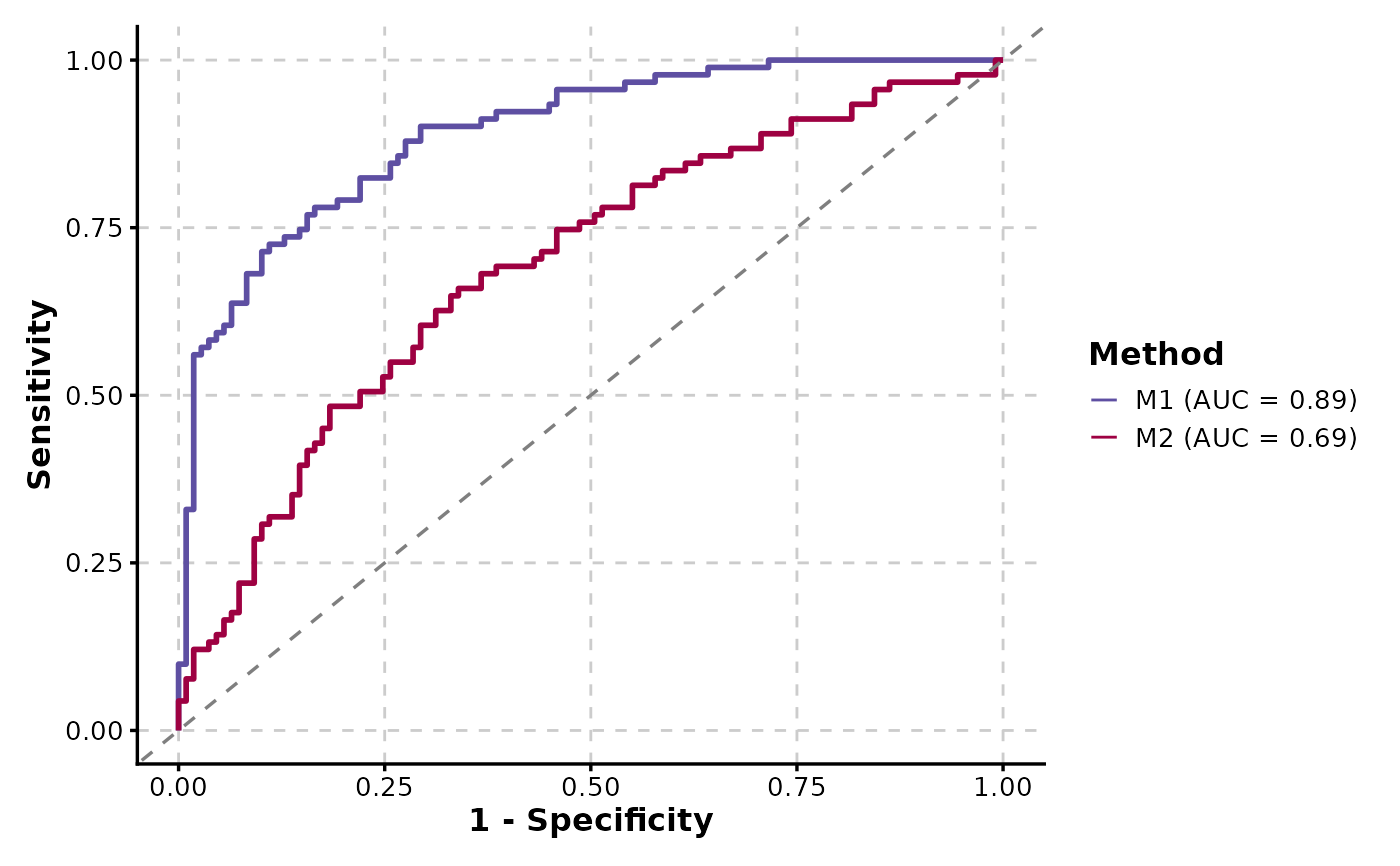
 # Multiple ROC curves
ROCCurve(data, truth_by = "D", score_by = c("M1", "M2"), group_name = "Method")
# Multiple ROC curves
ROCCurve(data, truth_by = "D", score_by = c("M1", "M2"), group_name = "Method")
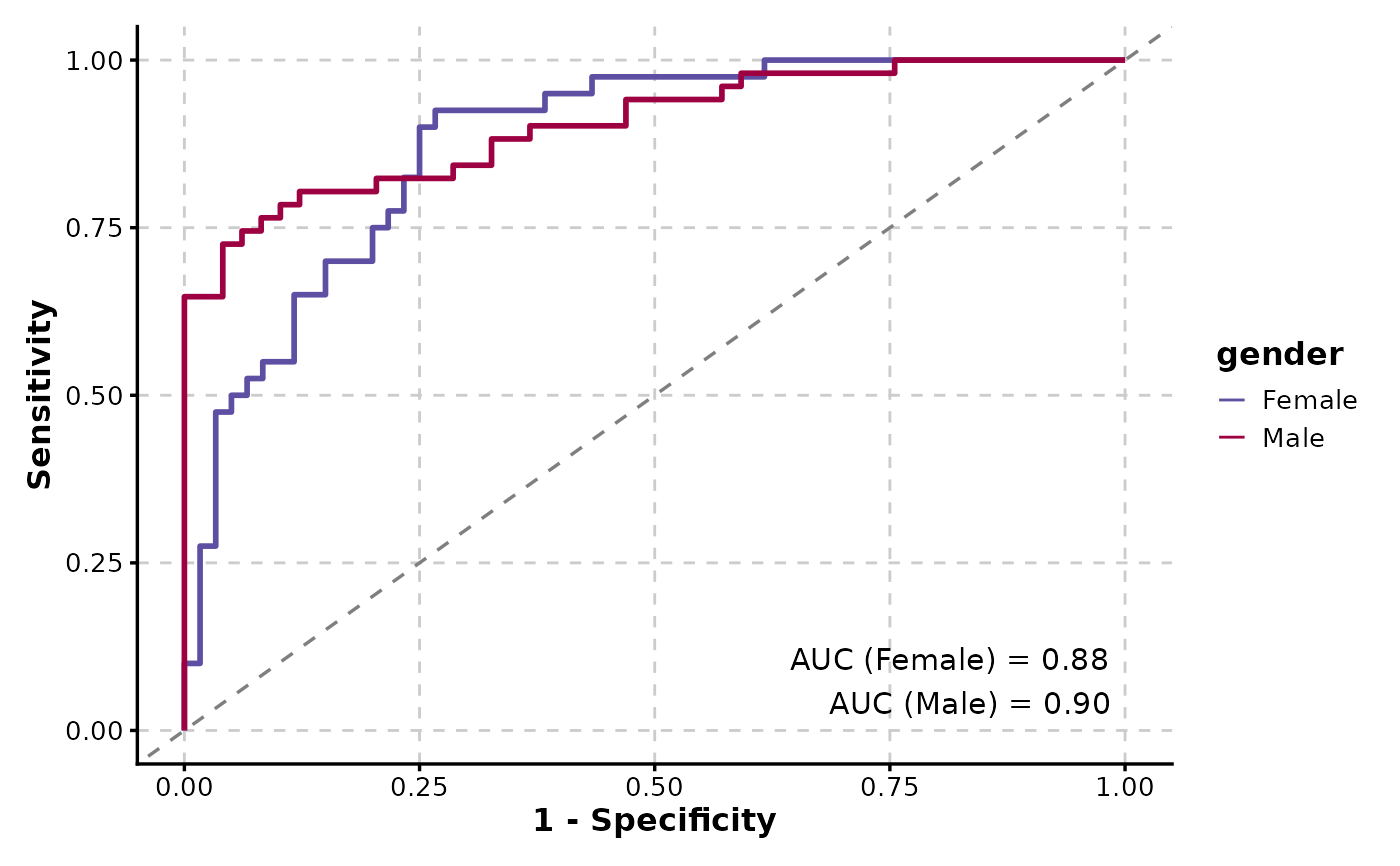
 ROCCurve(data, truth_by = "D", score_by = "M1", group_by = "gender", show_auc = "plot")
 # Reverse the x-axis and display the axes as percentages
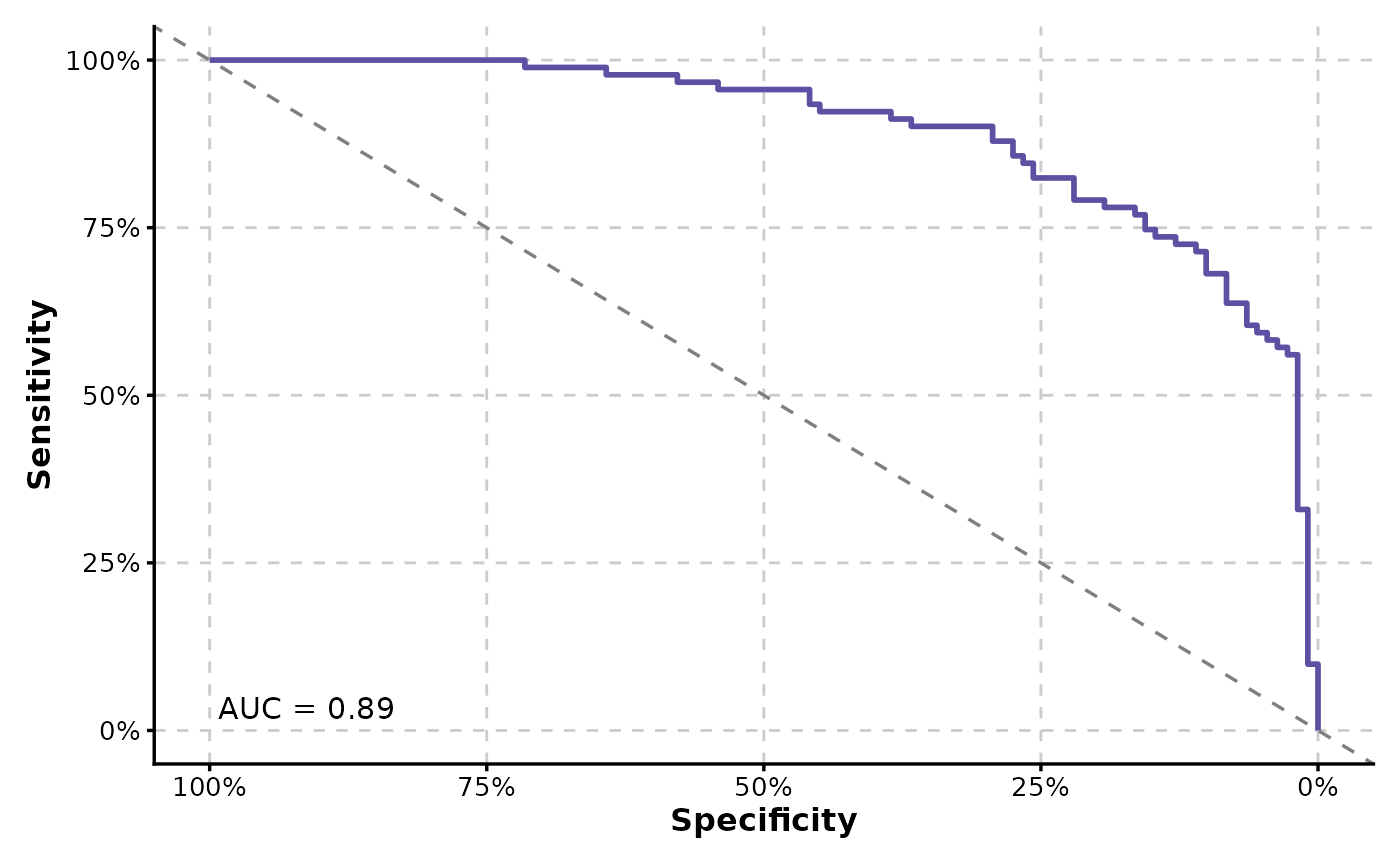
ROCCurve(data, truth_by = "D", score_by = "M1", x_axis_reverse = TRUE, percent = TRUE)
# Reverse the x-axis and display the axes as percentages
ROCCurve(data, truth_by = "D", score_by = "M1", x_axis_reverse = TRUE, percent = TRUE)
 # Pass additional arguments to geom_roc and make the curve black
ROCCurve(data, truth_by = "D", score_by = "M1", n_cuts = 10, palcolor = "black")
# Pass additional arguments to geom_roc and make the curve black
ROCCurve(data, truth_by = "D", score_by = "M1", n_cuts = 10, palcolor = "black")
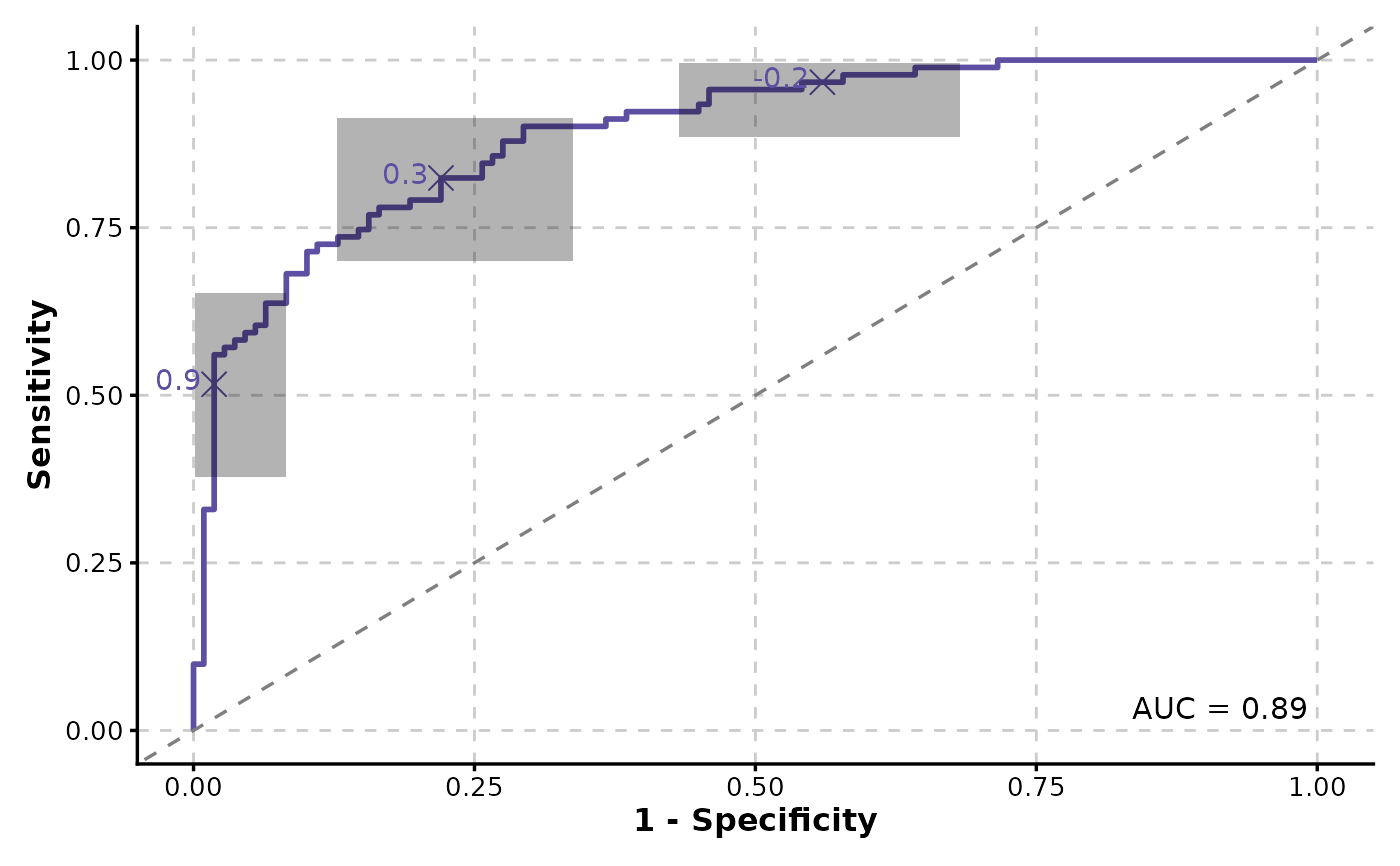
 # Add confidence intervals
ROCCurve(data, truth_by = "D", score_by = "M1", ci = list(sig.level = .01))
# Add confidence intervals
ROCCurve(data, truth_by = "D", score_by = "M1", ci = list(sig.level = .01))
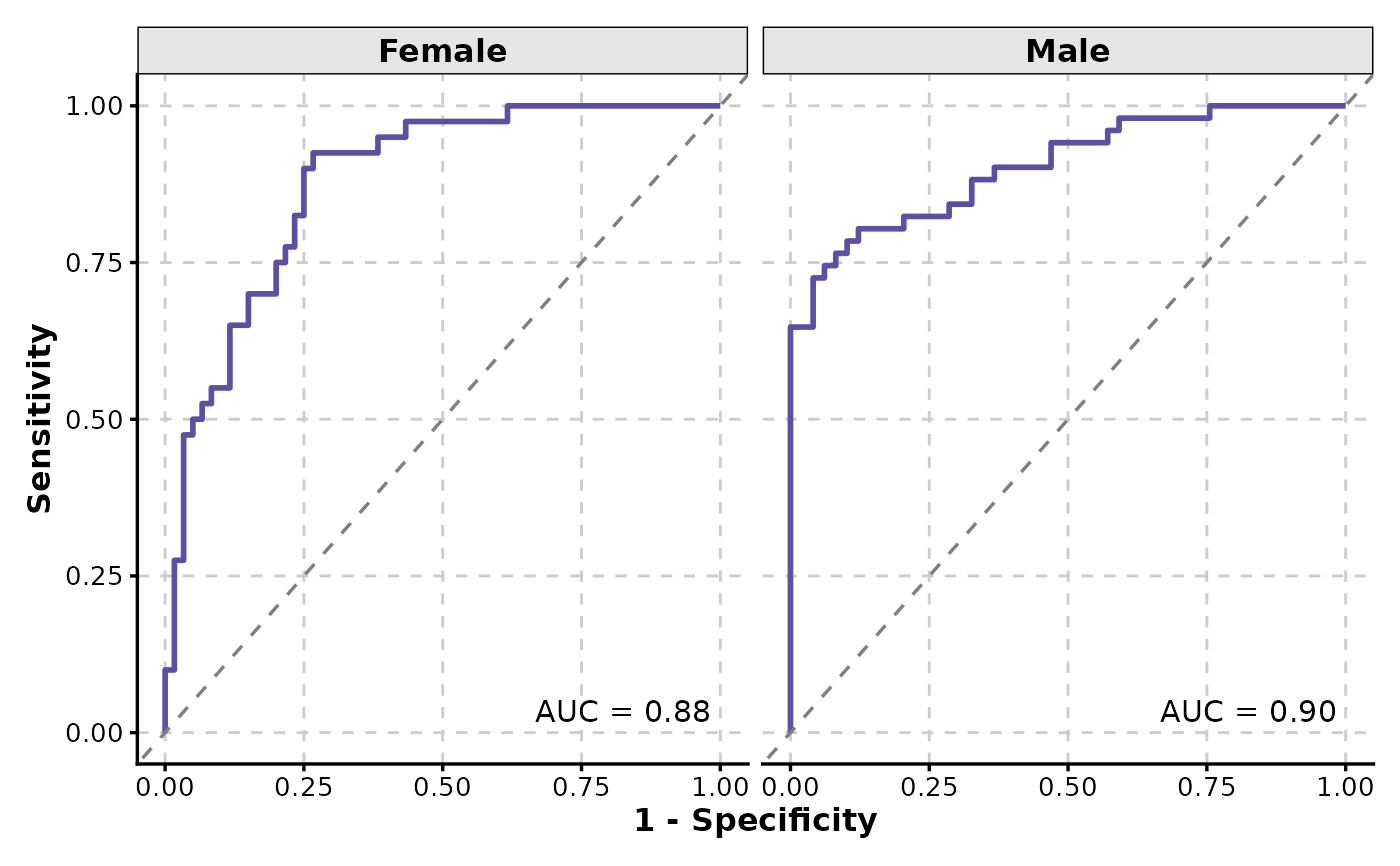
 # Facet by a column
ROCCurve(data, truth_by = "D", score_by = "M1", facet_by = "gender")
# Facet by a column
ROCCurve(data, truth_by = "D", score_by = "M1", facet_by = "gender")
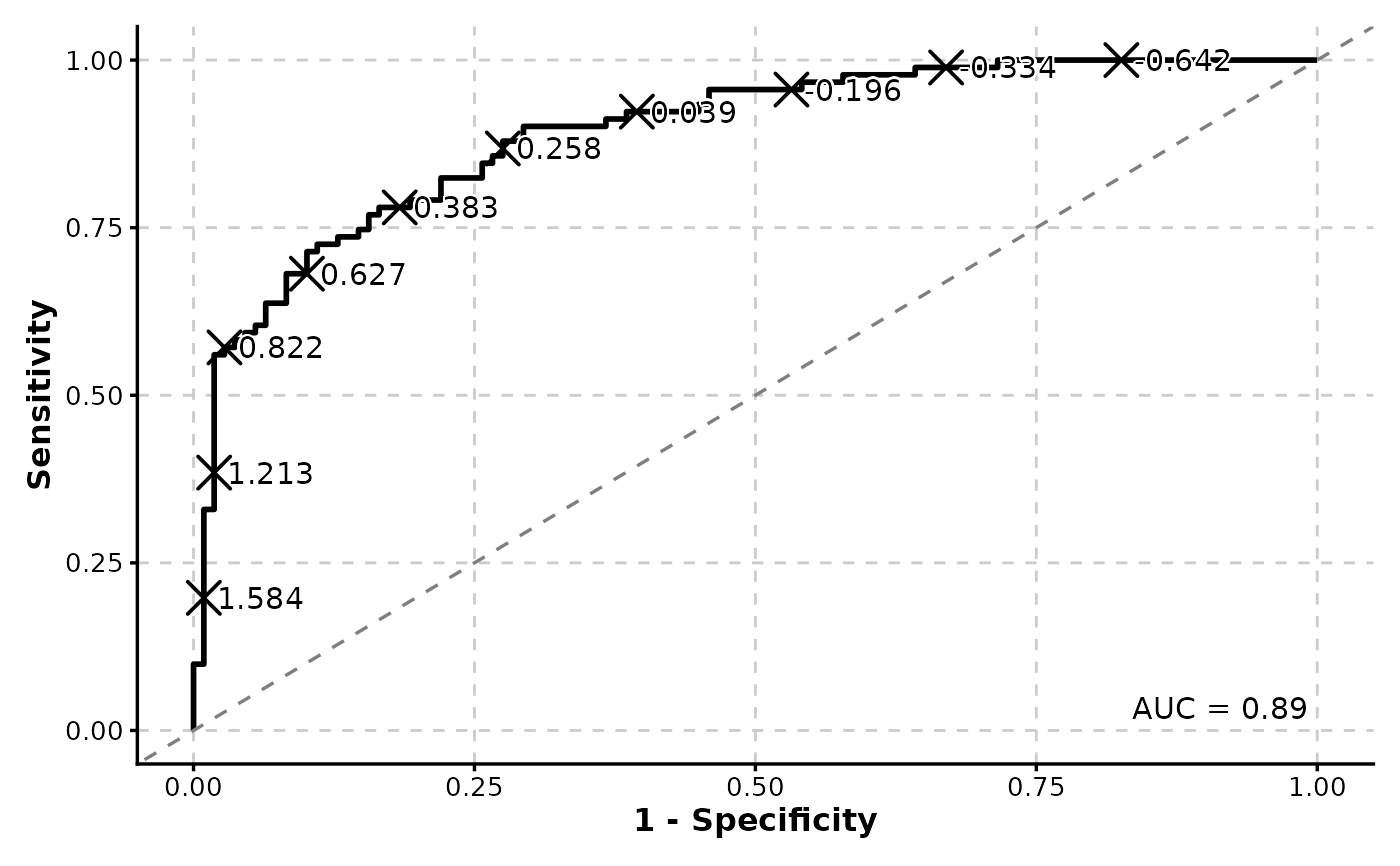
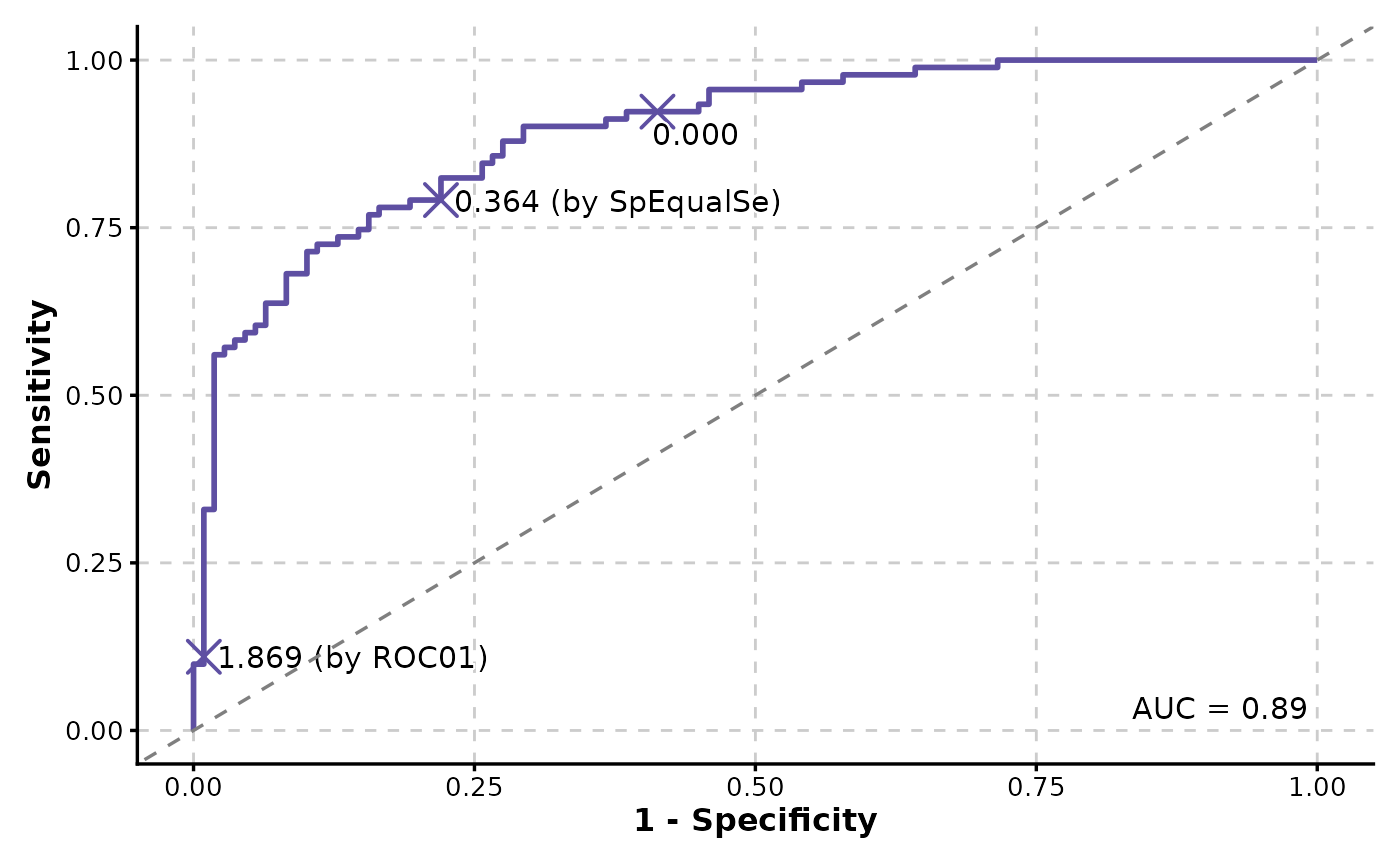
 # Show cutoffs
ROCCurve(data, truth_by = "D", score_by = "M1", cutoffs_at = c(0, "ROC01", "SpEqualSe"))
# Show cutoffs
ROCCurve(data, truth_by = "D", score_by = "M1", cutoffs_at = c(0, "ROC01", "SpEqualSe"))
 # Split by a column
p <- ROCCurve(data, truth_by = "D", score_by = "M1", split_by = "gender")
p
# Split by a column
p <- ROCCurve(data, truth_by = "D", score_by = "M1", split_by = "gender")
p
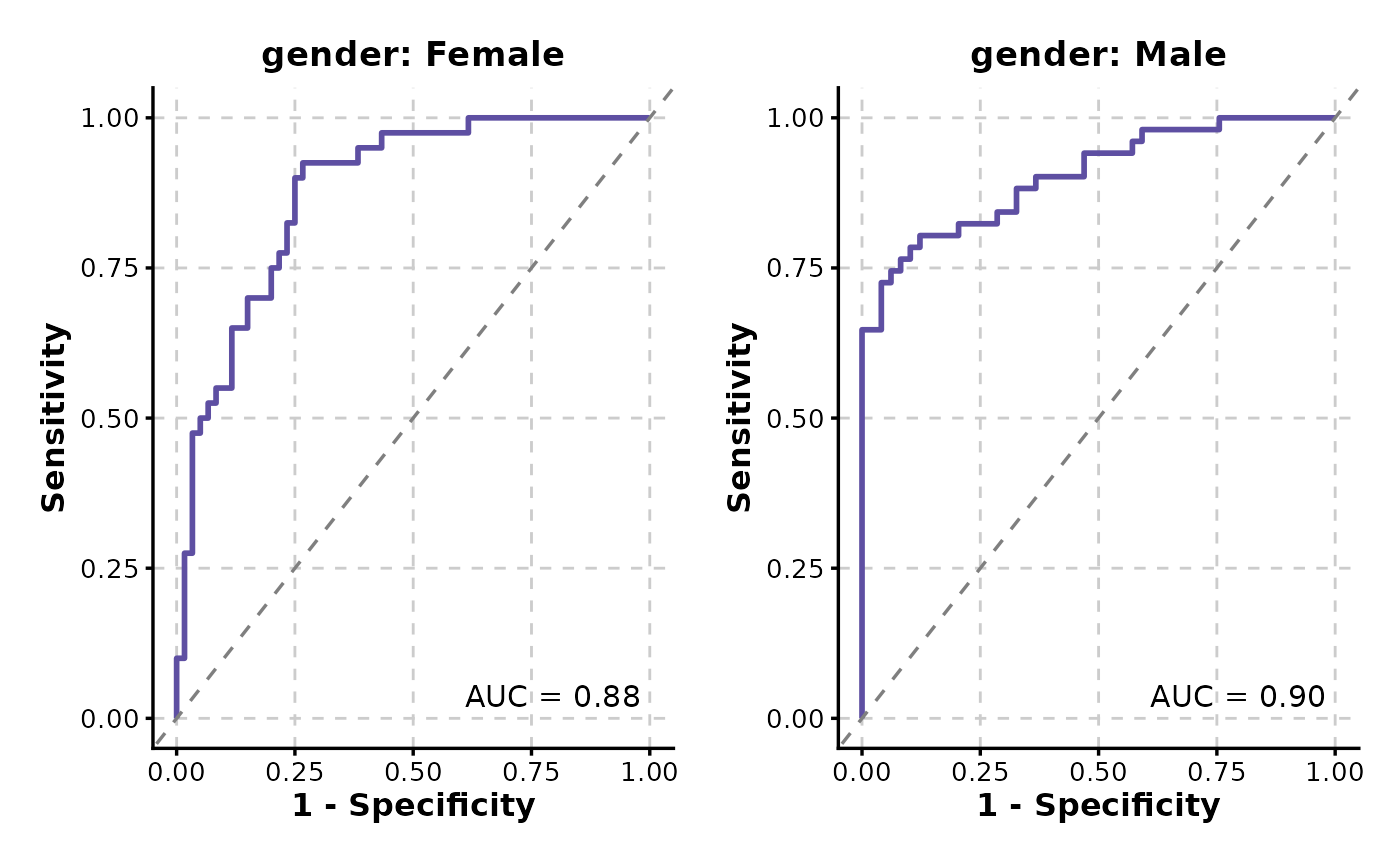 # Retrieve the AUC values
attr(p, "auc")
#> PANEL COORD group AUC gender
#> 1 1 1 1 0.8779167 Female
#> 2 1 1 1 0.9039616 Male
# Retrieve the cutoffs
attr(p, "cutoffs")
#> NULL
# Retrieve the AUC values
attr(p, "auc")
#> PANEL COORD group AUC gender
#> 1 1 1 1 0.8779167 Female
#> 2 1 1 1 0.9039616 Male
# Retrieve the cutoffs
attr(p, "cutoffs")
#> NULL