Creates Bland-Altman plots for assessing agreement between two measurement methods. Shows the difference vs. the mean of paired measurements, with mean difference line and limits of agreement (LoA).
Usage
BlandAltmanPlot(
  data,
  method1,
  method2,
  log_transform = FALSE,
  ci_level = 0.95,
  add_ci = FALSE,
  pt_size = 2.5,
  pt_color = "black",
  mean_color = "blue",
  loa_color = "red2",
  loa_linetype = "dashed",
  split_by = NULL,
  split_by_sep = "_",
  theme = "theme_ggforge_grid",
  theme_args = list(),
  palette = "forge",
  palcolor = NULL,
  alpha = 0.7,
  legend.position = "none",
  legend.direction = "vertical",
  title = NULL,
  subtitle = NULL,
  xlab = NULL,
  ylab = NULL,
  seed = 8525,
  combine = TRUE,
  nrow = NULL,
  ncol = NULL,
  byrow = TRUE,
  axes = NULL,
  axis_titles = NULL,
  guides = NULL,
  design = NULL,
  ...
)
Arguments
- data
A data frame containing the data to plot
- method1
Column for first measurement method.
- method2
Column for second measurement method.
- log_transform
Whether to log-transform before analysis (ratio method).
- ci_level
Confidence level for limits of agreement (default 0.95).
- add_ci
Whether to show confidence intervals around mean and LoA.
- pt_size
Point size.
- pt_color
Point color or column for coloring.
- mean_color
Color for mean difference line.
- loa_color
Color for LoA lines.
- loa_linetype
Linetype for LoA lines.
- split_by
Column name(s) to split data into multiple plots
- split_by_sep
Separator when concatenating multiple split_by columns
- theme
Theme name (string) or theme function
- theme_args
List of arguments passed to theme function
- palette
Color palette name
- palcolor
Custom colors for palette
- alpha
Transparency level (0-1)
- legend.position
Legend position: "none", "left", "right", "bottom", "top"
- legend.direction
Legend direction: "horizontal" or "vertical"
- title
Plot title
- subtitle
Plot subtitle
- xlab
X-axis label
- ylab
Y-axis label
- seed
Random seed for reproducibility
- combine
Whether to combine split plots into one
- nrow
Number of rows when combining plots
- ncol
Number of columns when combining plots
- byrow
Fill combined plots by row
- axes
How to handle axes in combined plots ("keep", "collect", "collect_x", "collect_y")
- axis_titles
How to handle axis titles in combined plots
- guides
How to handle guides in combined plots ("collect", "keep", "auto")
- design
Custom layout design for combined plots
- ...
Additional arguments passed to atomic plotting functions.
See also
Other meta-analysis-plots:
ForestPlot(),
FunnelPlot()
Examples
# \donttest{
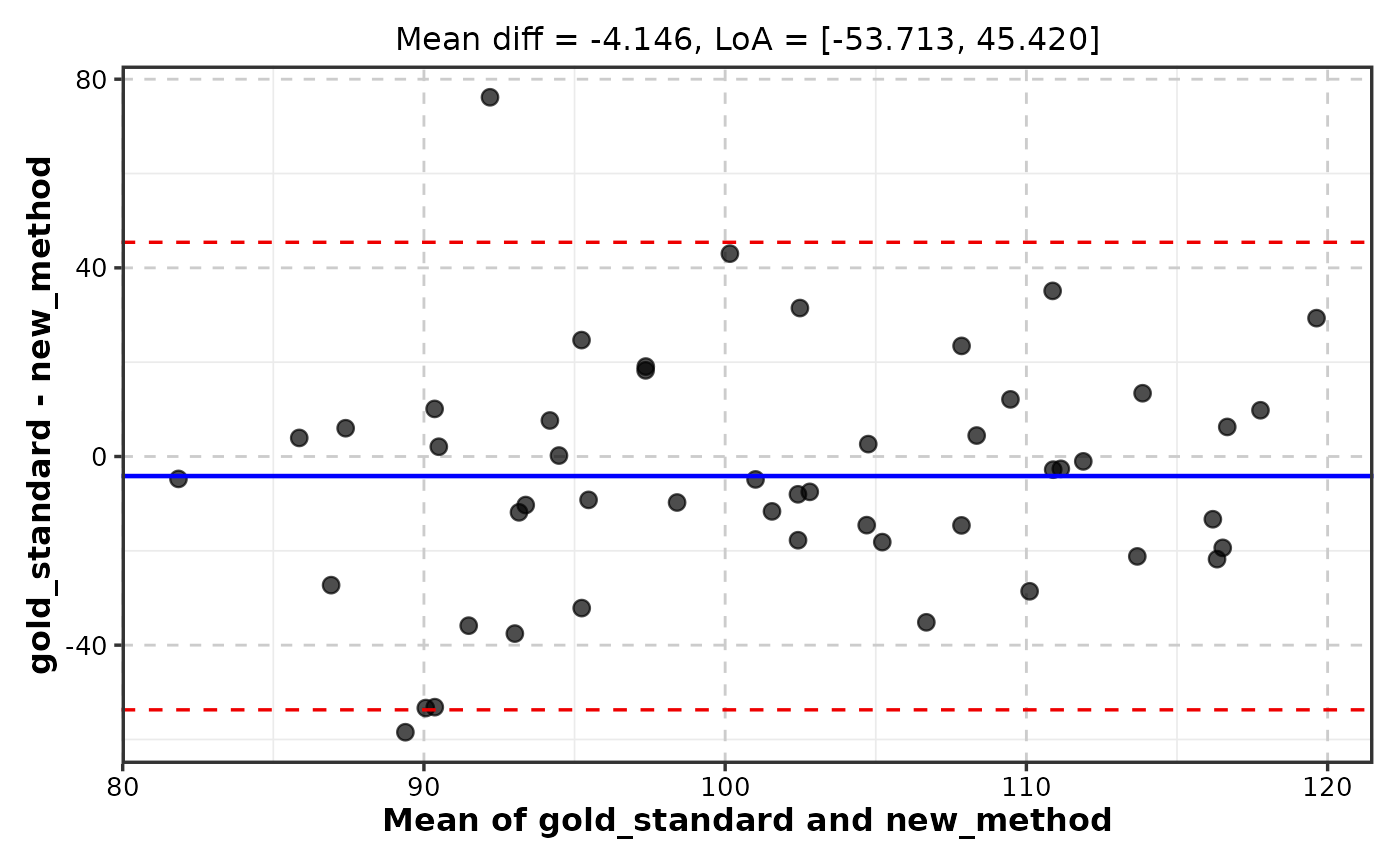
set.seed(42)
data <- data.frame(
gold_standard = rnorm(50, 100, 15),
new_method = rnorm(50, 102, 16)
)
BlandAltmanPlot(data, method1 = "gold_standard", method2 = "new_method")
 # }
# }