Creates general-purpose forest plots for meta-analysis and summary statistics. Unlike CoxPlot (Cox-specific HR), this supports OR, RR, SMD, WMD, with subgroup analysis, diamond summaries, and heterogeneity annotations.
Usage
ForestPlot(
  data,
  estimate,
  ci_lower,
  ci_upper,
  label = NULL,
  subgroup = NULL,
  weight = NULL,
  is_summary = NULL,
  null_value = 1,
  log_scale = FALSE,
  diamond_height = 0.4,
  pt_shape = 15,
  pt_size_range = c(1, 5),
  ci_linewidth = 0.7,
  show_values = TRUE,
  values_size = 3.5,
  color_by = NULL,
  color_name = NULL,
  split_by = NULL,
  split_by_sep = "_",
  theme = "theme_ggforge",
  theme_args = list(),
  palette = "forge",
  palcolor = NULL,
  alpha = 1,
  legend.position = "none",
  legend.direction = "vertical",
  title = NULL,
  subtitle = NULL,
  xlab = NULL,
  ylab = NULL,
  seed = 8525,
  combine = TRUE,
  nrow = NULL,
  ncol = NULL,
  byrow = TRUE,
  axes = NULL,
  axis_titles = NULL,
  guides = NULL,
  design = NULL,
  ...
)
Arguments
- data
A data frame containing the data to plot
- estimate
Column for point estimates.
- ci_lower
Column for lower confidence interval.
- ci_upper
Column for upper confidence interval.
- label
Column for row labels (study names).
- subgroup
Column for subgroup headers.
- weight
Column for study weights (controls point size). If NULL, equal weights.
- is_summary
Logical column or vector indicating summary/diamond rows.
- null_value
Reference line value (1 for ratios, 0 for differences).
- log_scale
Whether to use log scale for x-axis (typical for OR/RR/HR).
- diamond_height
Height of summary diamonds (0-1).
- pt_shape
Shape for study points.
- pt_size_range
Range for point sizes.
- ci_linewidth
Line width for confidence intervals.
- show_values
Whether to annotate estimates and CIs as text on the right.
- values_size
Text size for value annotations.
- color_by
Column for coloring points/CIs.
- color_name
Legend title for color.
- split_by
Column name(s) to split data into multiple plots
- split_by_sep
Separator when concatenating multiple split_by columns
- theme
Theme name (string) or theme function
- theme_args
List of arguments passed to theme function
- palette
Color palette name
- palcolor
Custom colors for palette
- alpha
Transparency level (0-1)
- legend.position
Legend position: "none", "left", "right", "bottom", "top"
- legend.direction
Legend direction: "horizontal" or "vertical"
- title
Plot title
- subtitle
Plot subtitle
- xlab
X-axis label
- ylab
Y-axis label
- seed
Random seed for reproducibility
- combine
Whether to combine split plots into one
- nrow
Number of rows when combining plots
- ncol
Number of columns when combining plots
- byrow
Fill combined plots by row
- axes
How to handle axes in combined plots ("keep", "collect", "collect_x", "collect_y")
- axis_titles
How to handle axis titles in combined plots
- guides
How to handle guides in combined plots ("collect", "keep", "auto")
- design
Custom layout design for combined plots
- ...
Additional arguments passed to atomic plotting functions.
See also
Other meta-analysis-plots:
BlandAltmanPlot(),
FunnelPlot()
Examples
# \donttest{
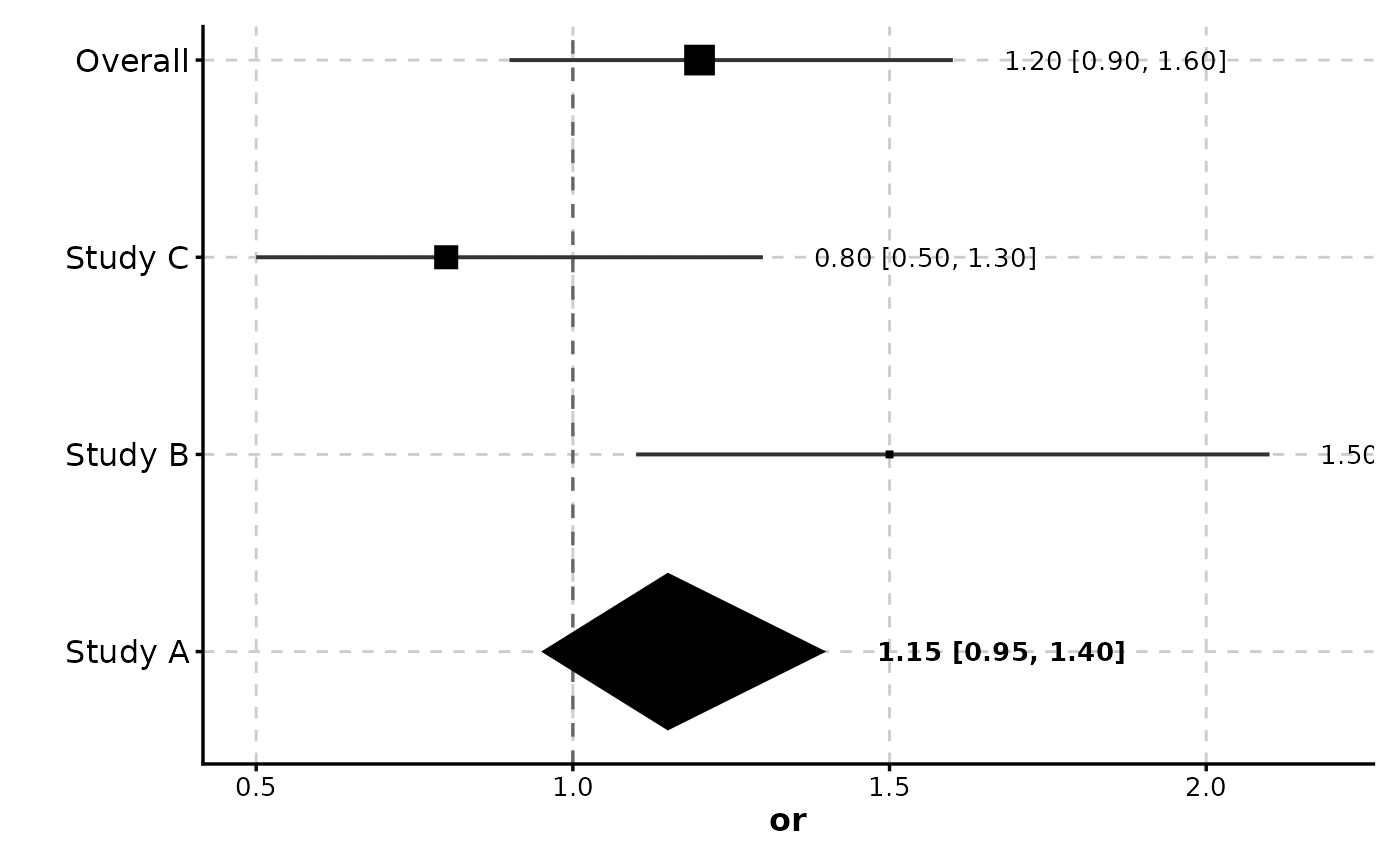
meta <- data.frame(
study = c("Study A", "Study B", "Study C", "Overall"),
or = c(1.2, 0.8, 1.5, 1.15),
lower = c(0.9, 0.5, 1.1, 0.95),
upper = c(1.6, 1.3, 2.1, 1.40),
weight = c(30, 25, 20, NA),
is_summary = c(FALSE, FALSE, FALSE, TRUE)
)
ForestPlot(meta, estimate = "or", ci_lower = "lower", ci_upper = "upper",
label = "study", weight = "weight", is_summary = "is_summary")
 # }
# }