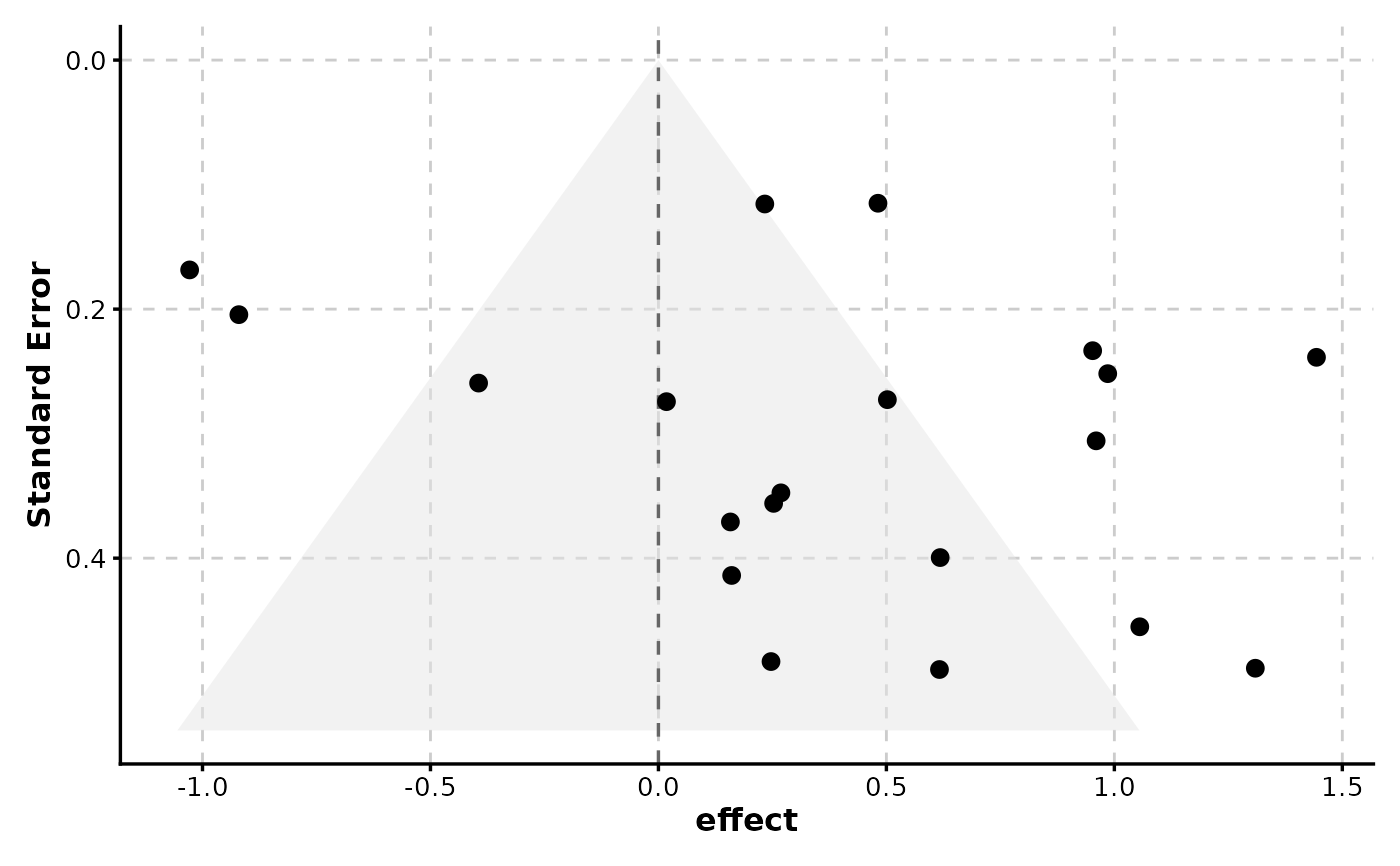
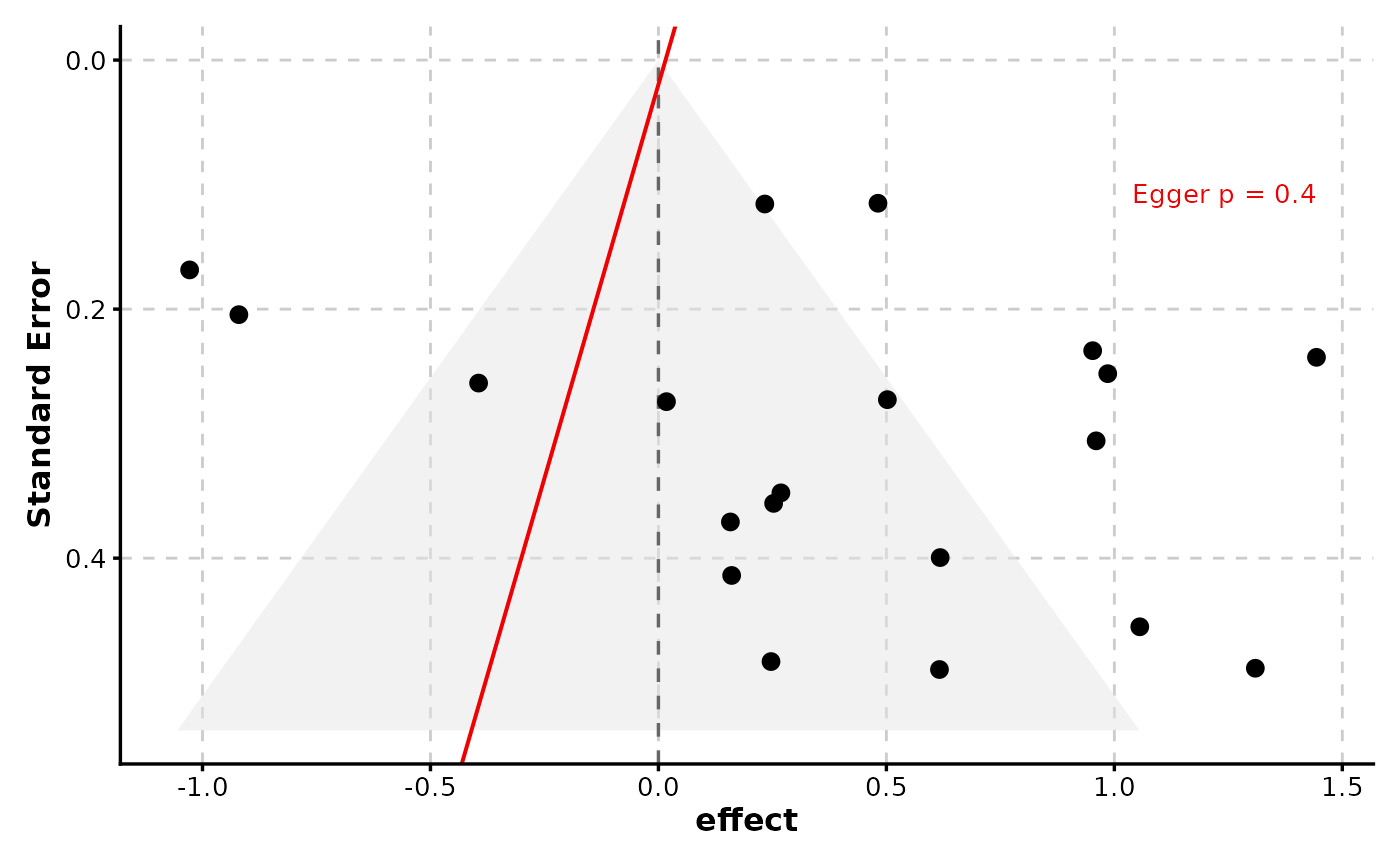
Creates funnel plots for assessing publication bias in meta-analyses. Shows effect estimates against precision (1/SE or sample size) with confidence region contours and optional Egger's regression line.
Usage
FunnelPlot(
  data,
  estimate,
  se,
  ci_level = 0.95,
  add_egger = FALSE,
  null_value = 0,
  contour_colors = c("white", "grey90", "grey80"),
  pt_size = 2.5,
  pt_color = "black",
  split_by = NULL,
  split_by_sep = "_",
  theme = "theme_ggforge",
  theme_args = list(),
  palette = "forge",
  palcolor = NULL,
  alpha = 1,
  legend.position = "none",
  legend.direction = "vertical",
  title = NULL,
  subtitle = NULL,
  xlab = NULL,
  ylab = NULL,
  seed = 8525,
  combine = TRUE,
  nrow = NULL,
  ncol = NULL,
  byrow = TRUE,
  axes = NULL,
  axis_titles = NULL,
  guides = NULL,
  design = NULL,
  ...
)
Arguments
- data
A data frame containing the data to plot
- estimate
Column for effect estimates.
- se
Column for standard errors.
- ci_level
Confidence level for funnel boundaries (default 0.95).
- add_egger
Whether to add Egger's regression line.
- null_value
Null hypothesis value (default 0 for SMD, use 1 for log-OR).
- contour_colors
Colors for significance contour regions.
- pt_size
Point size.
- pt_color
Point color.
- split_by
Column name(s) to split data into multiple plots
- split_by_sep
Separator when concatenating multiple split_by columns
- theme
Theme name (string) or theme function
- theme_args
List of arguments passed to theme function
- palette
Color palette name
- palcolor
Custom colors for palette
- alpha
Transparency level (0-1)
- legend.position
Legend position: "none", "left", "right", "bottom", "top"
- legend.direction
Legend direction: "horizontal" or "vertical"
- title
Plot title
- subtitle
Plot subtitle
- xlab
X-axis label
- ylab
Y-axis label
- seed
Random seed for reproducibility
- combine
Whether to combine split plots into one
- nrow
Number of rows when combining plots
- ncol
Number of columns when combining plots
- byrow
Fill combined plots by row
- axes
How to handle axes in combined plots ("keep", "collect", "collect_x", "collect_y")
- axis_titles
How to handle axis titles in combined plots
- guides
How to handle guides in combined plots ("collect", "keep", "auto")
- design
Custom layout design for combined plots
- ...
Additional arguments passed to atomic plotting functions.
See also
Other meta-analysis-plots:
BlandAltmanPlot(),
ForestPlot()
Examples
# \donttest{
set.seed(42)
meta <- data.frame(
  effect = rnorm(20, 0.3, 0.5),
  se = runif(20, 0.1, 0.5)
)
FunnelPlot(meta, estimate = "effect", se = "se")

FunnelPlot(meta, estimate = "effect", se = "se", add_egger = TRUE)

# }
# }