Creates 2D contour plots showing isolines or filled contours of a continuous surface defined by x, y, z coordinates. Useful in physics, chemistry, geology, meteorology, and engineering.
Usage
ContourPlot(
  data,
  x,
  y,
  z,
  type = c("filled", "lines", "both"),
  bins = NULL,
  binwidth = NULL,
  breaks = NULL,
  color_name = NULL,
  line_color = "grey30",
  line_width = 0.3,
  split_by = NULL,
  split_by_sep = "_",
  theme = "theme_ggforge_grid",
  theme_args = list(),
  palette = "Spectral",
  palcolor = NULL,
  alpha = 1,
  facet_by = NULL,
  facet_scales = "fixed",
  facet_nrow = NULL,
  facet_ncol = NULL,
  facet_byrow = TRUE,
  aspect.ratio = 1,
  legend.position = "right",
  legend.direction = "vertical",
  title = NULL,
  subtitle = NULL,
  xlab = NULL,
  ylab = NULL,
  seed = 8525,
  combine = TRUE,
  nrow = NULL,
  ncol = NULL,
  byrow = TRUE,
  axes = NULL,
  axis_titles = NULL,
  guides = NULL,
  design = NULL,
  ...
)
Arguments
- data
A data frame containing the data to plot
- x
Column name for x-axis (numeric).
- y
Column name for y-axis (numeric).
- z
Column name for z values (numeric).
- type
Contour type: "filled", "lines", or "both".
- bins
Number of contour bins.
- binwidth
Width of each contour bin.
- breaks
Explicit break values for contour levels.
- color_name
Legend title for fill/color scale.
- line_color
Color for contour lines (used when type includes lines).
- line_width
Width for contour lines.
- split_by
Column name(s) to split data into multiple plots
- split_by_sep
Separator when concatenating multiple split_by columns
- theme
Theme name (string) or theme function
- theme_args
List of arguments passed to theme function
- palette
Color palette name
- palcolor
Custom colors for palette
- alpha
Transparency level (0-1)
- facet_by
Column name(s) for faceting the plot
- facet_scales
Scales for facets: "fixed", "free", "free_x", "free_y"
- facet_nrow
Number of rows in facet layout
- facet_ncol
Number of columns in facet layout
- facet_byrow
Fill facets by row (TRUE) or column (FALSE)
- aspect.ratio
Aspect ratio of plot panel
- legend.position
Legend position: "none", "left", "right", "bottom", "top"
- legend.direction
Legend direction: "horizontal" or "vertical"
- title
Plot title
- subtitle
Plot subtitle
- xlab
X-axis label
- ylab
Y-axis label
- seed
Random seed for reproducibility
- combine
Whether to combine split plots into one
- nrow
Number of rows when combining plots
- ncol
Number of columns when combining plots
- byrow
Fill combined plots by row
- axes
How to handle axes in combined plots ("keep", "collect", "collect_x", "collect_y")
- axis_titles
How to handle axis titles in combined plots
- guides
How to handle guides in combined plots ("collect", "keep", "auto")
- design
Custom layout design for combined plots
- ...
Additional arguments passed to atomic plotting functions.
See also
Other earth-environmental-plots:
MapPlot(),
PolarPlot(),
TernaryPlot()
Examples
# \donttest{
# Generate grid data
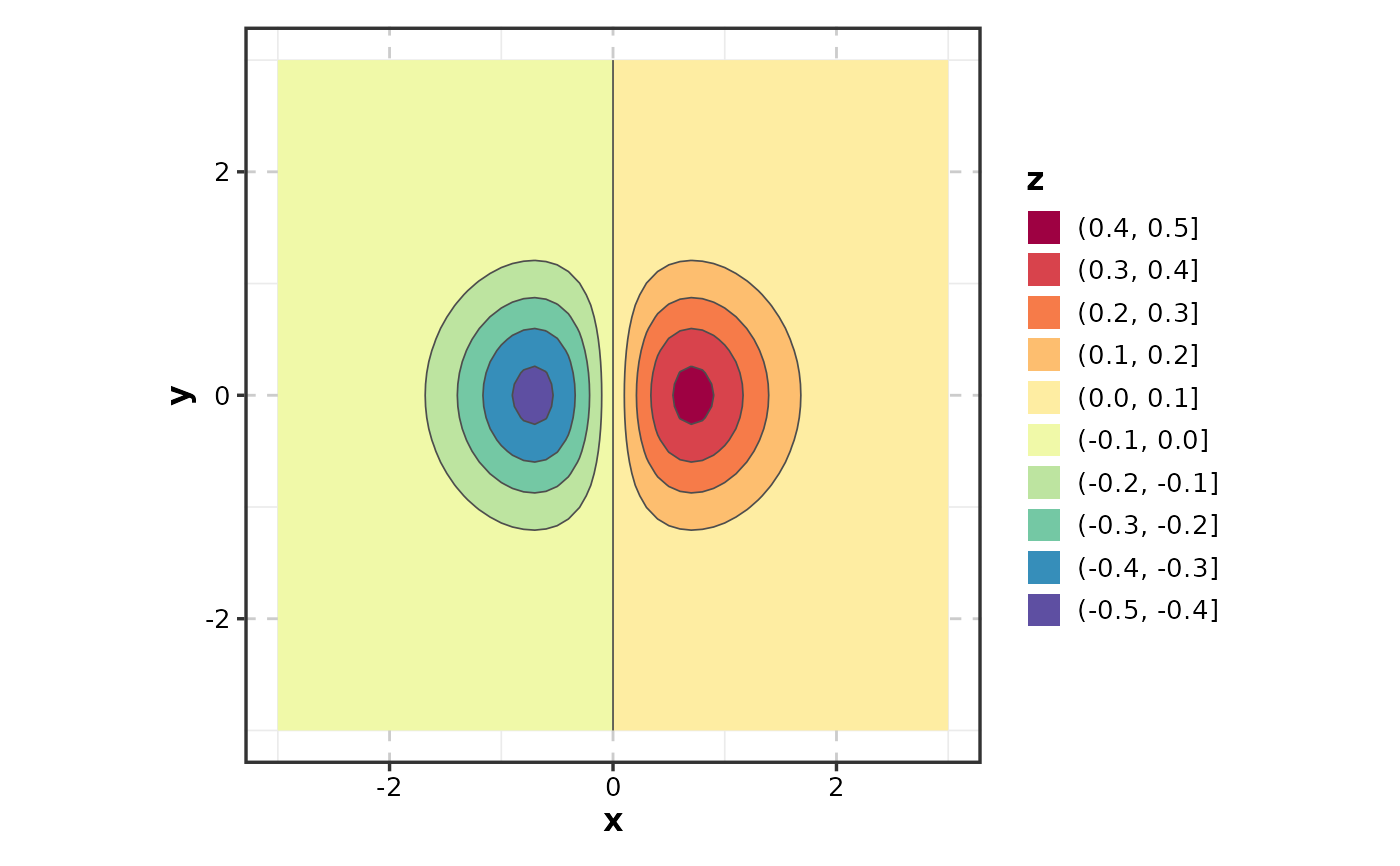
grid <- expand.grid(x = seq(-3, 3, 0.1), y = seq(-3, 3, 0.1))
grid$z <- with(grid, x * exp(-x^2 - y^2))
ContourPlot(grid, x = "x", y = "y", z = "z")
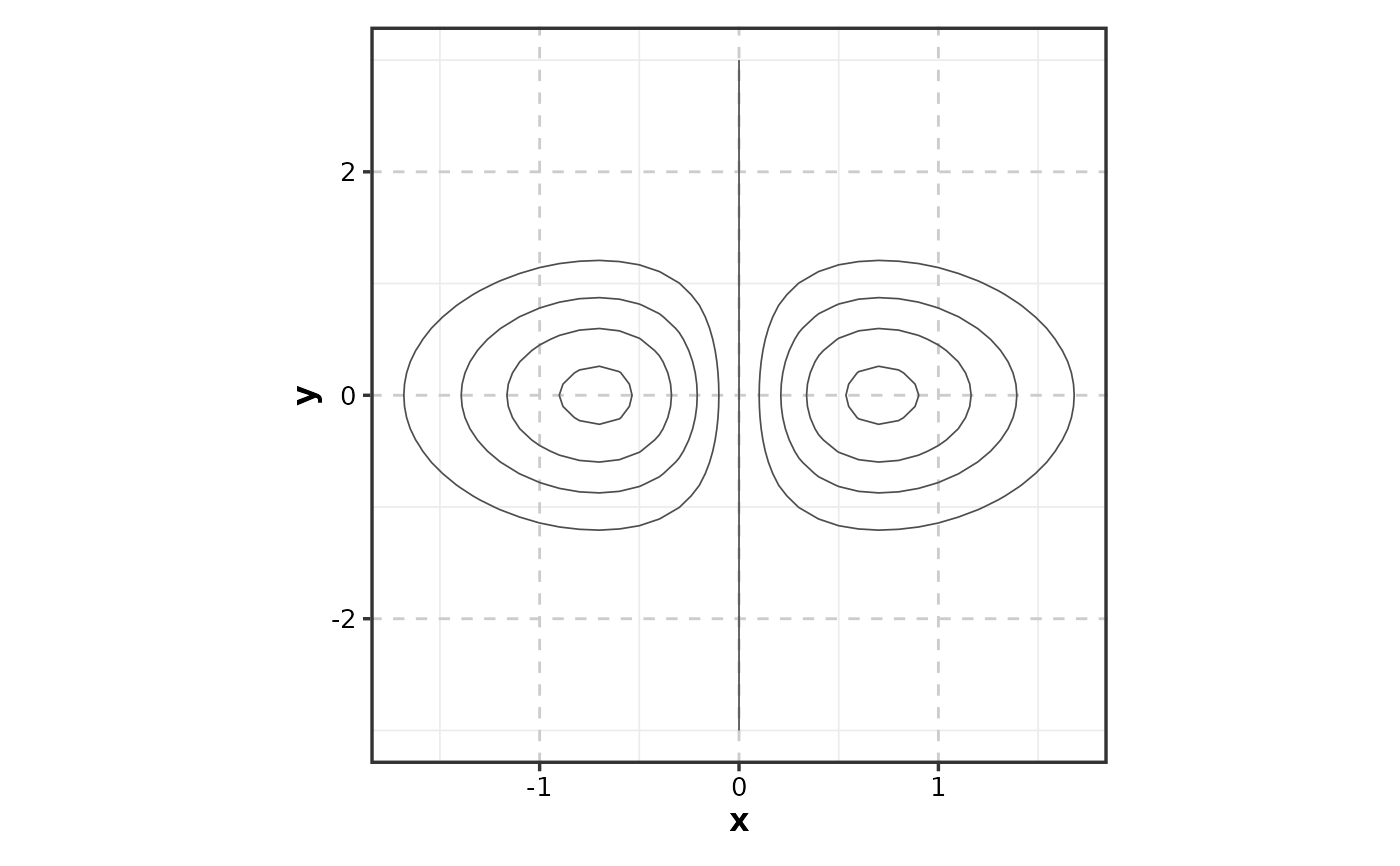
 ContourPlot(grid, x = "x", y = "y", z = "z", type = "lines")
 ContourPlot(grid, x = "x", y = "y", z = "z", type = "both")
 # }
# }