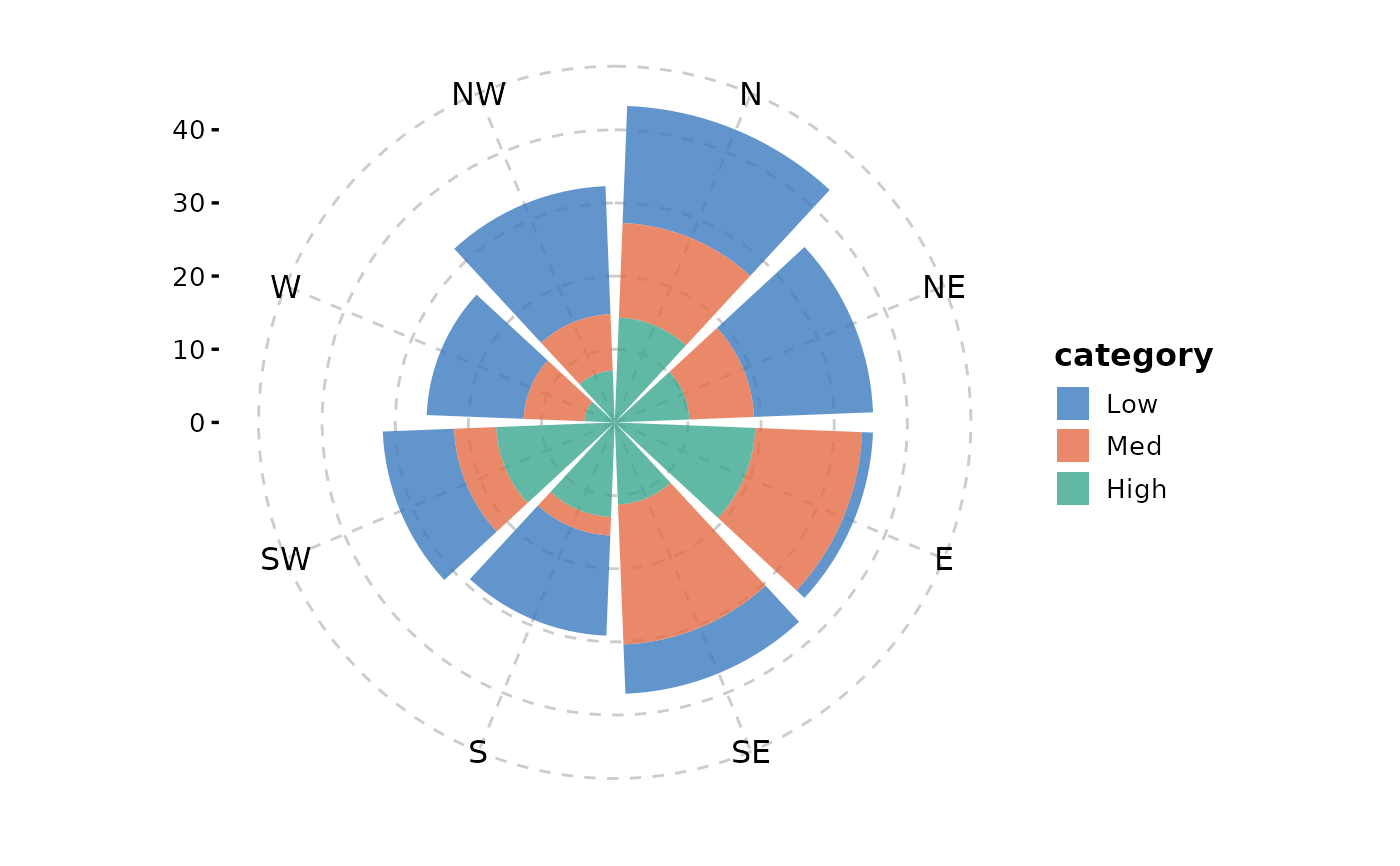
Creates polar coordinate plots for angular/directional data. Used in meteorology (wind roses), ecology (activity rhythms), chronobiology, and directional statistics.
Usage
PolarPlot(
  data,
  theta,
  r = NULL,
  group_by = NULL,
  group_by_sep = "_",
  group_name = NULL,
  type = c("bar", "line", "scatter"),
  start = 0,
  direction = 1,
  bar_width = 0.9,
  split_by = NULL,
  split_by_sep = "_",
  facet_by = NULL,
  facet_scales = "fixed",
  facet_nrow = NULL,
  facet_ncol = NULL,
  facet_byrow = TRUE,
  theme = "theme_ggforge",
  theme_args = list(),
  palette = "forge",
  palcolor = NULL,
  alpha = 0.8,
  aspect.ratio = NULL,
  legend.position = "right",
  legend.direction = "vertical",
  title = NULL,
  subtitle = NULL,
  xlab = NULL,
  ylab = NULL,
  seed = 8525,
  combine = TRUE,
  nrow = NULL,
  ncol = NULL,
  byrow = TRUE,
  axes = NULL,
  axis_titles = NULL,
  guides = NULL,
  design = NULL,
  ...
)

WindRosePlot(
  data,
  theta,
  r = NULL,
  group_by = NULL,
  group_by_sep = "_",
  group_name = NULL,
  type = c("bar", "line", "scatter"),
  start = 0,
  direction = 1,
  bar_width = 0.9,
  split_by = NULL,
  split_by_sep = "_",
  facet_by = NULL,
  facet_scales = "fixed",
  facet_nrow = NULL,
  facet_ncol = NULL,
  facet_byrow = TRUE,
  theme = "theme_ggforge",
  theme_args = list(),
  palette = "forge",
  palcolor = NULL,
  alpha = 0.8,
  aspect.ratio = NULL,
  legend.position = "right",
  legend.direction = "vertical",
  title = NULL,
  subtitle = NULL,
  xlab = NULL,
  ylab = NULL,
  seed = 8525,
  combine = TRUE,
  nrow = NULL,
  ncol = NULL,
  byrow = TRUE,
  axes = NULL,
  axis_titles = NULL,
  guides = NULL,
  design = NULL,
  ...
)
Arguments
- data
A data frame containing the data to plot
- theta
Column for angular variable (mapped to angle).
- r
Column for radial variable (numeric). If NULL, uses counts.
- group_by
Column for grouping.
- group_by_sep
Separator for multiple group_by columns.
- group_name
Legend title for groups.
- type
Plot type: "bar" (wind rose), "line", or "scatter".
- start
Offset for starting angle in radians.
- direction
Direction: 1 for counter-clockwise, -1 for clockwise.
- bar_width
Width of bars for type="bar".
- split_by
Column name(s) to split data into multiple plots
- split_by_sep
Separator when concatenating multiple split_by columns
- facet_by
Column name(s) for faceting the plot
- facet_scales
Scales for facets: "fixed", "free", "free_x", "free_y"
- facet_nrow
Number of rows in facet layout
- facet_ncol
Number of columns in facet layout
- facet_byrow
Fill facets by row (TRUE) or column (FALSE)
- theme
Theme name (string) or theme function
- theme_args
List of arguments passed to theme function
- palette
Color palette name
- palcolor
Custom colors for palette
- alpha
Transparency level (0-1)
- aspect.ratio
Aspect ratio of plot panel
- legend.position
Legend position: "none", "left", "right", "bottom", "top"
- legend.direction
Legend direction: "horizontal" or "vertical"
- title
Plot title
- subtitle
Plot subtitle
- xlab
X-axis label
- ylab
Y-axis label
- seed
Random seed for reproducibility
- combine
Whether to combine split plots into one
- nrow
Number of rows when combining plots
- ncol
Number of columns when combining plots
- byrow
Fill combined plots by row
- axes
How to handle axes in combined plots ("keep", "collect", "collect_x", "collect_y")
- axis_titles
How to handle axis titles in combined plots
- guides
How to handle guides in combined plots ("collect", "keep", "auto")
- design
Custom layout design for combined plots
- ...
Additional arguments passed to atomic plotting functions.
See also
Other earth-environmental-plots:
ContourPlot(),
MapPlot(),
TernaryPlot()