Creates ternary (simplex/triangle) diagrams for three-component compositional data. Common in chemistry (phase diagrams), geology (rock classification), materials science, and soil science. Requires the ggtern package.
Usage
TernaryPlot(
  data,
  a,
  b,
  c,
  group_by = NULL,
  group_by_sep = "_",
  group_name = NULL,
  type = c("scatter", "density", "hex"),
  pt_size = 3,
  pt_alpha = 0.8,
  add_density = FALSE,
  density_color = "grey40",
  split_by = NULL,
  split_by_sep = "_",
  theme = "theme_ggforge",
  theme_args = list(),
  palette = "forge",
  palcolor = NULL,
  alpha = 1,
  aspect.ratio = NULL,
  legend.position = "right",
  legend.direction = "vertical",
  title = NULL,
  subtitle = NULL,
  xlab = NULL,
  ylab = NULL,
  zlab = NULL,
  seed = 8525,
  combine = TRUE,
  nrow = NULL,
  ncol = NULL,
  byrow = TRUE,
  axes = NULL,
  axis_titles = NULL,
  guides = NULL,
  design = NULL,
  ...
)
Arguments
- data
A data frame containing the data to plot
- a, b, c
Column names for the three components (must sum to a constant per row).
- group_by
Column name for categorical grouping.
- group_by_sep
Separator for multiple group_by columns.
- group_name
Legend title for groups.
- type
Plot type: "scatter", "density", or "hex".
- pt_size
Point size.
- pt_alpha
Point transparency.
- add_density
Whether to overlay density contours.
- density_color
Color for density contour lines.
- split_by
Column name(s) to split data into multiple plots
- split_by_sep
Separator when concatenating multiple split_by columns
- theme
Theme name (string) or theme function
- theme_args
List of arguments passed to theme function
- palette
Color palette name
- palcolor
Custom colors for palette
- alpha
Transparency level (0-1)
- aspect.ratio
Aspect ratio of plot panel
- legend.position
Legend position: "none", "left", "right", "bottom", "top"
- legend.direction
Legend direction: "horizontal" or "vertical"
- title
Plot title
- subtitle
Plot subtitle
- xlab
X-axis label
- ylab
Y-axis label
- zlab
Z-axis label (for 3D and ternary plots)
- seed
Random seed for reproducibility
- combine
Whether to combine split plots into one
- nrow
Number of rows when combining plots
- ncol
Number of columns when combining plots
- byrow
Fill combined plots by row
- axes
How to handle axes in combined plots ("keep", "collect", "collect_x", "collect_y")
- axis_titles
How to handle axis titles in combined plots
- guides
How to handle guides in combined plots ("collect", "keep", "auto")
- design
Custom layout design for combined plots
- ...
Additional arguments passed to atomic plotting functions.
See also
Other earth-environmental-plots:
ContourPlot(),
MapPlot(),
PolarPlot()
Examples
# \donttest{
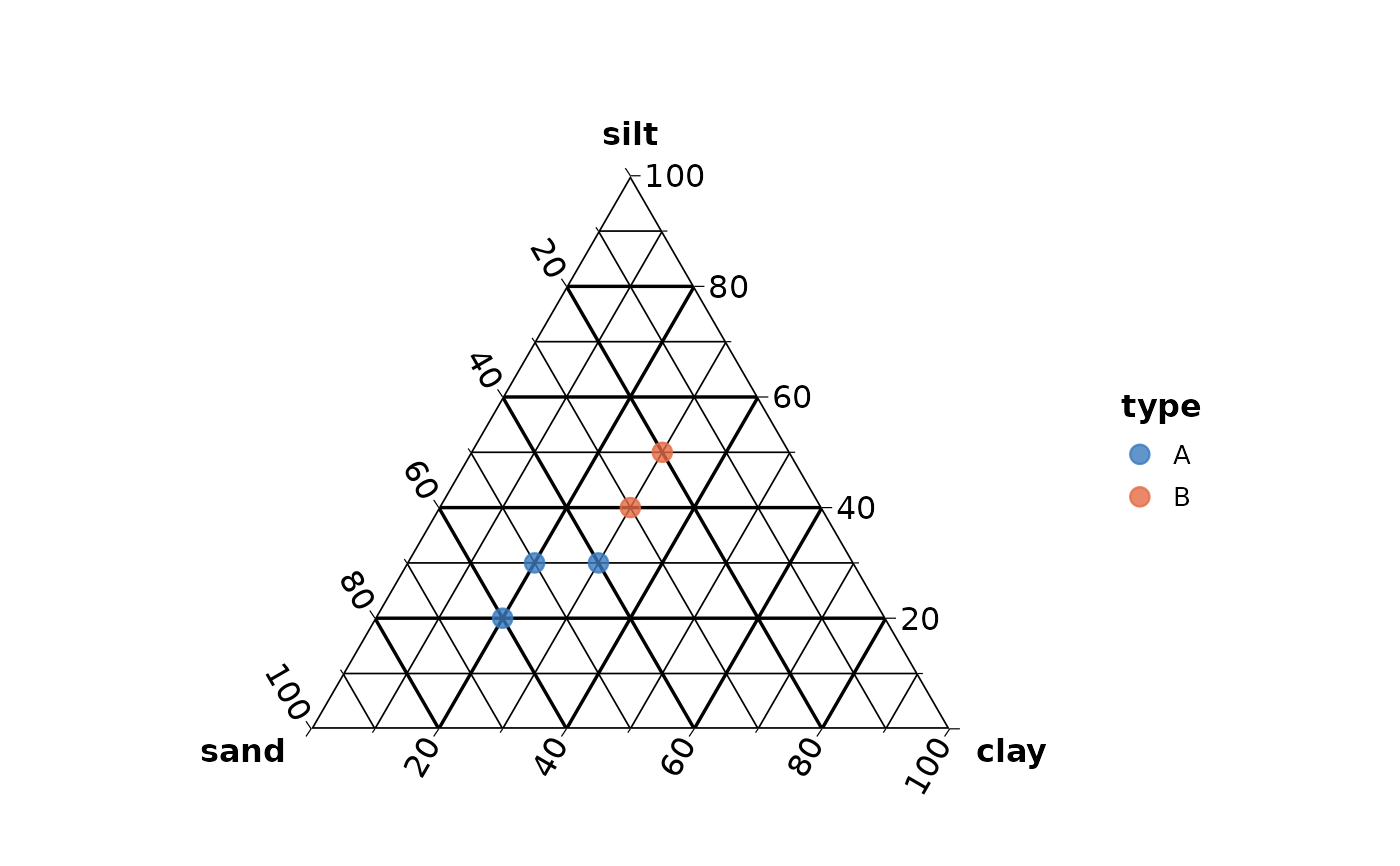
data <- data.frame(
sand = c(40, 20, 60, 30, 50),
silt = c(30, 50, 20, 40, 30),
clay = c(30, 30, 20, 30, 20),
type = c("A", "B", "A", "B", "A")
)
TernaryPlot(data, a = "sand", b = "silt", c = "clay", group_by = "type")
 # }
# }