Generate scatter correlation plot for two variables with optional linear regression line, annotations, and highlighting.
Usage
CorPlot(
  data,
  x,
  y,
  group_by = NULL,
  group_by_sep = "_",
  group_name = NULL,
  split_by = NULL,
  split_by_sep = "_",
  pt_size = 2,
  pt_shape = 16,
  raster = FALSE,
  alpha = 1,
  raster_dpi = c(512, 512),
  highlight = NULL,
  highlight_color = "black",
  highlight_size = 1,
  highlight_alpha = 1,
  highlight_stroke = 0.8,
  anno_items = c("n", "p", "pearson"),
  anno_size = 3.5,
  anno_fg = "black",
  anno_bg = "white",
  anno_bg_r = 0.1,
  anno_position = "auto",
  add_smooth = TRUE,
  smooth_color = "red2",
  smooth_width = 1.5,
  smooth_se = FALSE,
  theme = "theme_ggforge",
  theme_args = list(),
  palette = "forge",
  palcolor = NULL,
  facet_by = NULL,
  facet_scales = "fixed",
  facet_ncol = NULL,
  facet_nrow = NULL,
  facet_byrow = TRUE,
  aspect.ratio = NULL,
  legend.position = "right",
  legend.direction = "vertical",
  title = NULL,
  subtitle = NULL,
  xlab = NULL,
  ylab = NULL,
  seed = 8525,
  combine = TRUE,
  nrow = NULL,
  ncol = NULL,
  byrow = TRUE,
  axes = NULL,
  axis_titles = NULL,
  guides = NULL,
  design = NULL,
  ...
)
Arguments
- data
A data frame containing the data to plot
- x
Column name for x-axis variable
- y
Column name for y-axis variable
- group_by
Column name(s) for grouping data
- group_by_sep
Separator when concatenating multiple group_by columns
- group_name
Name for the group legend
- split_by
Column name(s) to split data into multiple plots
- split_by_sep
Separator when concatenating multiple split_by columns
- pt_size
Size of the points
- pt_shape
Shape of the points (0-25)
- raster
Whether to use raster graphics (faster for large datasets)
- alpha
Transparency level (0-1)
- raster_dpi
DPI for raster graphics as c(width, height)
- highlight
Items to highlight. Can be:
A vector of row indices
A vector of rownames
An expression to filter (e.g., "Species == 'setosa'")
- highlight_color
Color for highlighted points
- highlight_size
Size for highlighted points
- highlight_alpha
Alpha for highlighted points
- highlight_stroke
Stroke width for highlighted points
- anno_items
Annotation items to display. Options: "eq", "r2", "p", "spearman", "pearson", "kendall", "n"
- anno_size
Size of annotation text
- anno_fg
Foreground color of annotation text
- anno_bg
Background color of annotation text
- anno_bg_r
Radius of annotation background
- anno_position
Position of annotations. Options: "auto", "topleft", "topright", "bottomleft", "bottomright" (or shortcuts: "tl", "tr", "bl", "br")
- add_smooth
Whether to add linear regression line
- smooth_color
Color of regression line
- smooth_width
Width of regression line
- smooth_se
Whether to show standard error band
- theme
Theme name (string) or theme function
- theme_args
List of arguments passed to theme function
- palette
Color palette name
- palcolor
Custom colors for palette
- facet_by
Column name(s) for faceting the plot
- facet_scales
Scales for facets: "fixed", "free", "free_x", "free_y"
- facet_ncol
Number of columns in facet layout
- facet_nrow
Number of rows in facet layout
- facet_byrow
Fill facets by row (TRUE) or column (FALSE)
- aspect.ratio
Aspect ratio of plot panel
- legend.position
Legend position: "none", "left", "right", "bottom", "top"
- legend.direction
Legend direction: "horizontal" or "vertical"
- title
Plot title
- subtitle
Plot subtitle
- xlab
X-axis label
- ylab
Y-axis label
- seed
Random seed for reproducibility
- combine
Whether to combine split plots into one
- nrow
Number of rows when combining plots
- ncol
Number of columns when combining plots
- byrow
Fill combined plots by row
- axes
How to handle axes in combined plots ("keep", "collect", "collect_x", "collect_y")
- axis_titles
How to handle axis titles in combined plots
- guides
How to handle guides in combined plots ("collect", "keep", "auto")
- design
Custom layout design for combined plots
- ...
Additional arguments passed to atomic plotting functions.
See also
Other network-plots:
ChordPlot(),
CorPairsPlot(),
Network(),
SankeyPlot()
Examples
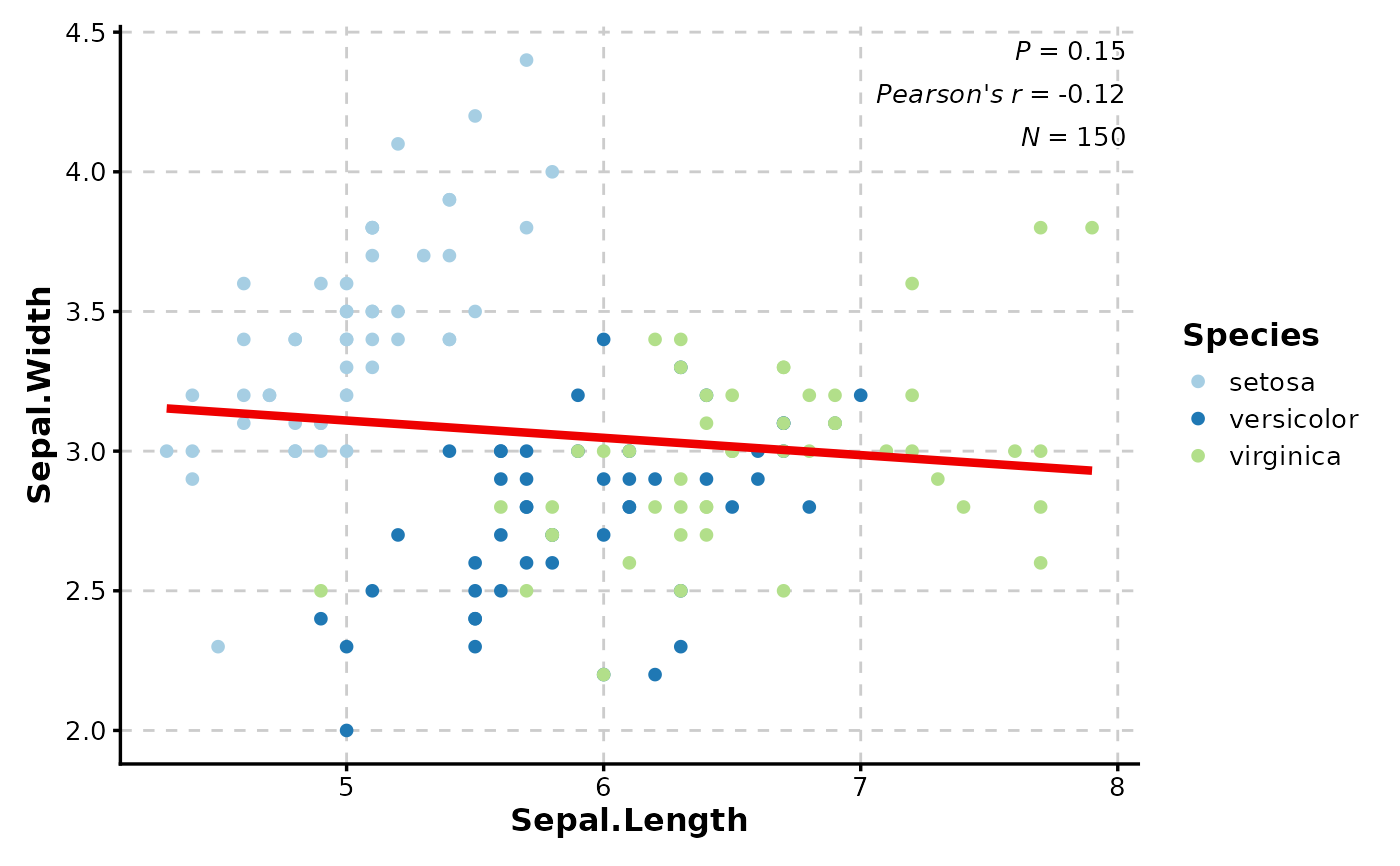
# Basic correlation plot with grouping
data(iris)
CorPlot(iris, x = "Sepal.Length", y = "Sepal.Width", group_by = "Species")
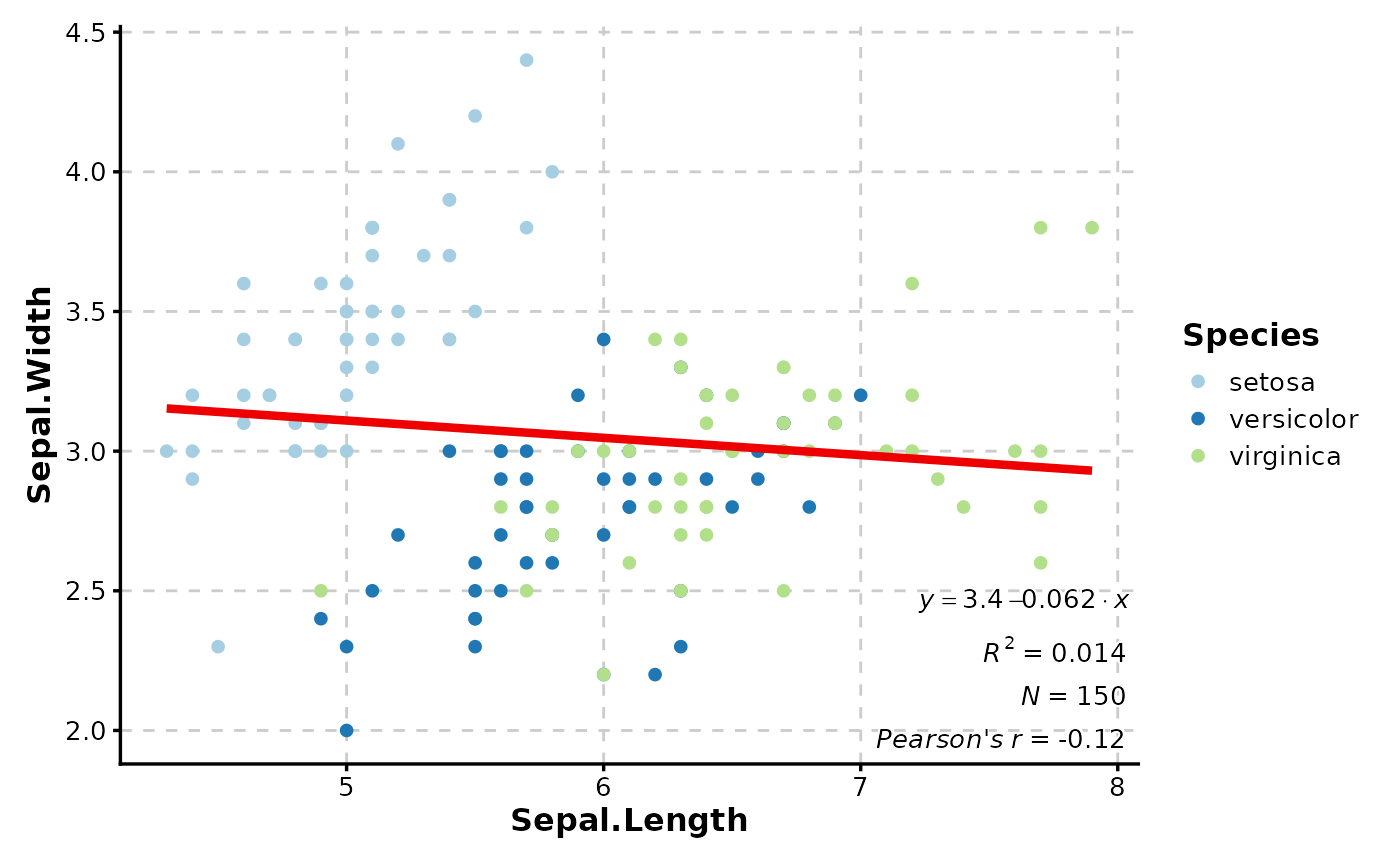
 # With custom annotations and positioning
CorPlot(iris,
x = "Sepal.Length", y = "Sepal.Width",
group_by = "Species",
anno_items = c("n", "eq", "r2", "pearson"),
anno_position = "bottomright"
)
# With custom annotations and positioning
CorPlot(iris,
x = "Sepal.Length", y = "Sepal.Width",
group_by = "Species",
anno_items = c("n", "eq", "r2", "pearson"),
anno_position = "bottomright"
)
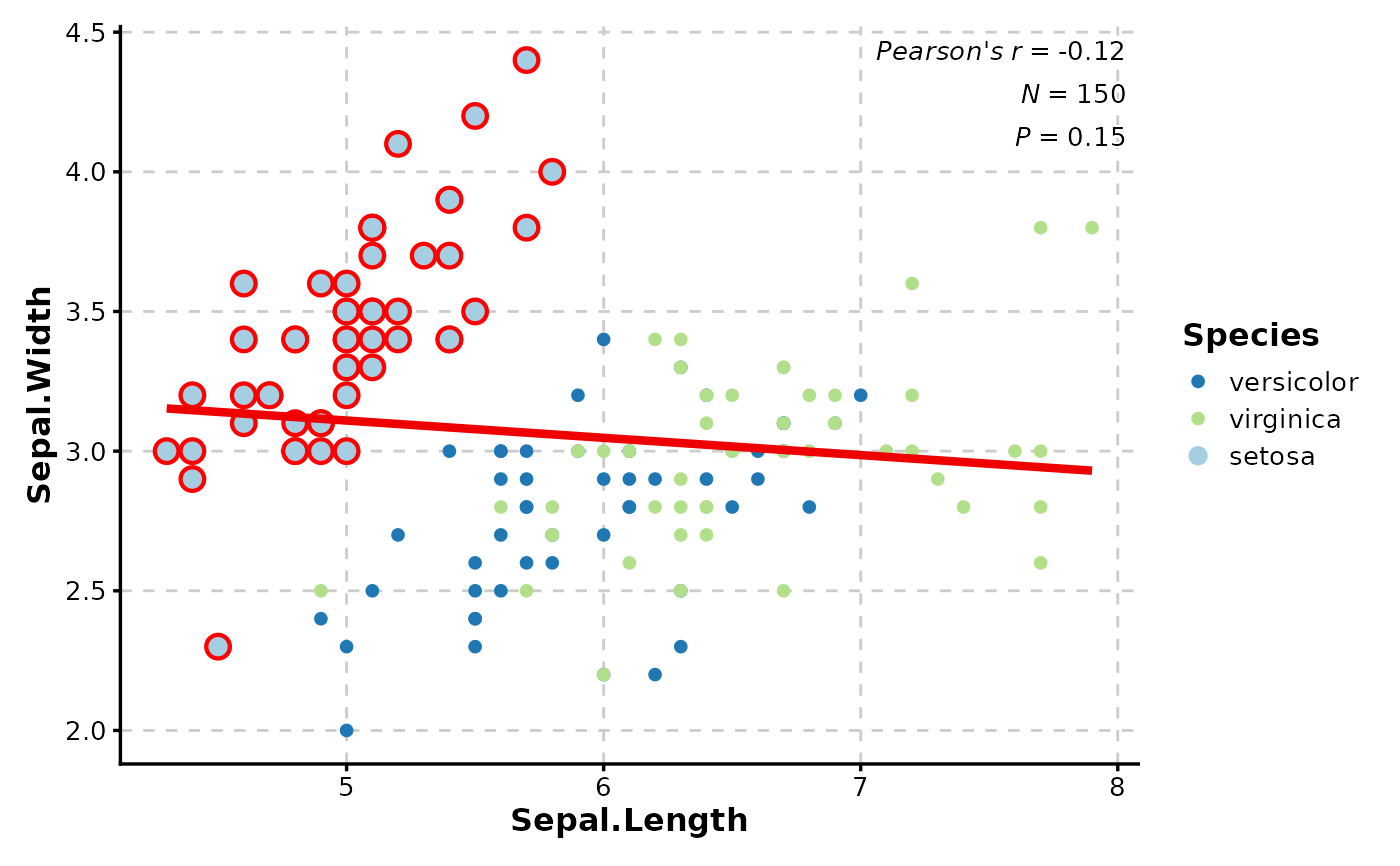
 # With highlighting specific points
CorPlot(iris,
x = "Sepal.Length", y = "Sepal.Width",
group_by = "Species",
highlight = 'Species == "setosa"',
highlight_color = "red",
highlight_size = 3,
highlight_stroke = 1.5
)
# With highlighting specific points
CorPlot(iris,
x = "Sepal.Length", y = "Sepal.Width",
group_by = "Species",
highlight = 'Species == "setosa"',
highlight_color = "red",
highlight_size = 3,
highlight_stroke = 1.5
)
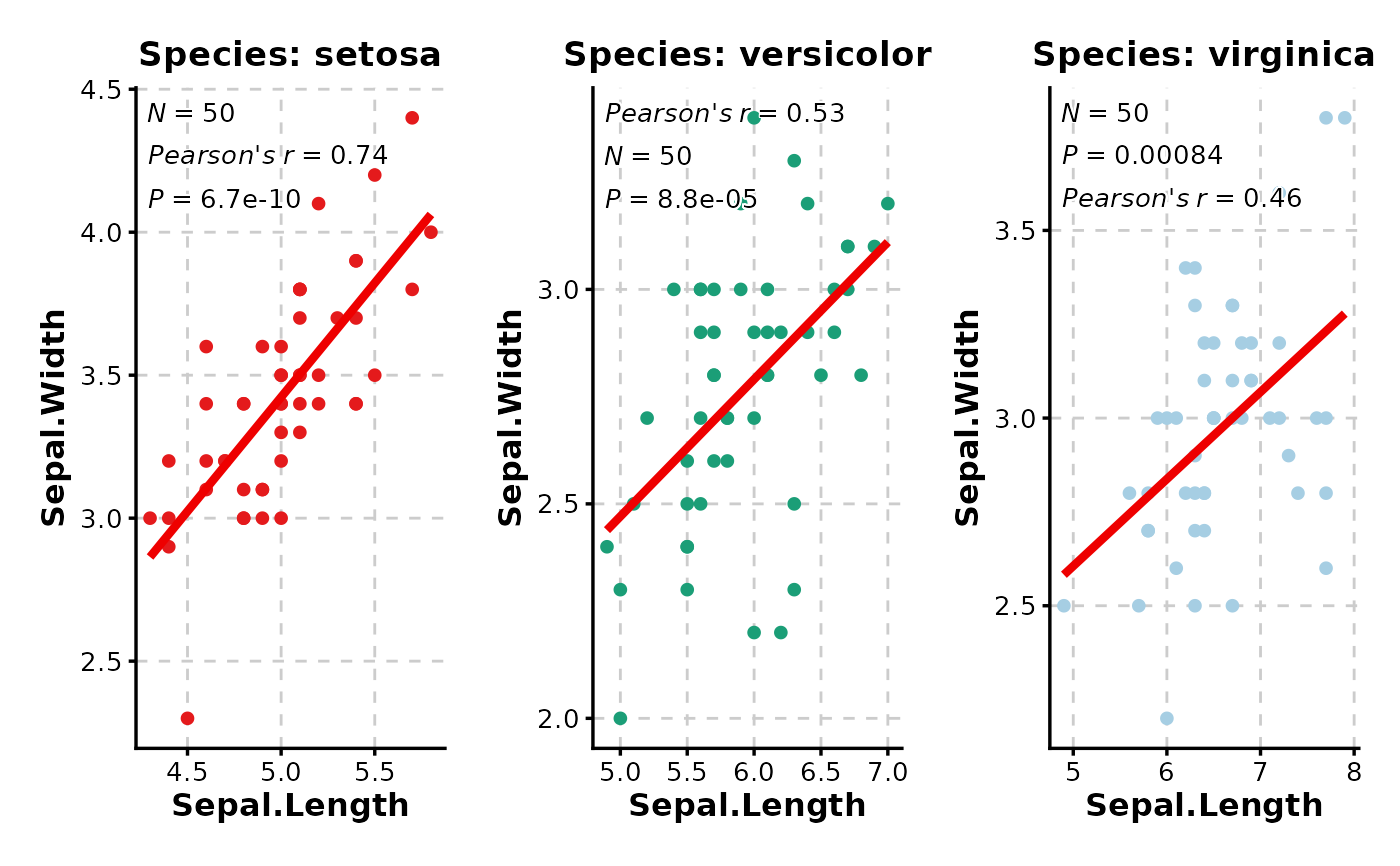
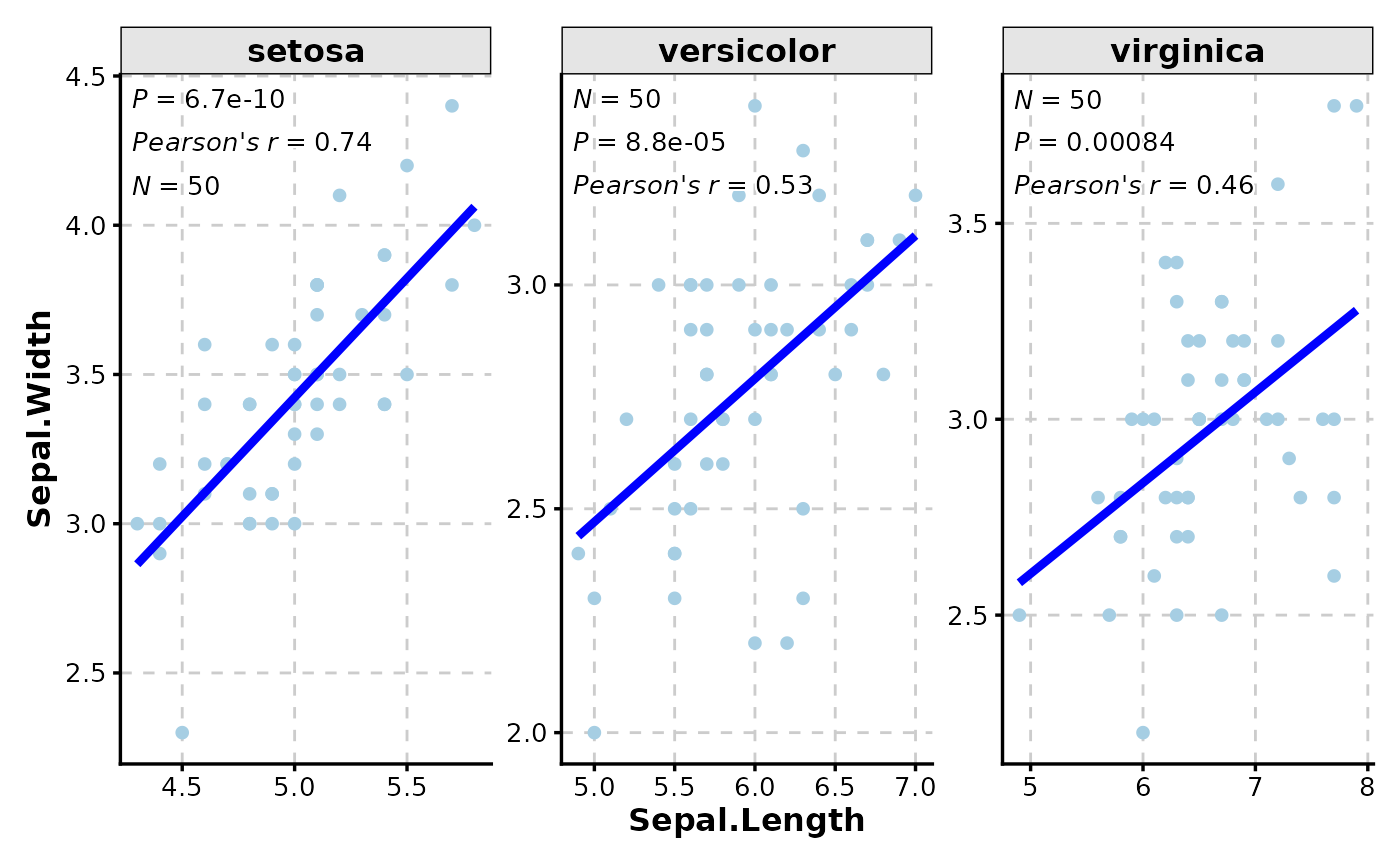
 # With faceting by groups
CorPlot(iris,
x = "Sepal.Length", y = "Sepal.Width",
facet_by = "Species",
facet_scales = "free",
add_smooth = TRUE,
smooth_color = "blue"
)
# With faceting by groups
CorPlot(iris,
x = "Sepal.Length", y = "Sepal.Width",
facet_by = "Species",
facet_scales = "free",
add_smooth = TRUE,
smooth_color = "blue"
)
 # With splitting and custom palettes
CorPlot(iris,
x = "Sepal.Length", y = "Sepal.Width",
split_by = "Species",
palette = c(setosa = "Set1", versicolor = "Dark2", virginica = "Paired"),
combine = TRUE
)
# With splitting and custom palettes
CorPlot(iris,
x = "Sepal.Length", y = "Sepal.Width",
split_by = "Species",
palette = c(setosa = "Set1", versicolor = "Dark2", virginica = "Paired"),
combine = TRUE
)