Visualize network graphs with nodes and links using igraph layouts and ggraph. Supports directed and undirected graphs, customizable node and link aesthetics, clustering, and various layout algorithms.
Usage
Network(
  links,
  nodes = NULL,
  split_by = NULL,
  split_by_sep = "_",
  split_nodes = FALSE,
  from = NULL,
  from_sep = "_",
  to = NULL,
  to_sep = "_",
  node_by = NULL,
  node_by_sep = "_",
  link_weight_by = 0.8,
  link_weight_name = NULL,
  link_type_by = "solid",
  link_type_name = NULL,
  node_size_by = 8,
  node_size_name = NULL,
  node_color_by = "grey50",
  node_color_name = NULL,
  node_shape_by = 21,
  node_shape_name = NULL,
  node_fill_by = "grey70",
  node_fill_name = NULL,
  link_alpha = 0.6,
  node_alpha = 0.95,
  node_stroke = 0.6,
  cluster_scale = c("fill", "color", "shape"),
  node_size_range = c(3, 12),
  link_weight_range = c(0.3, 2.5),
  link_arrow_offset = 20,
  link_curvature = 0,
  link_color_by = "from",
  link_color_name = NULL,
  palette = "forge",
  palcolor = NULL,
  link_palette = ifelse(link_color_by %in% c("from", "to"), palette, "Set1"),
  link_palcolor = if (link_color_by %in% c("from", "to")) palcolor else NULL,
  directed = TRUE,
  layout = "circle",
  cluster = "none",
  add_mark = FALSE,
  mark_expand = ggplot2::unit(10, "mm"),
  mark_type = c("hull", "ellipse", "rect", "circle"),
  mark_alpha = 0.1,
  mark_linetype = 1,
  add_label = TRUE,
  label_size = 3,
  label_fg = "white",
  label_bg = "black",
  label_bg_r = 0.1,
  arrow = ggplot2::arrow(type = "closed", length = ggplot2::unit(0.1, "inches")),
  title = NULL,
  subtitle = NULL,
  xlab = NULL,
  ylab = NULL,
  aspect.ratio = NULL,
  theme = "theme_ggforge",
  theme_args = list(),
  legend.position = "right",
  legend.direction = "vertical",
  seed = 8525,
  combine = TRUE,
  nrow = NULL,
  ncol = NULL,
  byrow = TRUE,
  axes = NULL,
  axis_titles = NULL,
  guides = NULL,
  design = NULL,
  ...
)
Arguments
- links
A data frame containing the links between nodes.
- nodes
A data frame containing the nodes (optional). Node names are extracted from the links data frame if not provided. If
"@nodes"is provided, the nodes data frame will be extracted from thenodesattribute of the links data frame.- split_by
Column name(s) to split data into multiple plots
- split_by_sep
Separator when concatenating multiple split_by columns
- split_nodes
Whether to split nodes data when splitting by a column.
- from
Column name(s) for source nodes. Default is the first column.
- from_sep
Separator for concatenating multiple
fromcolumns.- to
Column name(s) for target nodes. Default is the second column.
- to_sep
Separator for concatenating multiple
tocolumns.- node_by
Column name(s) for node identifiers. Default is the first column.
- node_by_sep
Separator for concatenating multiple
node_bycolumns.- link_weight_by
Numeric value or column name for link width.
- link_weight_name
Legend title for link weight.
- link_type_by
Link line type: "solid", "dashed", "dotted", or a column name.
- link_type_name
Legend title for link type.
- node_size_by
Numeric value or column name for node size.
- node_size_name
Legend title for node size.
- node_color_by
Color value or column name for node color (border).
- node_color_name
Legend title for node color.
- node_shape_by
Numeric value or column name for node shape.
- node_shape_name
Legend title for node shape.
- node_fill_by
Fill color value or column name for node fill.
- node_fill_name
Legend title for node fill.
- link_alpha
Transparency for links (0-1).
- node_alpha
Transparency for node fill (0-1).
- node_stroke
Width of node borders.
- cluster_scale
Which aesthetic to use for clusters: "fill", "color", or "shape".
- node_size_range
Range for node sizes.
- link_weight_range
Range for link widths.
- link_arrow_offset
Offset for link arrows to avoid overlapping nodes.
- link_curvature
Curvature of links (0 = straight).
- link_color_by
Link coloring: "from", "to", or a column name.
- link_color_name
Legend title for link color.
- palette
Color palette name
- palcolor
Custom colors for palette
- link_palette
Palette for link colors.
- link_palcolor
Custom colors for link palette.
- directed
Whether the graph is directed.
- layout
Layout algorithm: "circle", "tree", "grid", or an igraph layout name.
- cluster
Clustering method: "none", "fast_greedy", "walktrap", "edge_betweenness", "infomap", or an igraph clustering function.
- add_mark
Whether to add visual marks around clusters.
- mark_expand
Expansion of cluster marks.
- mark_type
Type of cluster marks: "hull", "ellipse", "rect", or "circle".
- mark_alpha
Transparency of cluster marks.
- mark_linetype
Line type of cluster marks.
- add_label
Whether to add labels to nodes.
- label_size
Size of node labels.
- label_fg
Foreground color of labels.
- label_bg
Background color of labels.
- label_bg_r
Background ratio for labels.
- arrow
Arrow specification for directed graphs.
- title
Plot title
- subtitle
Plot subtitle
- xlab
X-axis label
- ylab
Y-axis label
- aspect.ratio
Aspect ratio of plot panel
- theme
Theme name (string) or theme function
- theme_args
List of arguments passed to theme function
- legend.position
Legend position: "none", "left", "right", "bottom", "top"
- legend.direction
Legend direction: "horizontal" or "vertical"
- seed
Random seed for reproducibility
- combine
Whether to combine split plots into one
- nrow
Number of rows when combining plots
- ncol
Number of columns when combining plots
- byrow
Fill combined plots by row
- axes
How to handle axes in combined plots ("keep", "collect", "collect_x", "collect_y")
- axis_titles
How to handle axis titles in combined plots
- guides
How to handle guides in combined plots ("collect", "keep", "auto")
- design
Custom layout design for combined plots
- ...
Additional arguments passed to atomic plotting functions.
See also
Other network-plots:
ChordPlot(),
CorPairsPlot(),
CorPlot(),
SankeyPlot()
Examples
# \donttest{
actors <- data.frame(
name = c("Alice", "Bob", "Cecil", "David", "Esmeralda"),
age = c(48, 33, 45, 34, 21),
shape = c(21, 22, 21, 22, 23),
gender = c("F", "M", "F", "M", "F")
)
relations <- data.frame(
from = c(
"Bob", "Cecil", "Cecil", "David", "David", "Esmeralda", "Bob", "Alice",
"Cecil", "David"
),
to = c(
"Alice", "Bob", "Alice", "Alice", "Bob", "Alice", "Bob", "Alice", "Cecil",
"David"
),
friendship = c(4, 5, 5, 2, 1, 1, 2, 1, 3, 4),
type = c(1, 1, 1, 1, 1, 2, 2, 2, 2, 2)
)
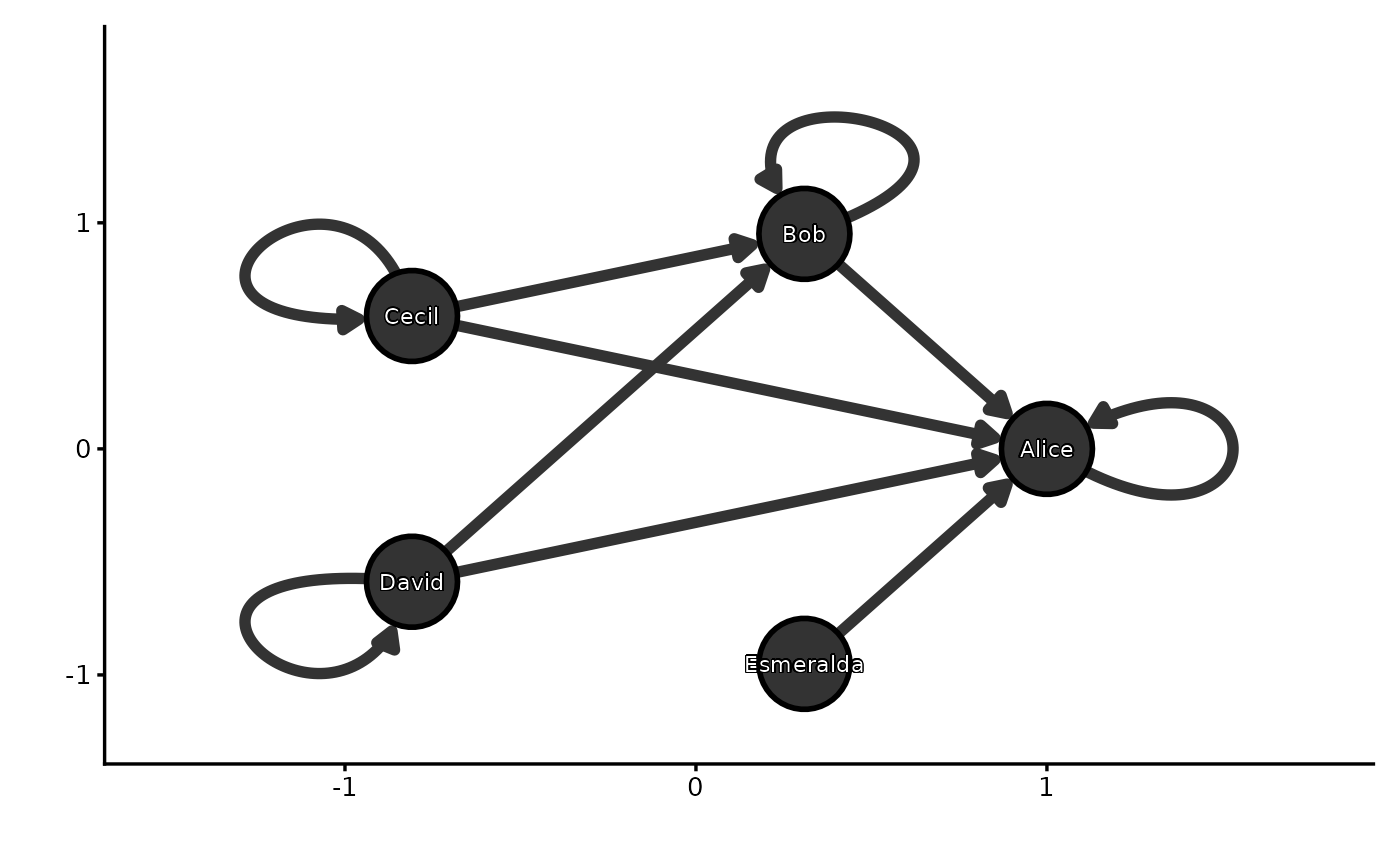
Network(relations, actors)
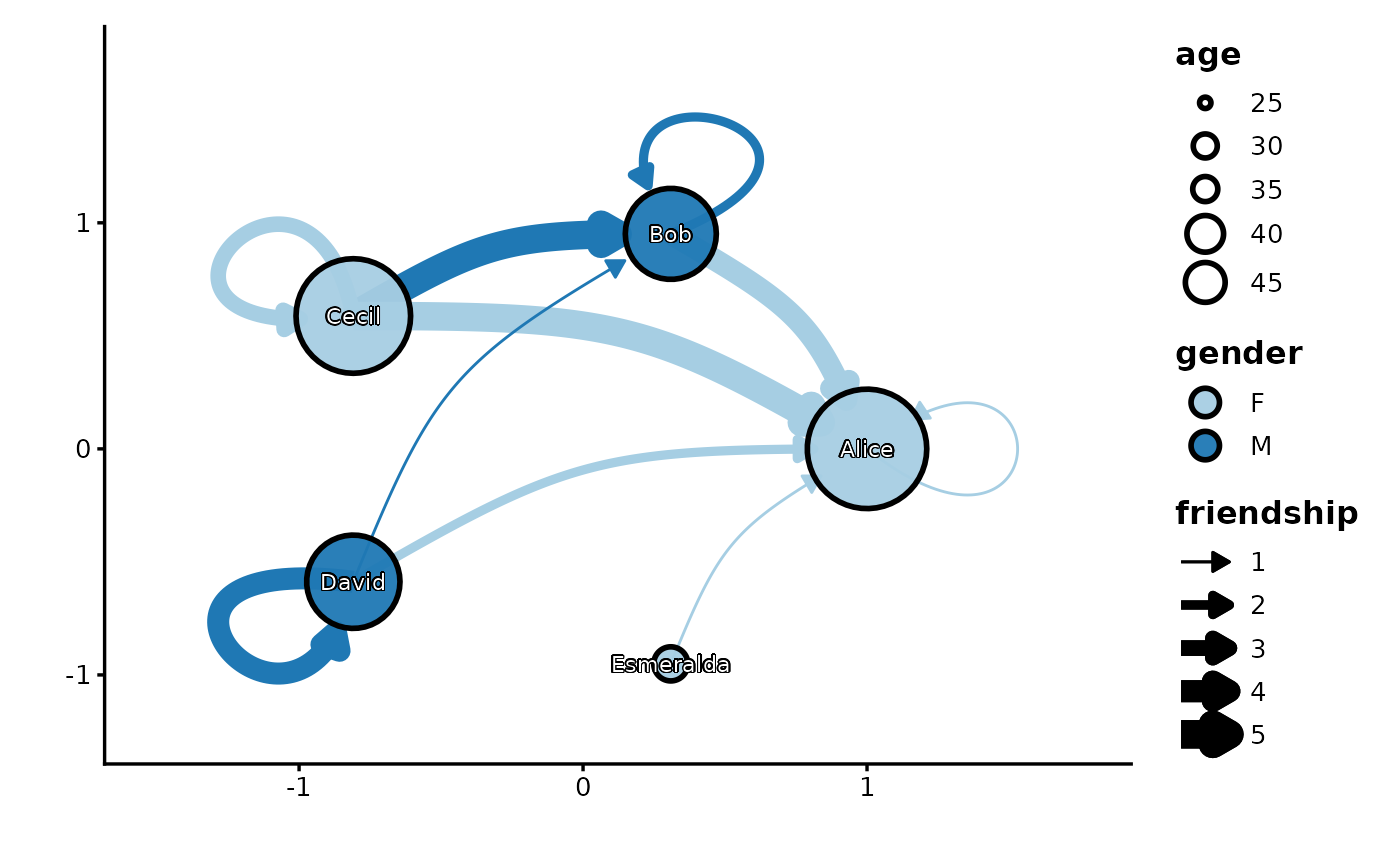
 Network(relations, actors,
link_weight_by = "friendship", node_size_by = "age",
node_fill_by = "gender", link_color_by = "to",
layout = "circle", link_curvature = 0.2
)
Network(relations, actors,
link_weight_by = "friendship", node_size_by = "age",
node_fill_by = "gender", link_color_by = "to",
layout = "circle", link_curvature = 0.2
)
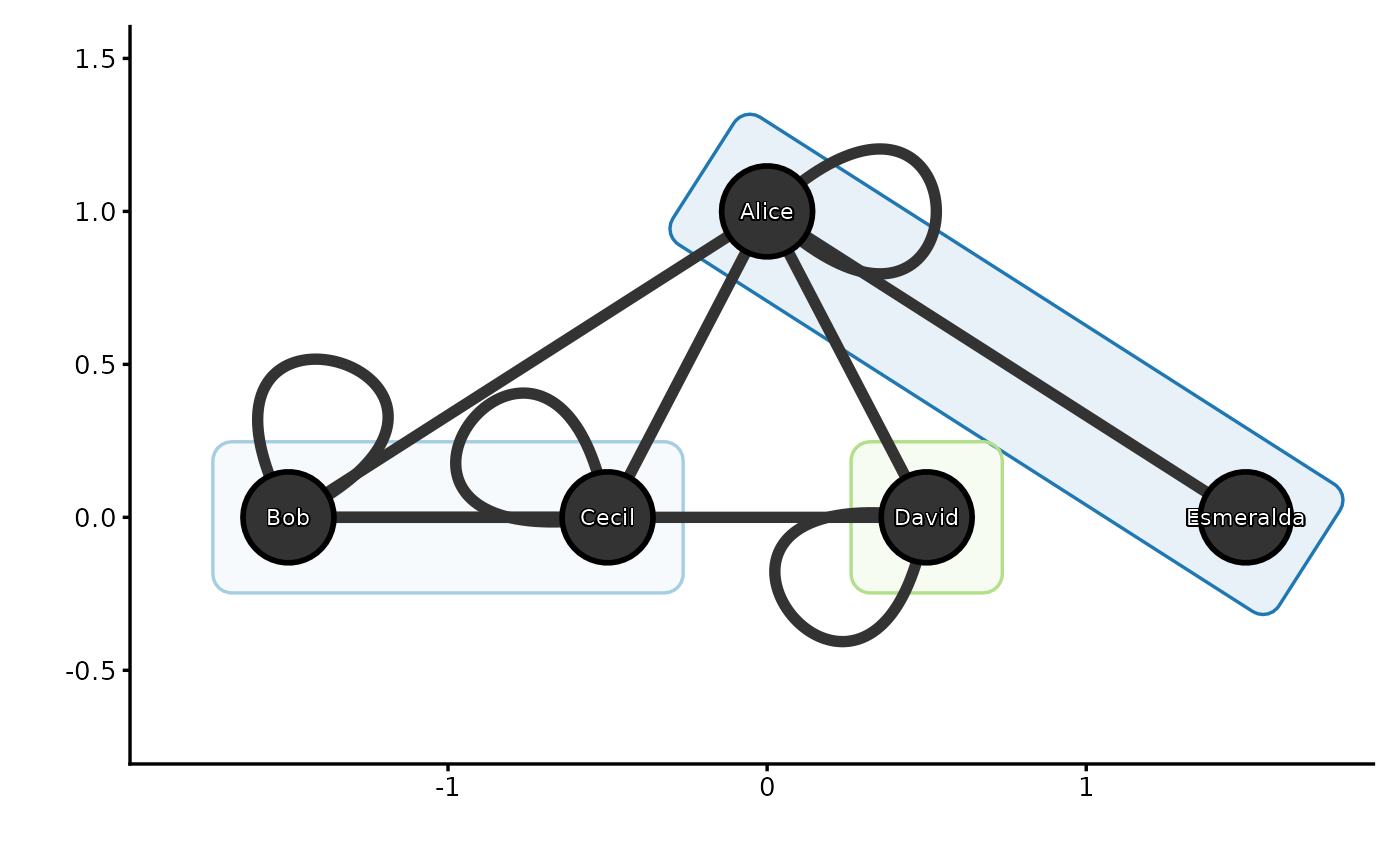
 Network(relations, actors,
layout = "tree", directed = FALSE, cluster = "fast_greedy",
add_mark = TRUE
)
#> Warning: `cluster_scale = 'fill'` overrides `node_fill_by` when `cluster` is enabled
Network(relations, actors,
layout = "tree", directed = FALSE, cluster = "fast_greedy",
add_mark = TRUE
)
#> Warning: `cluster_scale = 'fill'` overrides `node_fill_by` when `cluster` is enabled
 # }
# }