Creates a chord diagram to visualize relationships between two categorical variables using the circlize package. Chord diagrams are useful for displaying flows or connections between entities, with link width proportional to relationship strength.
CircosPlot is an alias of ChordPlot.
Usage
ChordPlot(
  data,
  y = NULL,
  from = NULL,
  from_sep = "_",
  to = NULL,
  to_sep = "_",
  split_by = NULL,
  split_by_sep = "_",
  flip = FALSE,
  links_color = c("from", "to"),
  theme = "theme_ggforge",
  theme_args = list(),
  palette = "forge",
  palcolor = NULL,
  alpha = 0.5,
  labels_rot = FALSE,
  title = NULL,
  subtitle = NULL,
  seed = 8525,
  combine = TRUE,
  nrow = NULL,
  ncol = NULL,
  byrow = TRUE,
  axes = NULL,
  axis_titles = NULL,
  guides = NULL,
  design = NULL,
  ...
)

CircosPlot(
  data,
  y = NULL,
  from = NULL,
  from_sep = "_",
  to = NULL,
  to_sep = "_",
  split_by = NULL,
  split_by_sep = "_",
  flip = FALSE,
  links_color = c("from", "to"),
  theme = "theme_ggforge",
  theme_args = list(),
  palette = "forge",
  palcolor = NULL,
  alpha = 0.5,
  labels_rot = FALSE,
  title = NULL,
  subtitle = NULL,
  seed = 8525,
  combine = TRUE,
  nrow = NULL,
  ncol = NULL,
  byrow = TRUE,
  axes = NULL,
  axis_titles = NULL,
  guides = NULL,
  design = NULL,
  ...
)
Arguments
- data
A data frame containing the data to plot
- y
Column name for relationship values. If NULL, counts relationships
- from
Column name(s) for source nodes. Multiple columns will be concatenated
- from_sep
Separator for concatenating multiple from columns (default: "_")
- to
Column name(s) for target nodes. Multiple columns will be concatenated
- to_sep
Separator for concatenating multiple to columns (default: "_")
- split_by
Column name(s) to split data into multiple plots
- split_by_sep
Separator when concatenating multiple split_by columns
- flip
Logical. Whether to flip source and target nodes (default: FALSE)
- links_color
Character. Color links by source ("from") or target ("to") nodes
- theme
Theme name (string) or theme function
- theme_args
List of arguments passed to theme function
- palette
Color palette name
- palcolor
Custom colors for palette
- alpha
Transparency level (0-1)
- labels_rot
Logical. Whether to rotate labels by 90 degrees (default: FALSE)
- title
Plot title
- subtitle
Plot subtitle
- seed
Random seed for reproducibility
- combine
Whether to combine split plots into one
- nrow
Number of rows when combining plots
- ncol
Number of columns when combining plots
- byrow
Fill combined plots by row
- axes
How to handle axes in combined plots ("keep", "collect", "collect_x", "collect_y")
- axis_titles
How to handle axis titles in combined plots
- guides
How to handle guides in combined plots ("collect", "keep", "auto")
- design
Custom layout design for combined plots
- ...
Additional arguments passed to circlize functions
Value
If combine = TRUE, returns a combined patchwork object.
If combine = FALSE, returns a list of individual chord diagrams.
See also
Other network-plots:
CorPairsPlot(),
CorPlot(),
Network(),
SankeyPlot()
Other specialized-plots:
BeeswarmPlot(),
ClustreePlot(),
DendrogramPlot(),
Heatmap(),
PieChart(),
RadarPlot(),
RarefactionPlot(),
RingPlot(),
SplitBarPlot(),
SunburstPlot(),
WordCloudPlot()
Examples
# \donttest{
set.seed(8525)
data <- data.frame(
nodes1 = sample(c("Source1", "Source2", "Source3"), 10, replace = TRUE),
nodes2 = sample(letters[1:3], 10, replace = TRUE),
y = sample(1:5, 10, replace = TRUE)
)
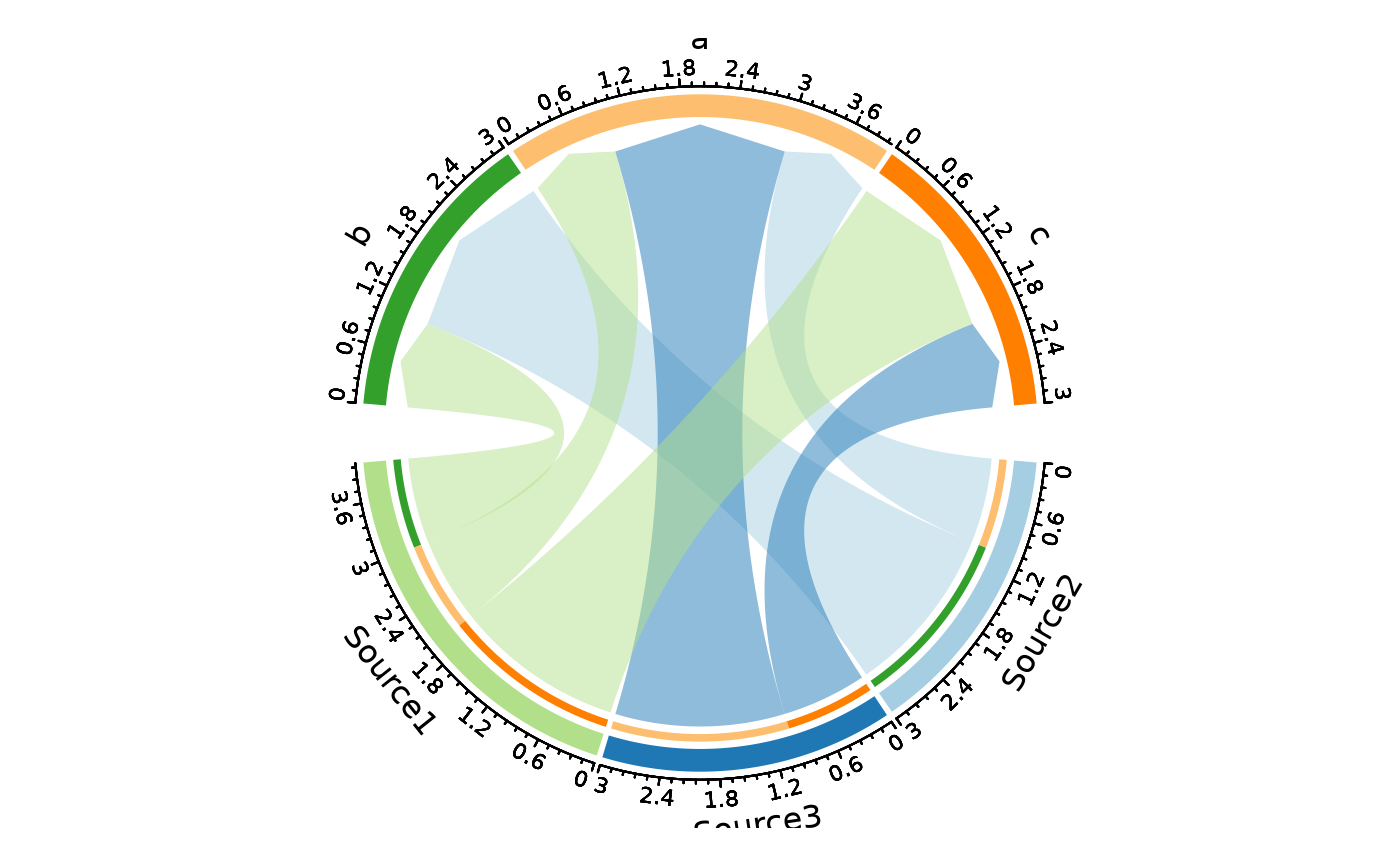
# Basic chord plot
ChordPlot(data, from = "nodes1", to = "nodes2")
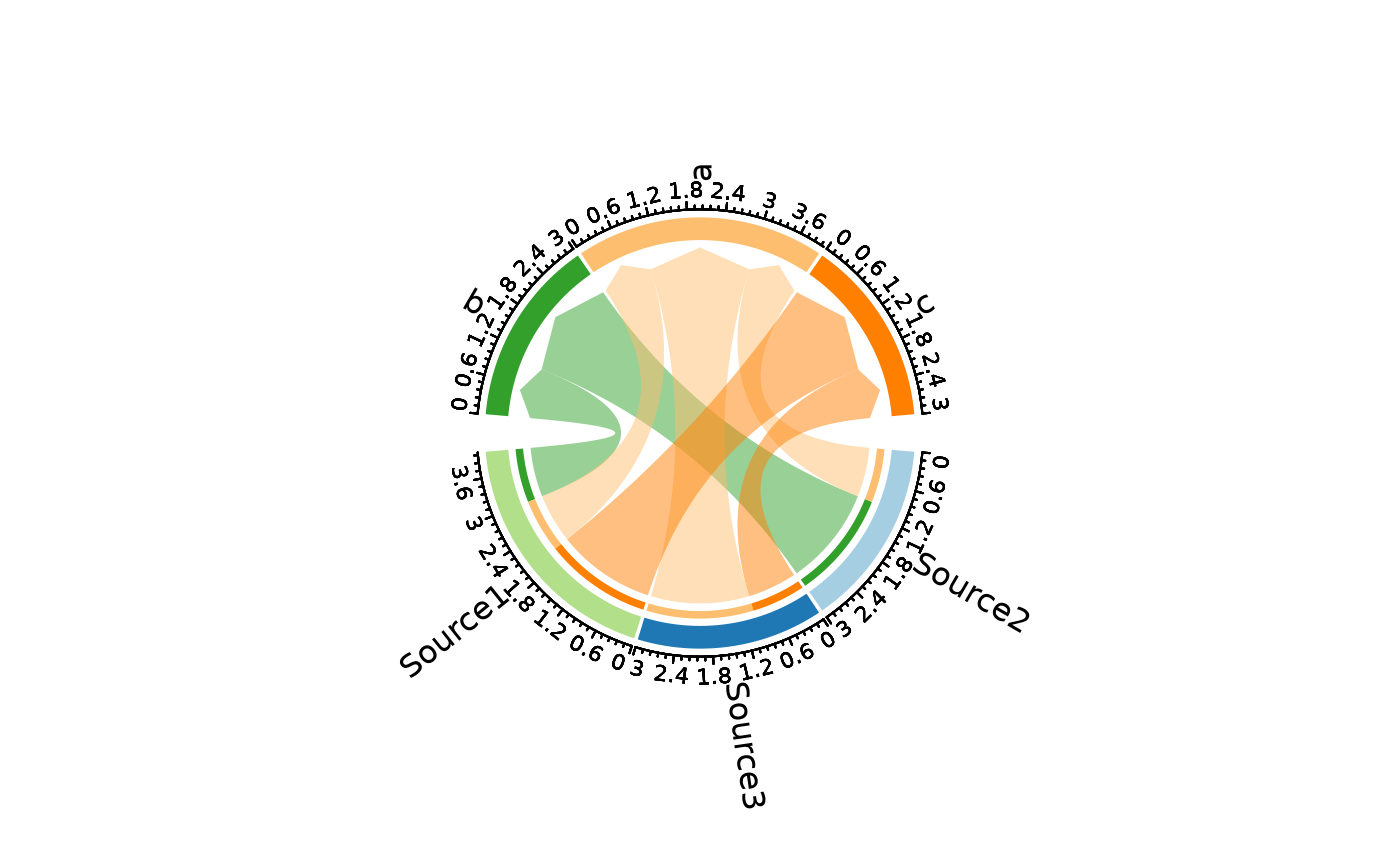
 # With rotated labels and colored by target
ChordPlot(data,
from = "nodes1", to = "nodes2",
links_color = "to", labels_rot = TRUE
)
# With rotated labels and colored by target
ChordPlot(data,
from = "nodes1", to = "nodes2",
links_color = "to", labels_rot = TRUE
)
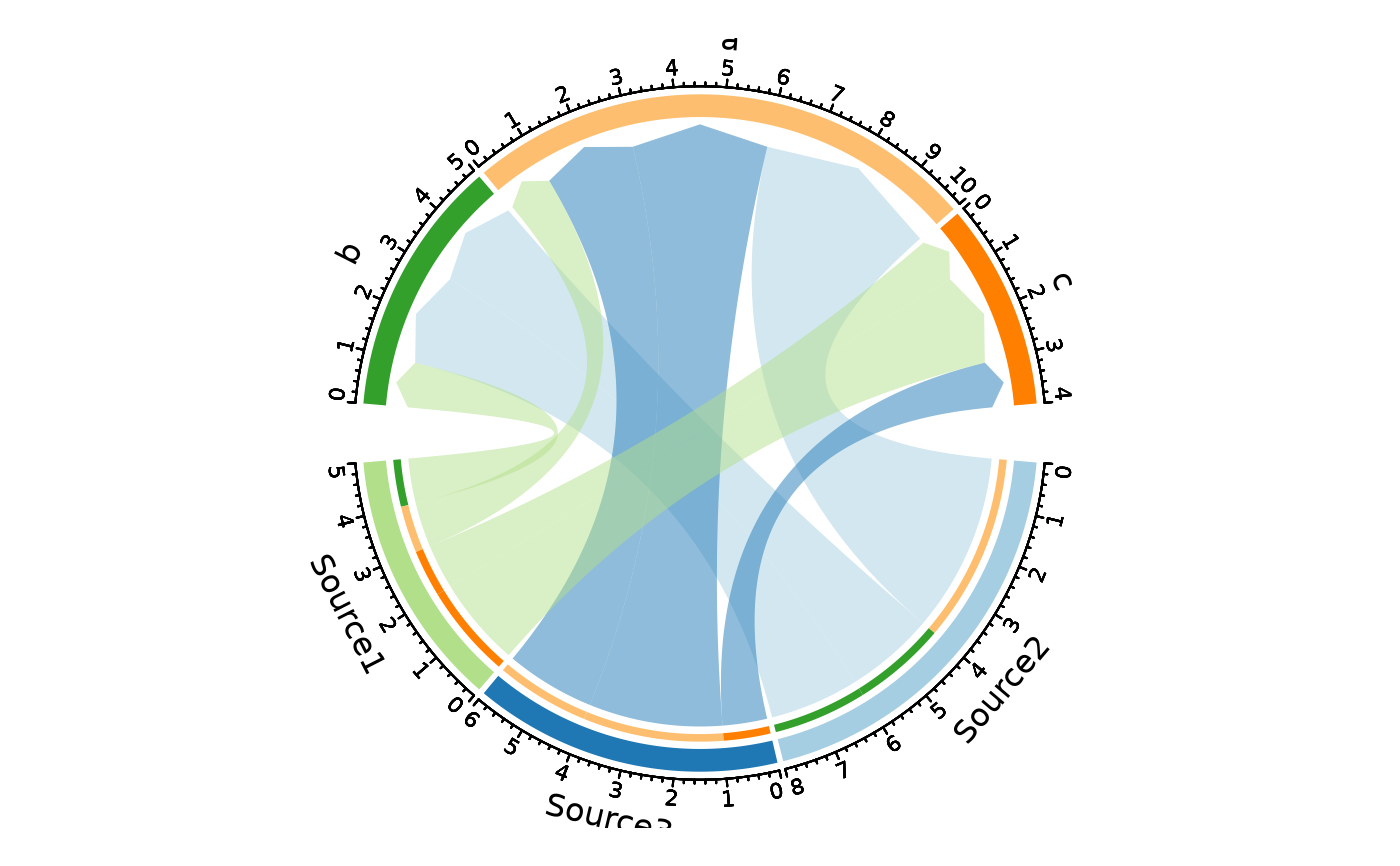
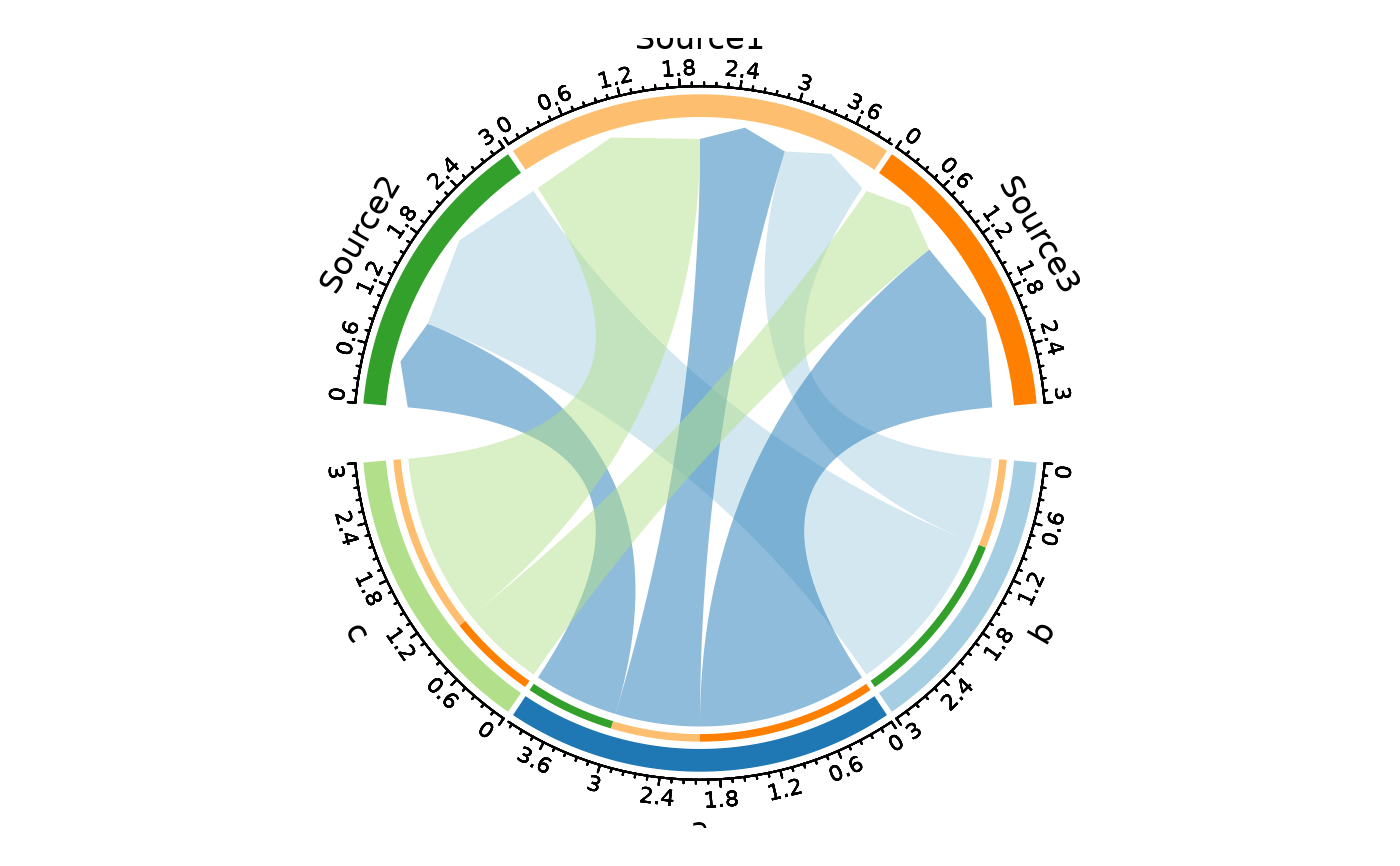
 # With values
ChordPlot(data, from = "nodes1", to = "nodes2", y = "y")
# With values
ChordPlot(data, from = "nodes1", to = "nodes2", y = "y")
 # Split by variable
ChordPlot(data, from = "nodes1", to = "nodes2", split_by = "y")
# Split by variable
ChordPlot(data, from = "nodes1", to = "nodes2", split_by = "y")
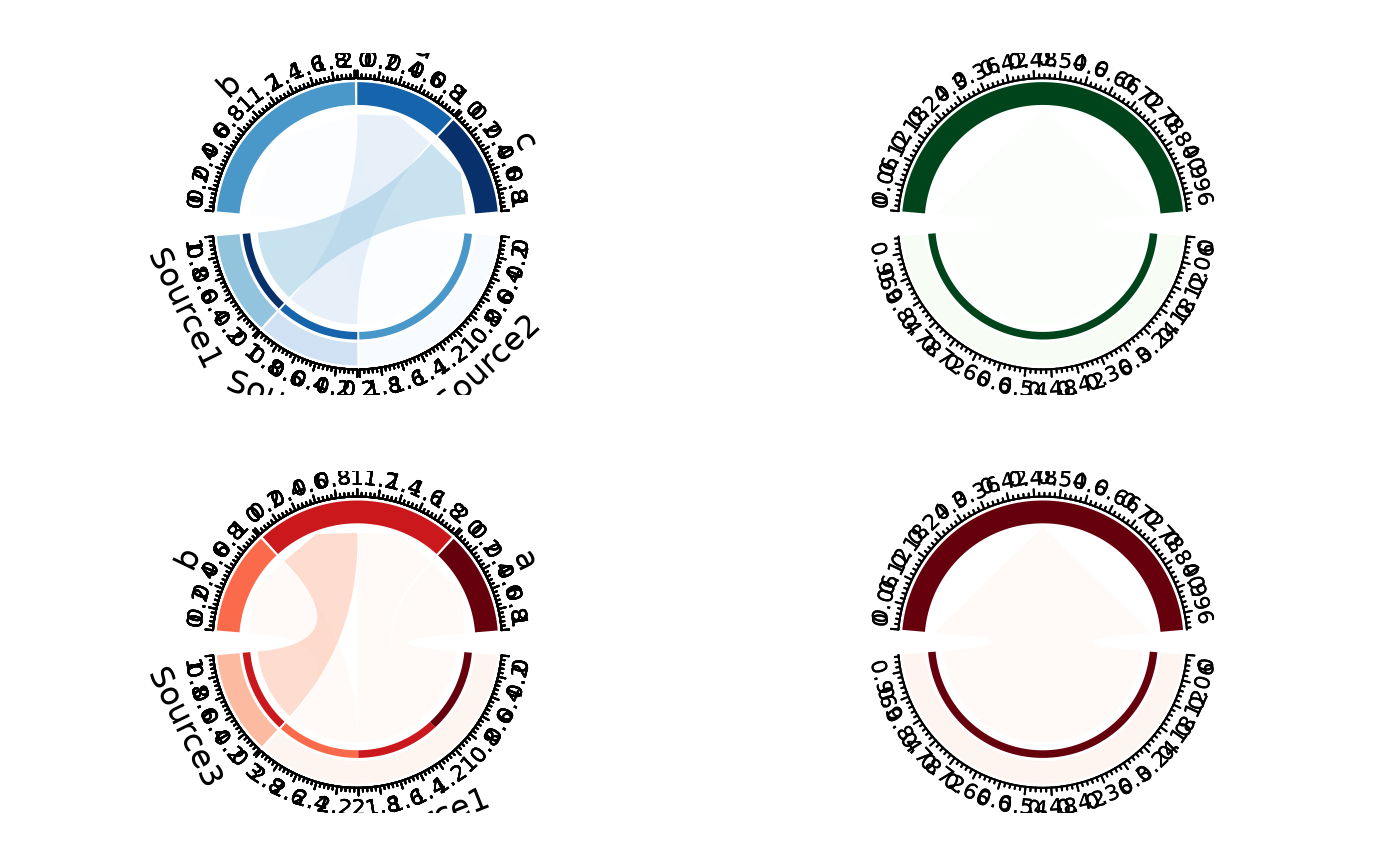
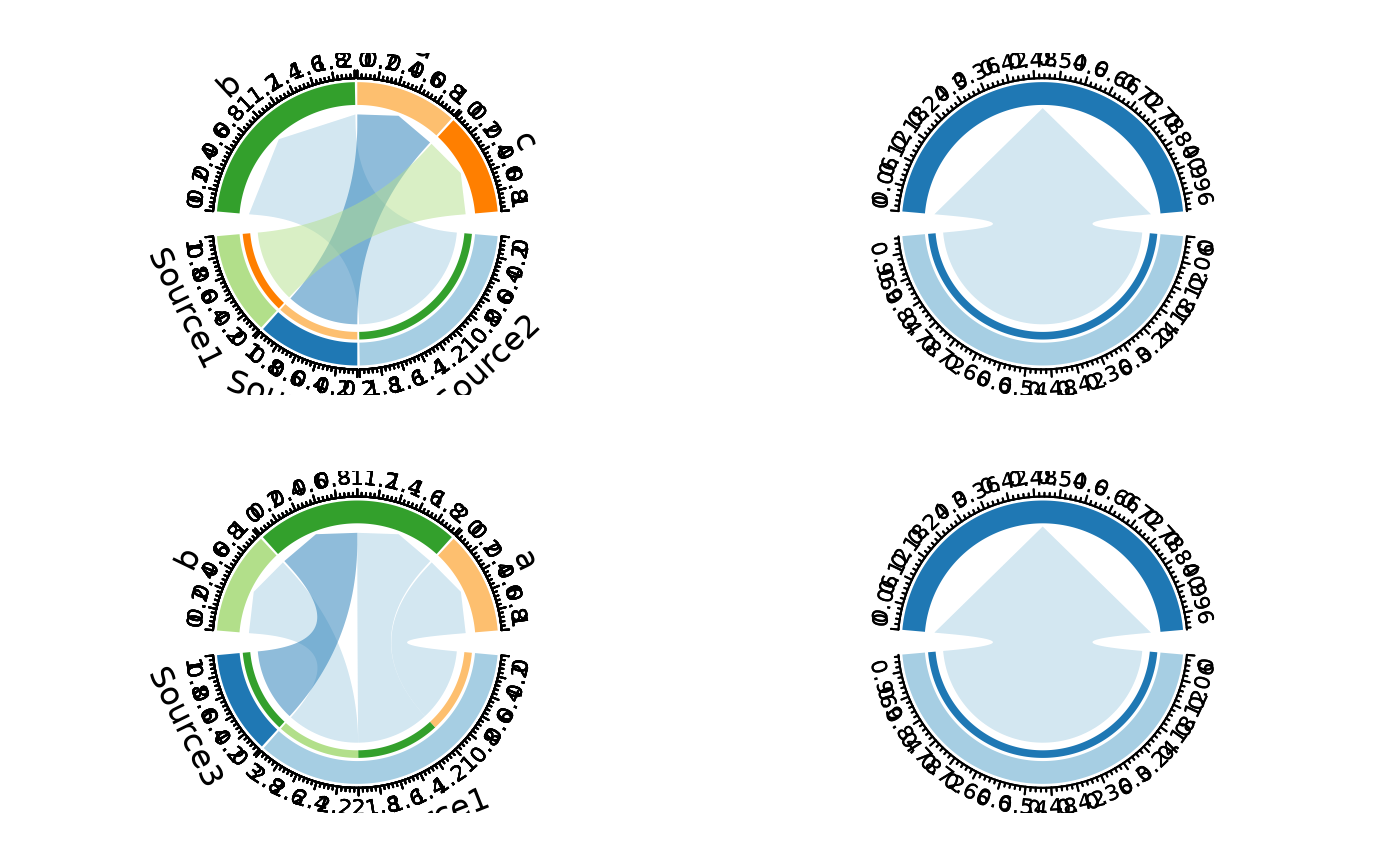 # With custom palettes per split
ChordPlot(data,
from = "nodes1", to = "nodes2", split_by = "y",
palette = c("1" = "Reds", "2" = "Blues", "3" = "Greens")
)
#> Using palette "Reds" for split_by values without explicit palette: "4"
# With custom palettes per split
ChordPlot(data,
from = "nodes1", to = "nodes2", split_by = "y",
palette = c("1" = "Reds", "2" = "Blues", "3" = "Greens")
)
#> Using palette "Reds" for split_by values without explicit palette: "4"
 # Flip source and target
ChordPlot(data, from = "nodes1", to = "nodes2", flip = TRUE)
# Flip source and target
ChordPlot(data, from = "nodes1", to = "nodes2", flip = TRUE)
 # }
# }