Creates enrichment map visualizations showing clustering of enriched terms based on gene overlap. Terms are nodes, and edges represent shared genes. Nodes are clustered to reveal functional modules.
Usage
EnrichMap(
  data,
  in_form = c("auto", "clusterProfiler", "clusterprofiler", "enrichr"),
  split_by = NULL,
  split_by_sep = "_",
  top_term = 10,
  metric = "p.adjust",
  layout = "fr",
  minchar = 2,
  cluster = "fast_greedy",
  show_keyword = FALSE,
  nlabel = 4,
  character_width = 50,
  mark = "ellipse",
  label = c("term", "feature"),
  labelsize = 5,
  expand = c(0.4, 0.4),
  words_excluded = NULL,
  theme = "theme_ggforge",
  theme_args = list(),
  palette = "forge",
  palcolor = NULL,
  alpha = 1,
  aspect.ratio = NULL,
  legend.position = "right",
  legend.direction = "vertical",
  title = NULL,
  subtitle = NULL,
  xlab = NULL,
  ylab = NULL,
  seed = 8525,
  combine = TRUE,
  nrow = NULL,
  ncol = NULL,
  byrow = TRUE,
  axes = NULL,
  axis_titles = axes,
  guides = NULL,
  design = NULL,
  ...
)
Arguments
- data
A data frame containing the data to be plotted. It should be in the format of clusterProfiler enrichment result, which includes the columns: ID, Description, GeneRatio, BgRatio, pvalue, p.adjust, qvalue, geneID and Count.
The
ID,qvalueandCountcolumns are optional.The
Descriptionis the description of the term.The
GeneRatiois the number of genes in the term divided by the total number of genes in the input list.The
BgRatiois the number of genes in the term divided by the total number of genes in the background list (all terms).The
Countcolumn, if given, should be the same as the first number in GeneRatio.
If you have enrichment results from multiple databases, you can combine them into one data frame and add a column (e.g. Database) to indicate the database. You can plot them in a single plot using the
split_byargument (e.g.split_by = "Database").- in_form
A character string specifying the input format. Either "auto", "clusterProfiler", "clusterprofiler" or "enrichr". The default is "auto", which will try to infer the input format.
- split_by
Column name(s) to split data into multiple plots
- split_by_sep
Separator when concatenating multiple split_by columns
- top_term
An integer specifying the number of top terms to show.
- metric
A character string specifying the metric to use for the size of the nodes. It is also used to order the terms when selected the top terms. Either "pvalue" or "p.adjust". The default is "p.adjust".
- layout
A character string specifying the layout of the graph. Either "circle", "tree", "grid" or other layout functions in
igraph.- minchar
An integer specifying the minimum number of characters to show in the keyword.
- cluster
A character string specifying the clustering method. Either "fast_greedy", "walktrap", "edge_betweenness", "infomap" or other clustering functions in
igraph.- show_keyword
A logical value specifying whether to show the keyword instead of Description/Term in the plot.
- nlabel
An integer specifying the number of labels to show in each cluster.
- character_width
The width of the characters used to wrap the keyword.
- mark
A character string specifying the mark to use for the nodes. Either "ellipse", "rect", "circle", "text" or other mark functions in
ggforce.- label
A character string specifying the label to show in the legend. Either "term" or "feature". The default is "term".
- labelsize
A numeric value specifying the size of the label.
- expand
Expansion values for plot axes (CSS-like padding)
- words_excluded
A character vector specifying the words to exclude in the keyword.
- theme
Theme name (string) or theme function
- theme_args
List of arguments passed to theme function
- palette
Color palette name
- palcolor
Custom colors for palette
- alpha
Transparency level (0-1)
- aspect.ratio
Aspect ratio of plot panel
- legend.position
Legend position: "none", "left", "right", "bottom", "top"
- legend.direction
Legend direction: "horizontal" or "vertical"
- title
Plot title
- subtitle
Plot subtitle
- xlab
X-axis label
- ylab
Y-axis label
- seed
Random seed for reproducibility
- combine
Whether to combine split plots into one
- nrow
Number of rows when combining plots
- ncol
Number of columns when combining plots
- byrow
Fill combined plots by row
- axes
How to handle axes in combined plots ("keep", "collect", "collect_x", "collect_y")
- axis_titles
How to handle axis titles in combined plots
- guides
How to handle guides in combined plots ("collect", "keep", "auto")
- design
Custom layout design for combined plots
- ...
Additional arguments passed to atomic plotting functions.
See also
Other enrichment-plots:
EnrichNetwork(),
GSEAPlot(),
GSEASummaryPlot()
Examples
# \donttest{
data(enrich_example)
EnrichMap(enrich_example)
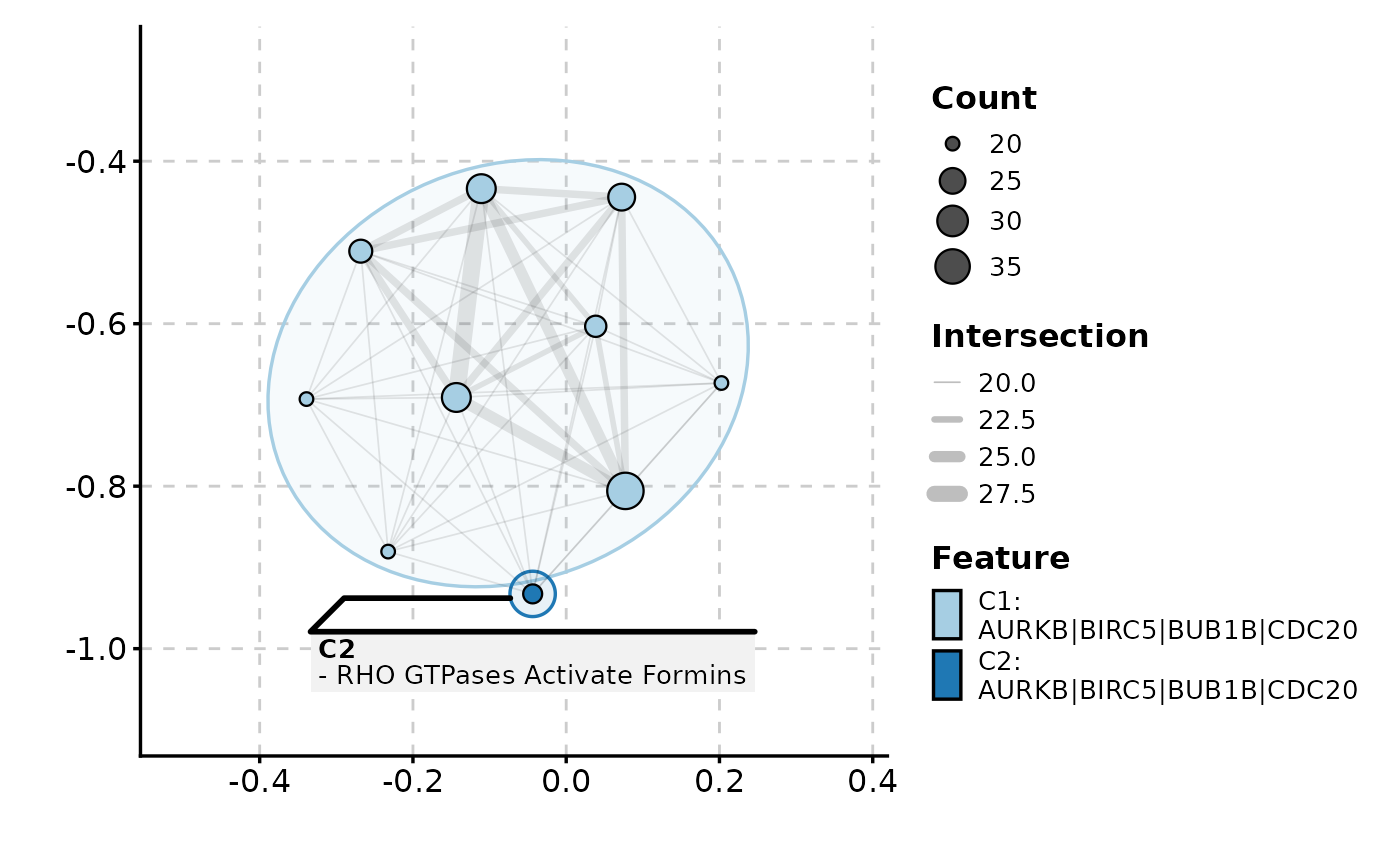 EnrichMap(enrich_example, label = "feature")
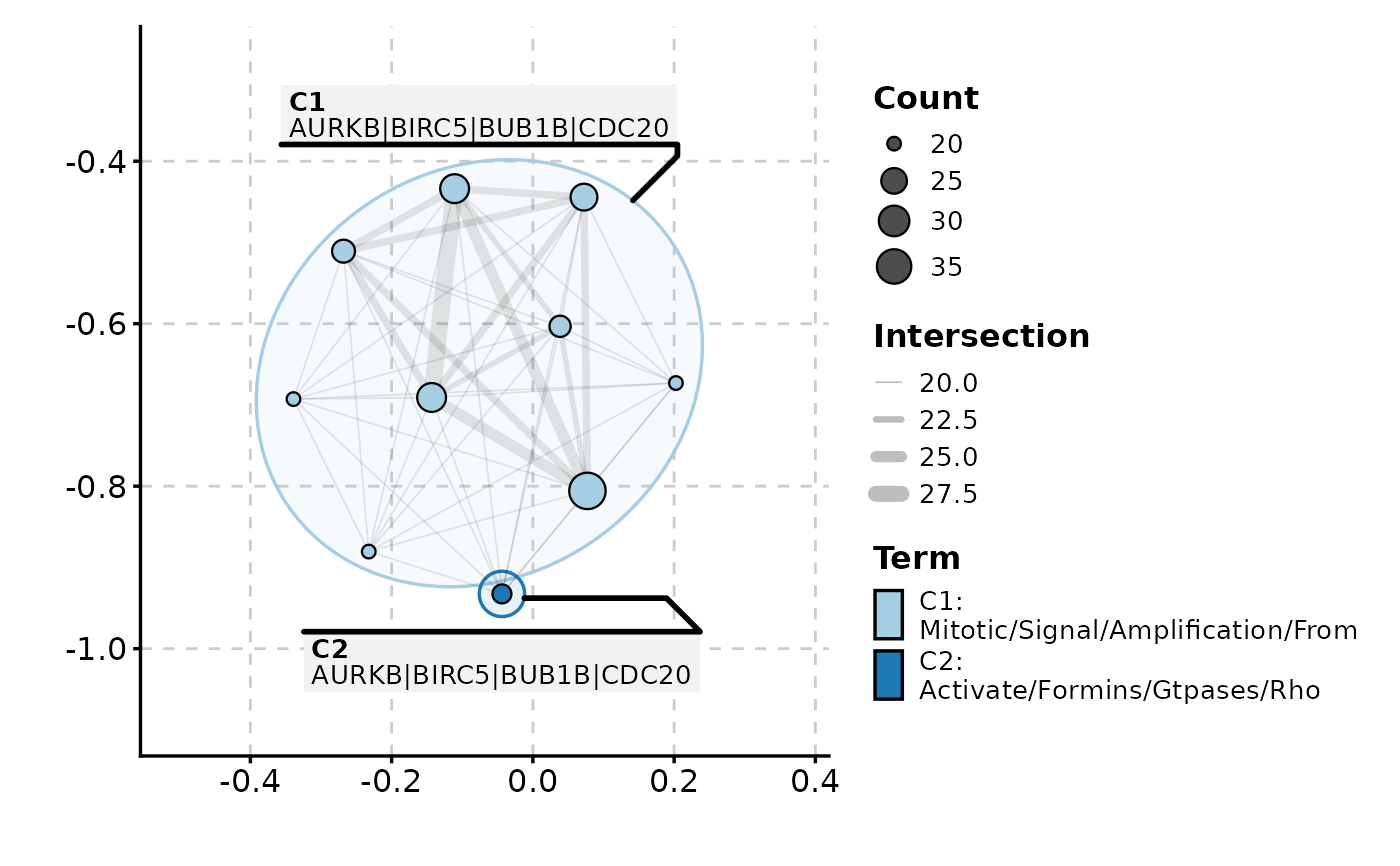
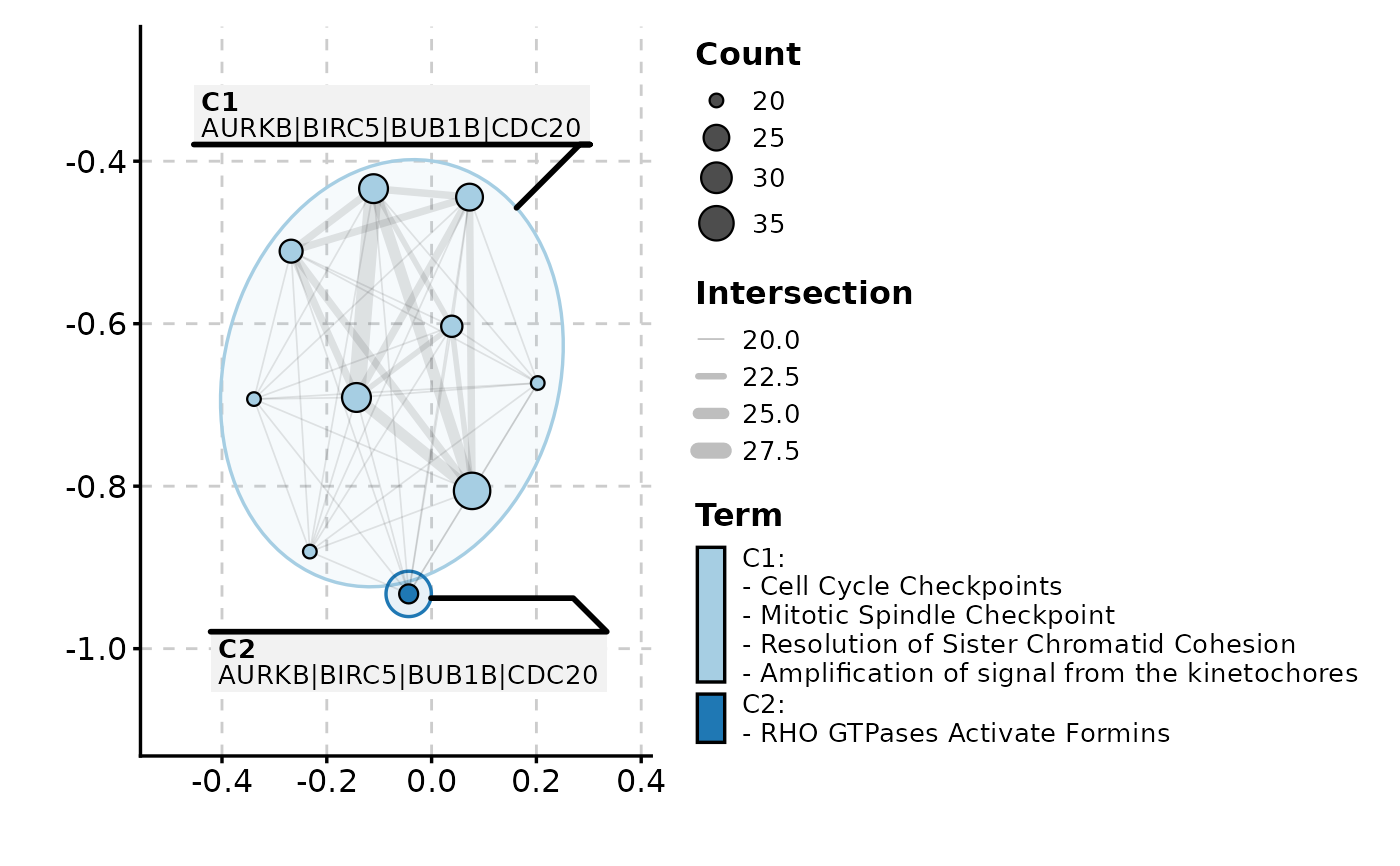 EnrichMap(enrich_example, show_keyword = TRUE, label = "term")
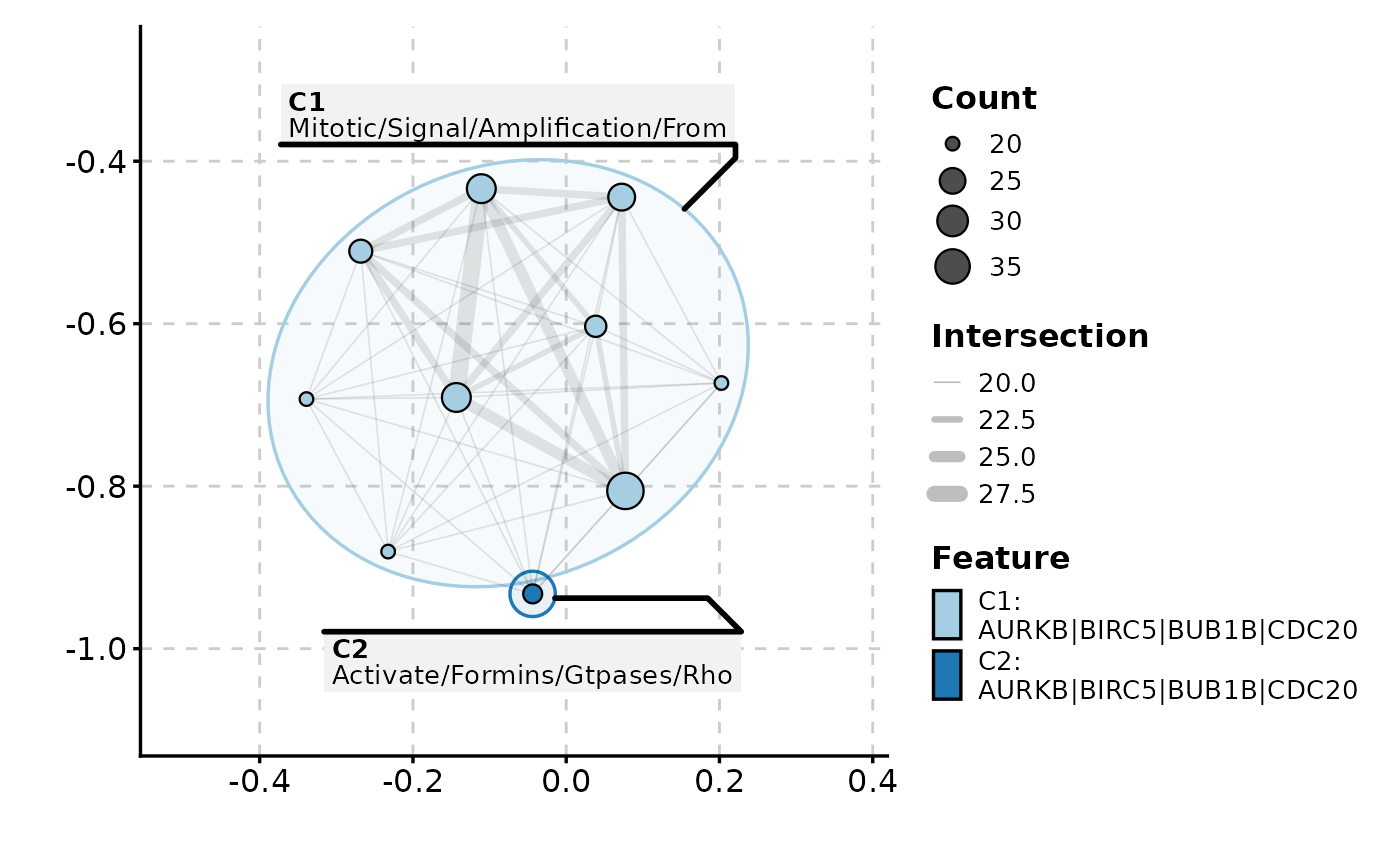 EnrichMap(enrich_example, show_keyword = TRUE, label = "feature")
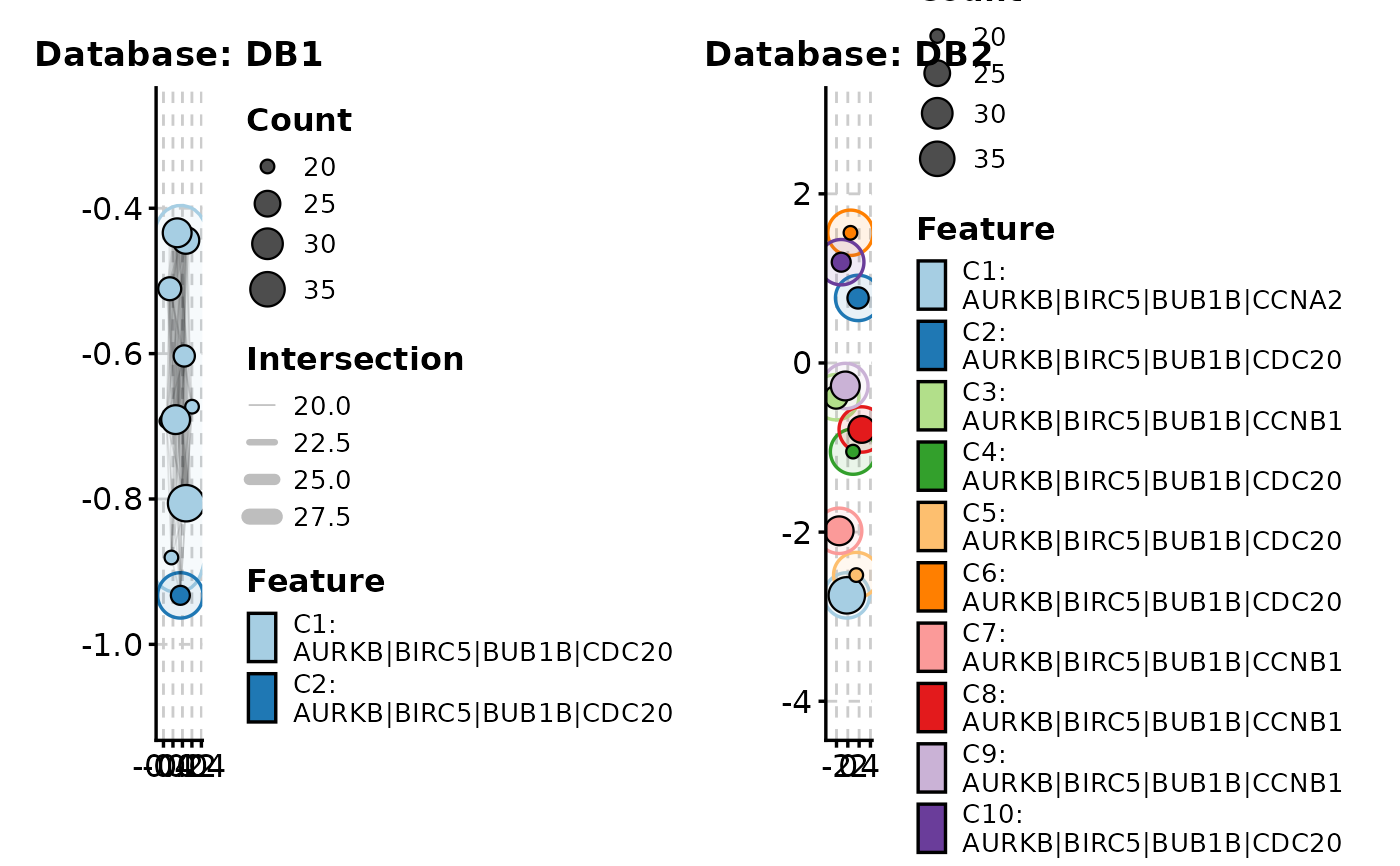
 data(enrich_multidb_example)
EnrichMap(enrich_multidb_example, split_by = "Database")
data(enrich_multidb_example)
EnrichMap(enrich_multidb_example, split_by = "Database")
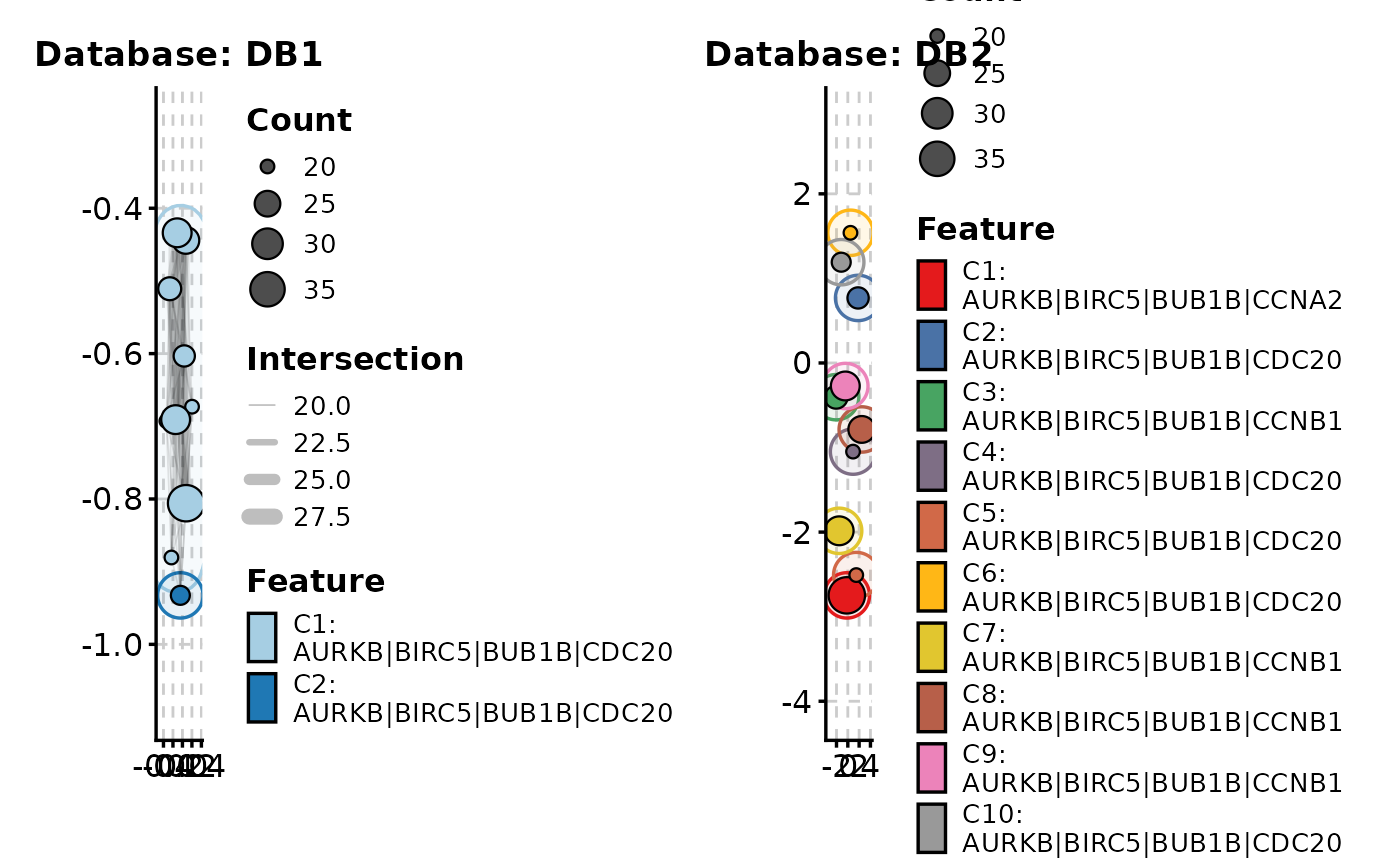
 EnrichMap(enrich_multidb_example,
split_by = "Database",
palette = list(DB1 = "Paired", DB2 = "Set1")
)
EnrichMap(enrich_multidb_example,
split_by = "Database",
palette = list(DB1 = "Paired", DB2 = "Set1")
)
 # }
# }