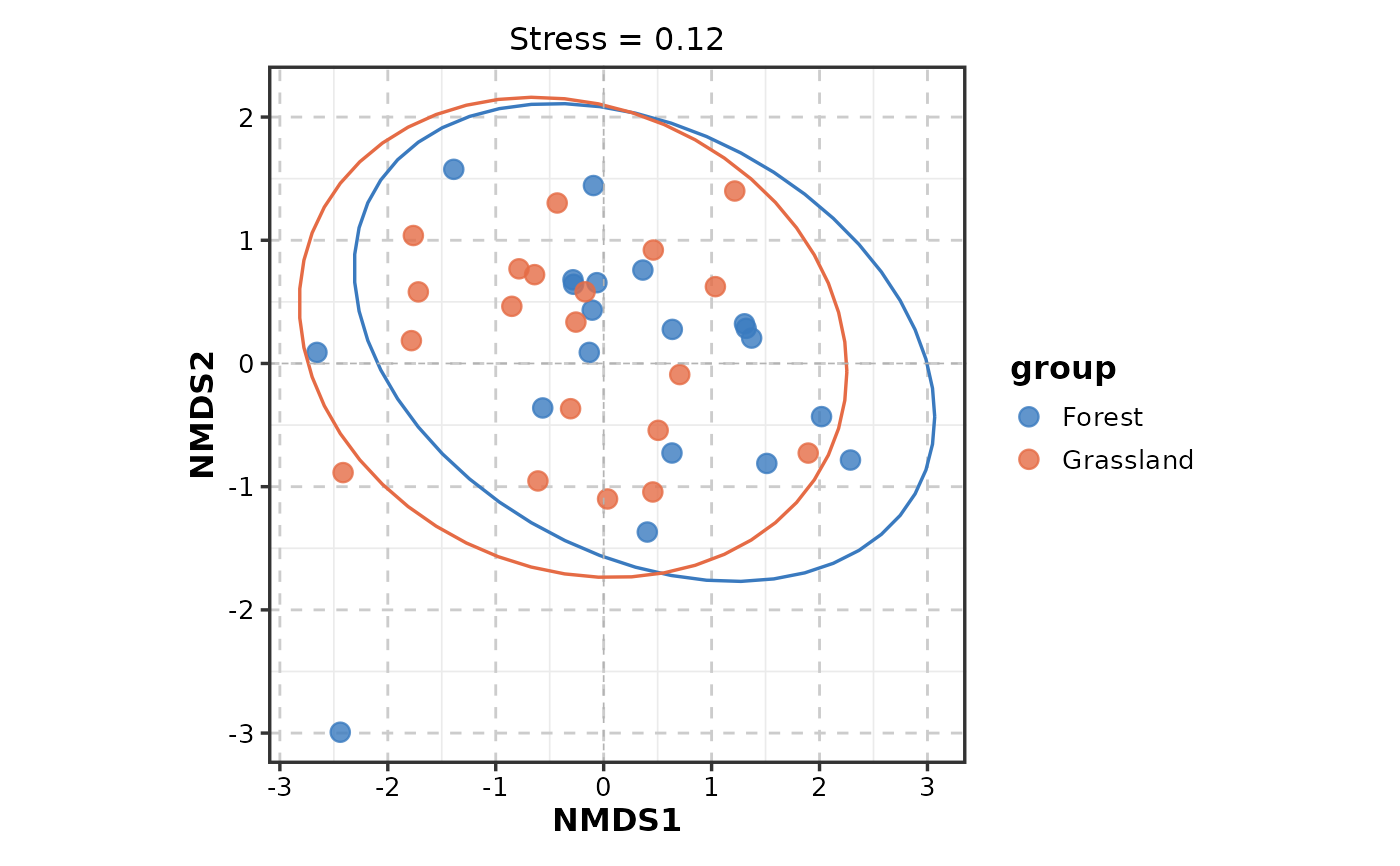
Creates ordination biplot for ecological and microbiome data. Unlike DimPlot (designed for single-cell UMAP/tSNE), this supports biplot arrows for species scores and environmental vectors, confidence ellipses, and stress values. Works with vegan ordination objects or pre-computed score data frames.
Usage
OrdinationPlot(
  data,
  x,
  y,
  group_by = NULL,
  group_by_sep = "_",
  group_name = NULL,
  species_data = NULL,
  species_x = NULL,
  species_y = NULL,
  species_label = NULL,
  species_color = "grey30",
  species_top = 10,
  env_data = NULL,
  env_x = NULL,
  env_y = NULL,
  env_label = NULL,
  env_color = "blue",
  add_ellipse = FALSE,
  ellipse_level = 0.95,
  ellipse_type = c("t", "norm"),
  pt_size = 3,
  stress_value = NULL,
  split_by = NULL,
  split_by_sep = "_",
  facet_by = NULL,
  facet_scales = "fixed",
  facet_nrow = NULL,
  facet_ncol = NULL,
  facet_byrow = TRUE,
  theme = "theme_ggforge_grid",
  theme_args = list(),
  palette = "forge",
  palcolor = NULL,
  alpha = 0.8,
  aspect.ratio = 1,
  legend.position = "right",
  legend.direction = "vertical",
  title = NULL,
  subtitle = NULL,
  xlab = NULL,
  ylab = NULL,
  seed = 8525,
  combine = TRUE,
  nrow = NULL,
  ncol = NULL,
  byrow = TRUE,
  axes = NULL,
  axis_titles = NULL,
  guides = NULL,
  design = NULL,
  ...
)
Arguments
- data
A data frame containing the data to plot
- x, y
Column names for ordination axes (e.g. "NMDS1", "NMDS2").
- group_by
Column for sample grouping.
- group_by_sep
Separator for multiple group_by columns.
- group_name
Legend title.
- species_data
Optional data frame of species scores for biplot arrows.
- species_x, species_y
Column names in
species_datafor species scores.- species_label
Column in species_data for arrow labels.
- species_color
Color for species arrows.
- species_top
Number of top species to show (by vector length).
- env_data
Optional data frame for environmental vectors.
- env_x, env_y
Column names in env_data for vector coordinates.
- env_label
Column in env_data for arrow labels.
- env_color
Color for environmental arrows.
- add_ellipse
Whether to add confidence ellipses per group.
- ellipse_level
Confidence level for ellipses.
- ellipse_type
Type of ellipse: "t" or "norm".
- pt_size
Point size.
- stress_value
Optional stress value to annotate (for NMDS).
- split_by
Column name(s) to split data into multiple plots
- split_by_sep
Separator when concatenating multiple split_by columns
- facet_by
Column name(s) for faceting the plot
- facet_scales
Scales for facets: "fixed", "free", "free_x", "free_y"
- facet_nrow
Number of rows in facet layout
- facet_ncol
Number of columns in facet layout
- facet_byrow
Fill facets by row (TRUE) or column (FALSE)
- theme
Theme name (string) or theme function
- theme_args
List of arguments passed to theme function
- palette
Color palette name
- palcolor
Custom colors for palette
- alpha
Transparency level (0-1)
- aspect.ratio
Aspect ratio of plot panel
- legend.position
Legend position: "none", "left", "right", "bottom", "top"
- legend.direction
Legend direction: "horizontal" or "vertical"
- title
Plot title
- subtitle
Plot subtitle
- xlab
X-axis label
- ylab
Y-axis label
- seed
Random seed for reproducibility
- combine
Whether to combine split plots into one
- nrow
Number of rows when combining plots
- ncol
Number of columns when combining plots
- byrow
Fill combined plots by row
- axes
How to handle axes in combined plots ("keep", "collect", "collect_x", "collect_y")
- axis_titles
How to handle axis titles in combined plots
- guides
How to handle guides in combined plots ("collect", "keep", "auto")
- design
Custom layout design for combined plots
- ...
Additional arguments passed to atomic plotting functions.
See also
Other ecology-evolution-plots:
PhyloTreePlot(),
RankAbundancePlot()