Creates phylogenetic tree visualizations from tree objects (phylo class). Supports rectangular, circular, and fan layouts with branch coloring and tip label customization. Requires the ape package.
Usage
PhyloTreePlot(
  tree,
  layout = c("rectangular", "circular", "fan"),
  group_by = NULL,
  group_name = NULL,
  branch_width = 0.6,
  branch_color = "grey20",
  tip_size = 2,
  tip_label = TRUE,
  tip_label_size = 3,
  tip_label_offset = 0.5,
  open_angle = 10,
  theme = "theme_ggforge",
  theme_args = list(),
  palette = "forge",
  palcolor = NULL,
  alpha = 1,
  legend.position = "right",
  legend.direction = "vertical",
  title = NULL,
  subtitle = NULL,
  seed = 8525,
  ...
)
Arguments
- tree
A phylo object (from ape package) or a Newick string.
- layout
Tree layout: "rectangular", "circular", or "fan".
- group_by
Named vector mapping tip labels to groups (for tip coloring).
- group_name
Legend title.
- branch_width
Width of tree branches.
- branch_color
Color for branches (single color or "group" to match tip colors).
- tip_size
Size of tip points.
- tip_label
Whether to show tip labels.
- tip_label_size
Size of tip labels.
- tip_label_offset
Offset for tip labels from tip points.
- open_angle
Opening angle for fan layout (degrees).
- theme
Theme name (string) or theme function
- theme_args
List of arguments passed to theme function
- palette
Color palette name
- palcolor
Custom colors for palette
- alpha
Transparency level (0-1)
- legend.position
Legend position: "none", "left", "right", "bottom", "top"
- legend.direction
Legend direction: "horizontal" or "vertical"
- title
Plot title
- subtitle
Plot subtitle
- seed
Random seed for reproducibility
- ...
Additional arguments.
See also
Other ecology-evolution-plots:
OrdinationPlot(),
RankAbundancePlot()
Examples
# \donttest{
if (requireNamespace("ape", quietly = TRUE)) {
tree <- ape::rtree(20)
PhyloTreePlot(tree)
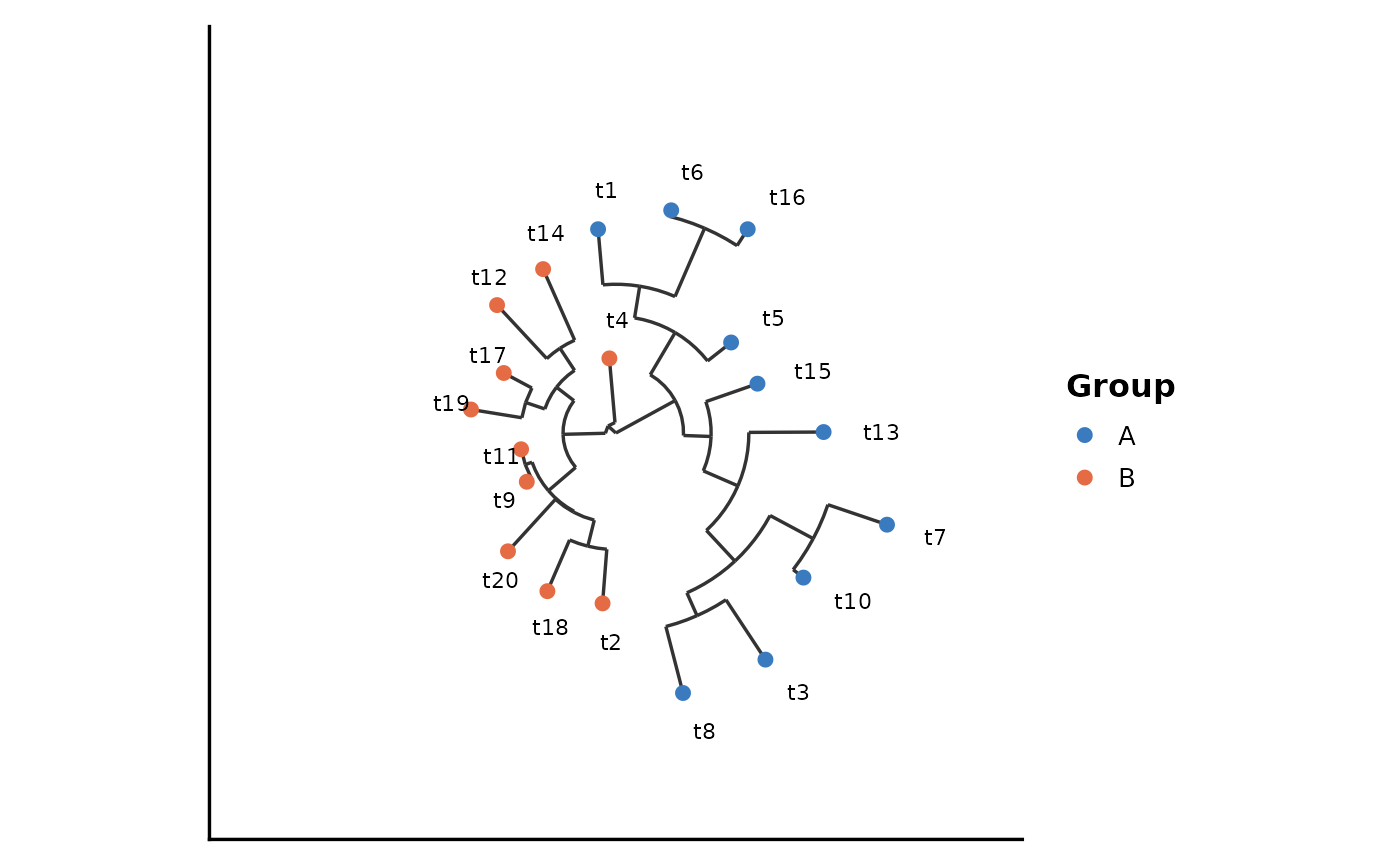
groups <- setNames(rep(c("A", "B"), each = 10), tree$tip.label)
PhyloTreePlot(tree, group_by = groups, layout = "circular")
}
 # }
# }