scMetaLink is an R package for inferring metabolite-mediated cell-cell communication from single-cell and spatial transcriptomics data.
📖 Documentation: https://Zaoqu-Liu.github.io/scMetaLink/
Background
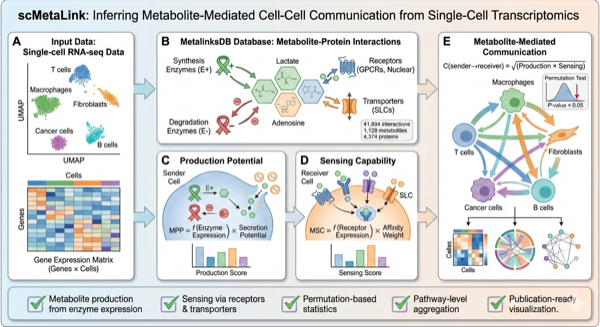
Metabolites serve as critical signaling molecules in the cellular microenvironment. While tools like CellChat and CellPhoneDB have advanced our understanding of ligand-receptor interactions, the metabolic dimension of intercellular communication remains underexplored. scMetaLink addresses this gap by integrating enzyme expression, transporter activity, and receptor-metabolite interactions to reconstruct metabolite-mediated communication networks.
Features
- Metabolite Production Inference: Estimate metabolite production potential based on biosynthetic enzyme expression
- Metabolite Sensing Analysis: Quantify sensing capability via receptors (GPCRs, nuclear receptors) and transporters
- Statistical Framework: Permutation-based significance testing with multiple hypothesis correction
- Pathway Integration: Aggregate communication patterns at the pathway level
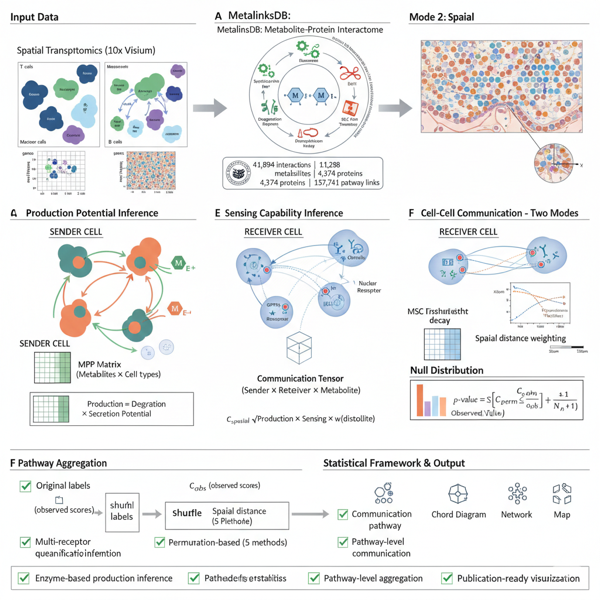
- Spatial Transcriptomics: Distance-weighted communication analysis for spatial data
- Visualization: Heatmaps, chord diagrams, network plots, and spatial maps
Database
scMetaLink utilizes MetalinksDB, containing:
- 41,894 metabolite-protein interactions
- 1,128 metabolites
- 4,374 proteins/genes
- 157,741 pathway associations
Installation
From r-universe (Recommended)
install.packages("scMetaLink", repos = "https://zaoqu-liu.r-universe.dev")From GitHub
# Install devtools if needed
if (!require("devtools")) install.packages("devtools")

devtools::install_github("Zaoqu-Liu/scMetaLink")
Quick Start
Single-Cell Analysis
library(scMetaLink)

# Create scMetaLink object
obj <- createScMetaLink(
  expression_data = expr_matrix,
  cell_meta = cell_metadata,
  cell_type_column = "cell_type"
)

# Infer metabolite production and sensing
obj <- inferProduction(obj)
obj <- inferSensing(obj)

# Compute communication with significance testing
obj <- computeCommunication(obj, n_permutations = 1000)
obj <- filterSignificantInteractions(obj, pvalue_threshold = 0.05)

# Visualize results
plotCommunicationHeatmap(obj)
plotCommunicationCircle(obj)
For Seurat users:
result <- runScMetaLinkSeurat(seurat_obj, cell_type_column = "cell_type")Spatial Transcriptomics Analysis
scMetaLink supports spatial transcriptomics data with distance-weighted communication analysis.
Spatial Quick Start
library(scMetaLink)

# Load spatial data
data(st_expr)
data(st_meta)
data(st_scalefactors)

# Create spatial scMetaLink object
obj <- createScMetaLinkFromSpatial(
  expression_data = st_expr,
  spatial_coords = st_meta[, c("x", "y")],
  cell_meta = st_meta,
  cell_type_column = "cell_type",
  scale_factors = st_scalefactors
)

# Infer production and sensing
obj <- inferProduction(obj)
obj <- inferSensing(obj)

# Compute spatially-weighted communication
obj <- computeSpatialCommunication(
  obj,
  method = "knn",        # K-nearest neighbors (recommended for Visium)
  k_neighbors = 6,       # Hexagonal grid neighbors
  n_permutations = 1000
)

# Filter and visualize
obj <- filterSignificantInteractions(obj)
plotSpatialCellTypes(obj)
plotSpatialCommunicationNetwork(obj)
plotSpatialFeature(obj, metabolite = "L-Lactic acid", type = "production")Methodology
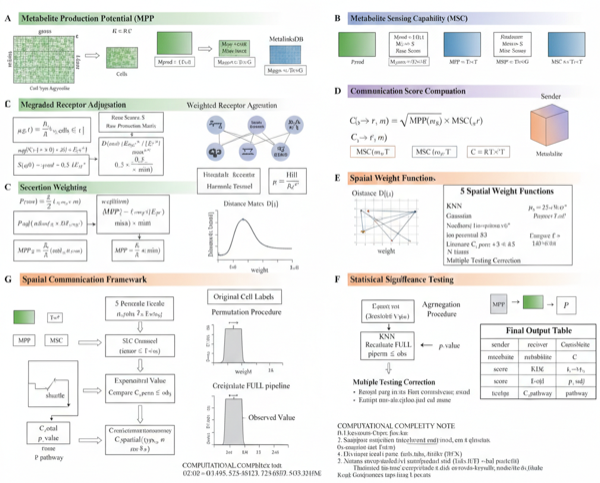
Metabolite Production Potential (MPP)
where denotes biosynthetic enzymes for metabolite , is the evidence weight, and represents secretion potential.
Tutorials
| Tutorial | Description |
|---|---|
| Quick Start | Basic workflow |
| Theory | Mathematical framework |
| Production & Sensing | Inference details |
| Communication | Statistical analysis |
| Spatial Analysis | Spatial transcriptomics |
| Lactate Signaling | Lactate-mediated communication |
| Visualization | Plotting functions |
| Applications | Case studies |
Citation
If you use scMetaLink in your research, please cite:
Liu Z, et al. (2026). scMetaLink: Inferring metabolite-mediated cell-cell
communication from single-cell and spatial transcriptomics data.
Contact
- Author: Zaoqu Liu
- Email: liuzaoqu@163.com
- GitHub: https://github.com/Zaoqu-Liu/scMetaLink
