Visualizes continuous features (gene expression, etc.) on dimension reduction plots
Usage
FeatureDimPlot(
  data,
  dims = 1:2,
  features,
  lower_quantile = 0,
  upper_quantile = 0.99,
  lower_cutoff = NULL,
  upper_cutoff = NULL,
  bg_cutoff = NULL,
  color_name = "",
  split_by = NULL,
  split_by_sep = "_",
  pt_size = NULL,
  pt_alpha = 1,
  bg_color = "grey80",
  label = FALSE,
  label_size = 4,
  label_fg = "white",
  label_bg = "black",
  label_bg_r = 0.1,
  show_stat = !identical(theme, "theme_blank"),
  order = c("as-is", "reverse", "high-top", "low-top", "random"),
  highlight = NULL,
  highlight_alpha = 1,
  highlight_size = 1,
  highlight_color = "black",
  highlight_stroke = 0.8,
  add_density = FALSE,
  density_color = "grey80",
  density_filled = FALSE,
  density_filled_palette = "Greys",
  density_filled_palcolor = NULL,
  raster = NULL,
  raster_dpi = c(512, 512),
  hex = FALSE,
  hex_linewidth = 0.5,
  hex_count = FALSE,
  hex_bins = 50,
  hex_binwidth = NULL,
  facet_by = NULL,
  facet_scales = "fixed",
  facet_nrow = NULL,
  facet_ncol = NULL,
  facet_byrow = TRUE,
  theme = "theme_ggforge_grid",
  theme_args = list(),
  palette = "Spectral",
  palcolor = NULL,
  alpha = 1,
  aspect.ratio = NULL,
  legend.position = "right",
  legend.direction = "vertical",
  title = NULL,
  subtitle = NULL,
  xlab = NULL,
  ylab = NULL,
  seed = 8525,
  combine = TRUE,
  nrow = NULL,
  ncol = NULL,
  byrow = TRUE,
  axes = NULL,
  axis_titles = NULL,
  guides = NULL,
  design = NULL,
  ...
)
Arguments
- data
A data frame containing the data to plot
- dims
Column names or indices for x and y axes. Default is first two columns.
- features
Column name(s) of continuous features to plot. If multiple features provided, creates separate plots for each.
- lower_quantile, upper_quantile
Quantiles for color scale limits (0-1).
- lower_cutoff, upper_cutoff
Explicit cutoff values for color scale.
- bg_cutoff
Values below this threshold are set to NA (background color).
- color_name
Legend title for the color scale.
- split_by
Column name(s) to split data into multiple plots
- split_by_sep
Separator when concatenating multiple split_by columns
- pt_size
Point size. If NULL, calculated based on number of data points.
- pt_alpha
Point transparency (0-1).
- bg_color
Color for NA/background points.
- label
Whether to show group labels at median positions.
- label_size
Size of labels.
- label_fg, label_bg
Foreground and background colors for labels.
- label_bg_r
Background radius for labels.
- show_stat
Whether to show sample count in subtitle.
- order
How to order points: "as-is", "reverse", "high-top", "low-top", "random". Affects drawing order (what's on top).
- highlight
Row names/indices to highlight, or logical expression as string.
- highlight_alpha, highlight_size, highlight_color, highlight_stroke
Styling for highlighted points.
- add_density
Whether to add 2D density contours/fill.
- density_color, density_filled
Density styling.
- density_filled_palette, density_filled_palcolor
Palette for filled density.
- raster
Whether to rasterize points (useful for large datasets).
- raster_dpi
DPI for rasterization.
- hex
Whether to use hexagonal binning instead of points.
- hex_linewidth, hex_count, hex_bins, hex_binwidth
Hex bin parameters.
- facet_by
Column name(s) for faceting the plot
- facet_scales
Scales for facets: "fixed", "free", "free_x", "free_y"
- facet_nrow
Number of rows in facet layout
- facet_ncol
Number of columns in facet layout
- facet_byrow
Fill facets by row (TRUE) or column (FALSE)
- theme
Theme name (string) or theme function
- theme_args
List of arguments passed to theme function
- palette
Color palette name
- palcolor
Custom colors for palette
- alpha
Transparency level (0-1)
- aspect.ratio
Aspect ratio of plot panel
- legend.position
Legend position: "none", "left", "right", "bottom", "top"
- legend.direction
Legend direction: "horizontal" or "vertical"
- title
Plot title
- subtitle
Plot subtitle
- xlab
X-axis label
- ylab
Y-axis label
- seed
Random seed for reproducibility
- combine
Whether to combine split plots into one
- nrow
Number of rows when combining plots
- ncol
Number of columns when combining plots
- byrow
Fill combined plots by row
- axes
How to handle axes in combined plots ("keep", "collect", "collect_x", "collect_y")
- axis_titles
How to handle axis titles in combined plots
- guides
How to handle guides in combined plots ("collect", "keep", "auto")
- design
Custom layout design for combined plots
- ...
Additional arguments passed to atomic plotting functions.
See also
Other single-cell-plots:
DimPlot(),
StackedViolinPlot(),
TrajectoryPlot(),
VelocityPlot(),
spatialplots
Examples
# \donttest{
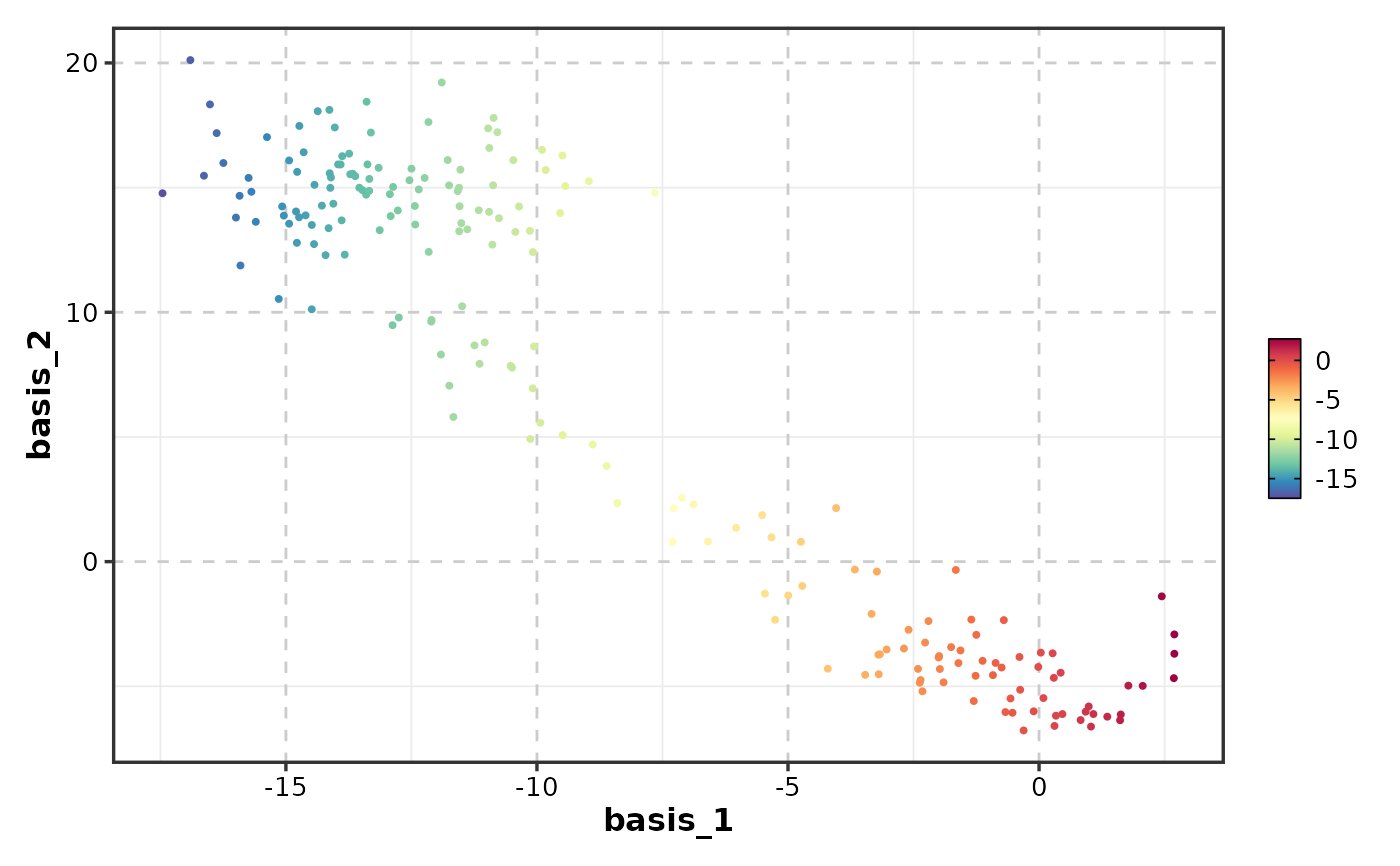
# Single feature
FeatureDimPlot(dim_example, features = "basis_1", dims = 1:2)
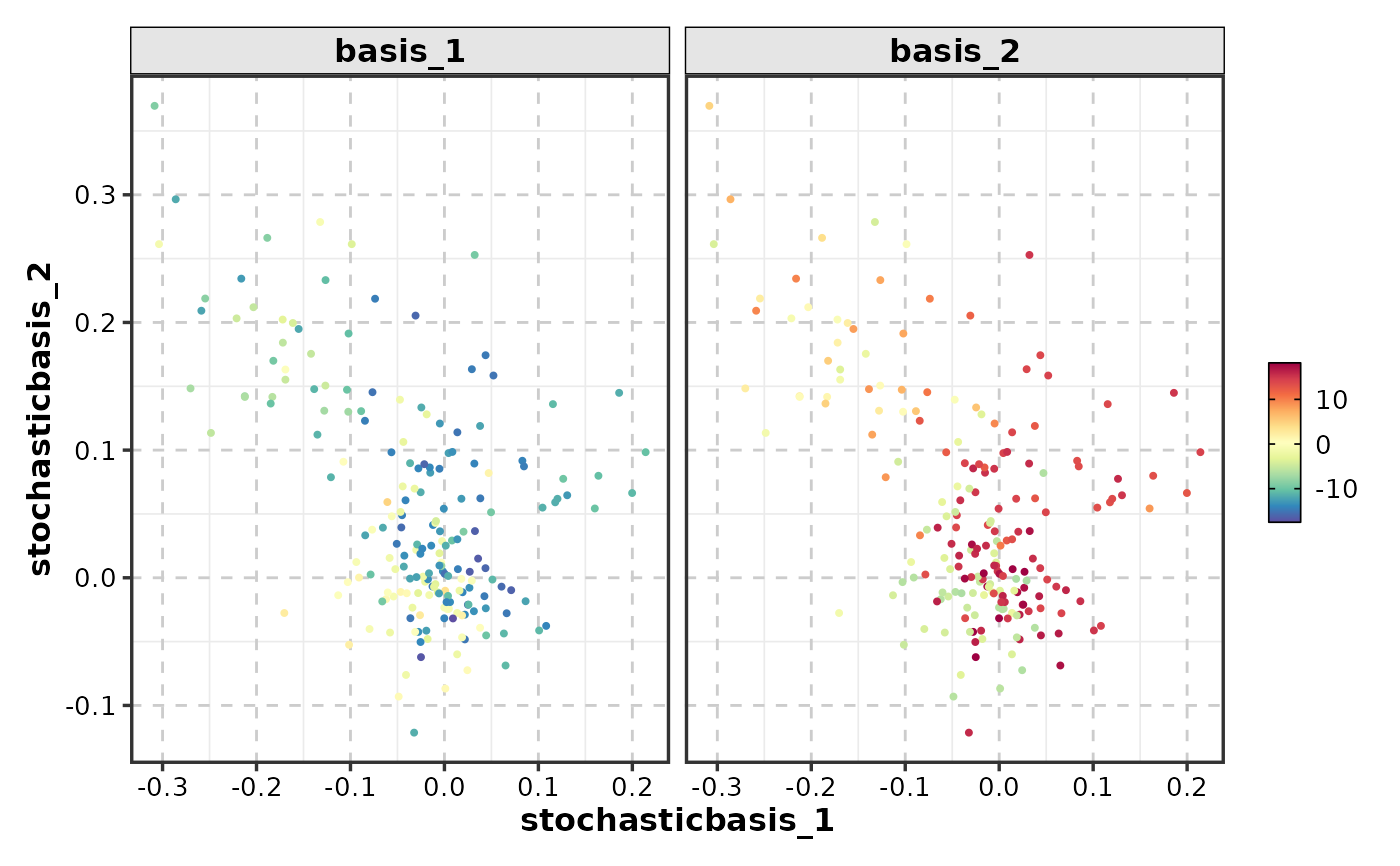
 # Multiple features
FeatureDimPlot(dim_example, features = c("basis_1", "basis_2"), dims = 1:2)
# Multiple features
FeatureDimPlot(dim_example, features = c("basis_1", "basis_2"), dims = 1:2)
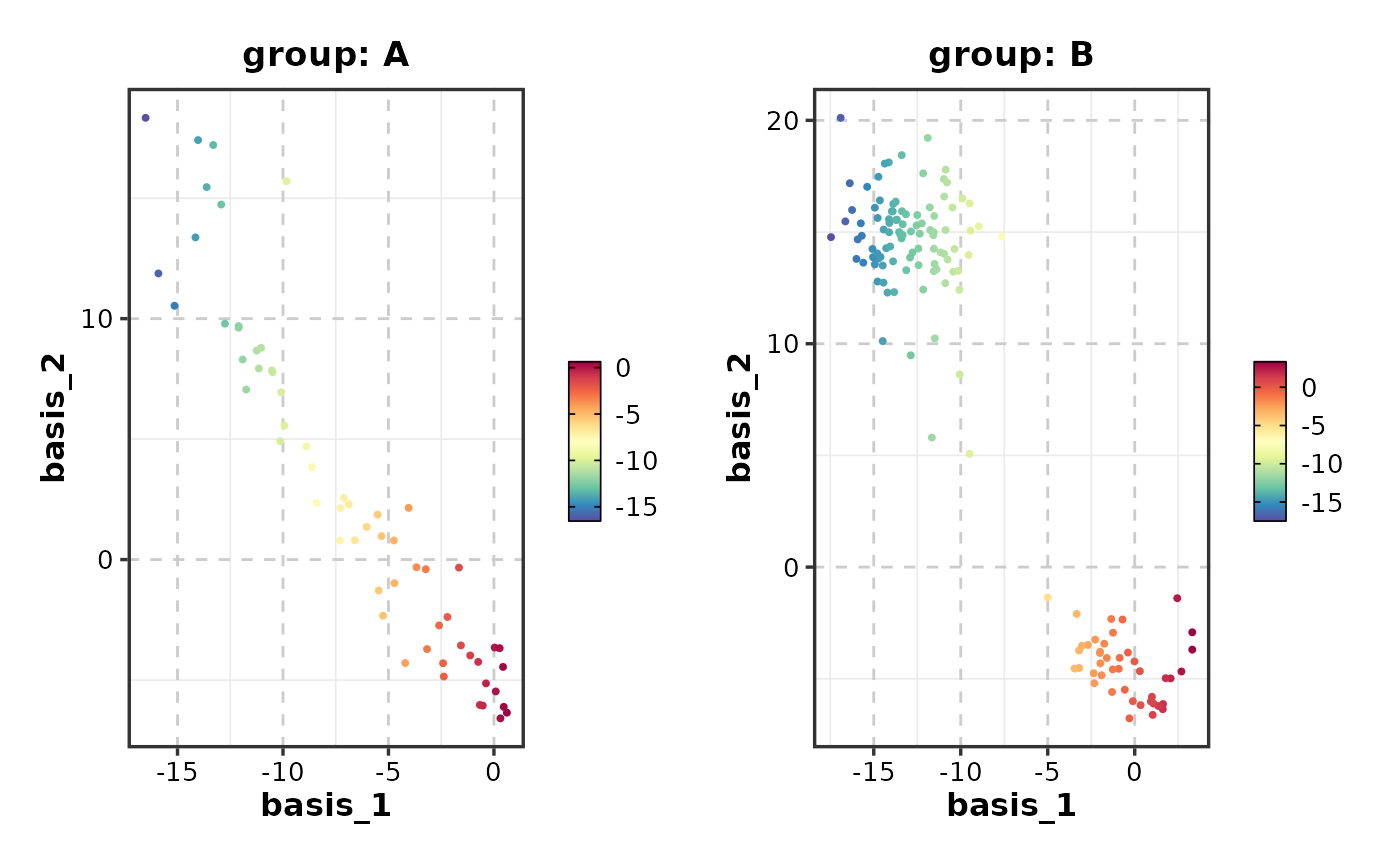
 # With splits
FeatureDimPlot(dim_example, features = "basis_1", split_by = "group")
# With splits
FeatureDimPlot(dim_example, features = "basis_1", split_by = "group")
 # }
# }