Creates vertically stacked violin plots for multiple features sharing the same x-axis grouping. A staple of single-cell RNA-seq marker gene visualization. Each feature gets its own row, with the x-axis showing cell types/clusters.
Usage
StackedViolinPlot(
  data,
  features,
  group_by,
  group_by_sep = "_",
  group_name = NULL,
  scale = c("width", "area"),
  trim = TRUE,
  strip_position = c("left", "right"),
  theme = "theme_ggforge",
  theme_args = list(),
  palette = "forge",
  palcolor = NULL,
  alpha = 0.8,
  x_text_angle = 45,
  legend.position = "none",
  legend.direction = "vertical",
  title = NULL,
  subtitle = NULL,
  seed = 8525,
  ...
)
Arguments
- data
A data frame containing the data to plot
- features
Character vector of column names for features to stack.
- group_by
Column for x-axis grouping (e.g., cell type).
- group_by_sep
Separator for multiple group_by columns.
- group_name
Legend title.
- scale
Violin scaling: "width" (equal width) or "area" (proportional area).
- trim
Whether to trim violins to data range.
- strip_position
Position of feature labels: "left" or "right".
- theme
Theme name (string) or theme function
- theme_args
List of arguments passed to theme function
- palette
Color palette name
- palcolor
Custom colors for palette
- alpha
Transparency level (0-1)
- x_text_angle
Angle for x-axis text.
- legend.position
Legend position: "none", "left", "right", "bottom", "top"
- legend.direction
Legend direction: "horizontal" or "vertical"
- title
Plot title
- subtitle
Plot subtitle
- seed
Random seed for reproducibility
- ...
Additional arguments passed to ViolinPlot.
See also
Other single-cell-plots:
DimPlot(),
FeatureDimPlot(),
TrajectoryPlot(),
VelocityPlot(),
spatialplots
Examples
# \donttest{
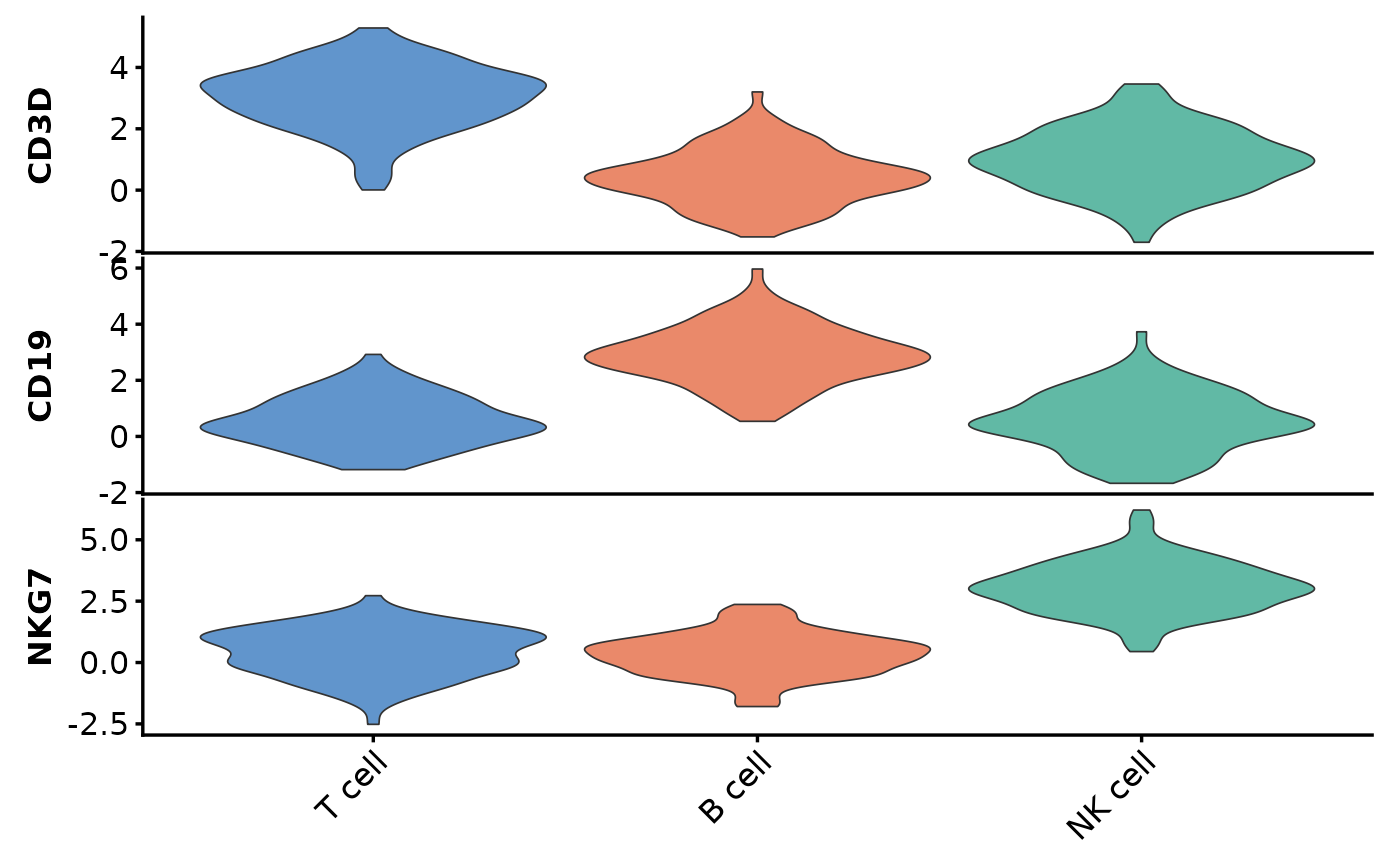
set.seed(42)
data <- data.frame(
cluster = rep(c("T cell", "B cell", "NK cell"), each = 100),
CD3D = c(rnorm(100, 3), rnorm(100, 0.5), rnorm(100, 1)),
CD19 = c(rnorm(100, 0.5), rnorm(100, 3), rnorm(100, 0.5)),
NKG7 = c(rnorm(100, 0.5), rnorm(100, 0.5), rnorm(100, 3))
)
StackedViolinPlot(data, features = c("CD3D", "CD19", "NKG7"),
group_by = "cluster")
 # }
# }