Creates pseudotime trajectory plots on dimension reduction coordinates. Overlays a principal curve representing the differentiation trajectory with pseudotime color mapping on top of cell scatter points.
Usage
TrajectoryPlot(
  data,
  dims = 1:2,
  pseudotime = NULL,
  group_by = NULL,
  group_by_sep = "_",
  branches = NULL,
  curve_data = NULL,
  curve_size = 1.2,
  curve_arrow = TRUE,
  pt_size = NULL,
  pt_alpha = 0.6,
  bg_color = "grey80",
  pseudotime_palette = "Spectral",
  split_by = NULL,
  split_by_sep = "_",
  facet_by = NULL,
  facet_scales = "fixed",
  facet_nrow = NULL,
  facet_ncol = NULL,
  facet_byrow = TRUE,
  theme = "theme_ggforge_grid",
  theme_args = list(),
  palette = "forge",
  palcolor = NULL,
  alpha = 1,
  aspect.ratio = 1,
  legend.position = "right",
  legend.direction = "vertical",
  title = NULL,
  subtitle = NULL,
  xlab = NULL,
  ylab = NULL,
  seed = 8525,
  combine = TRUE,
  nrow = NULL,
  ncol = NULL,
  byrow = TRUE,
  axes = NULL,
  axis_titles = NULL,
  guides = NULL,
  design = NULL,
  ...
)
Arguments
- data
A data frame containing the data to plot
- dims
Column names or indices for dimensions (x, y).
- pseudotime
Column for pseudotime values (continuous).
- group_by
Column for cell type grouping (shown as point color when pseudotime is mapped to a separate curve overlay).
- group_by_sep
Separator for multiple group_by columns.
- branches
Column indicating branch assignment (optional).
- curve_data
Optional data frame with curve coordinates (x, y columns matching dims). If NULL, a LOESS smooth through data is used.
- curve_size
Line width for trajectory curve.
- curve_arrow
Whether to add arrow to curve.
- pt_size
Point size.
- pt_alpha
Point transparency.
- bg_color
Background point color.
- pseudotime_palette
Palette for pseudotime gradient.
- split_by
Column name(s) to split data into multiple plots
- split_by_sep
Separator when concatenating multiple split_by columns
- facet_by
Column name(s) for faceting the plot
- facet_scales
Scales for facets: "fixed", "free", "free_x", "free_y"
- facet_nrow
Number of rows in facet layout
- facet_ncol
Number of columns in facet layout
- facet_byrow
Fill facets by row (TRUE) or column (FALSE)
- theme
Theme name (string) or theme function
- theme_args
List of arguments passed to theme function
- palette
Color palette name
- palcolor
Custom colors for palette
- alpha
Transparency level (0-1)
- aspect.ratio
Aspect ratio of plot panel
- legend.position
Legend position: "none", "left", "right", "bottom", "top"
- legend.direction
Legend direction: "horizontal" or "vertical"
- title
Plot title
- subtitle
Plot subtitle
- xlab
X-axis label
- ylab
Y-axis label
- seed
Random seed for reproducibility
- combine
Whether to combine split plots into one
- nrow
Number of rows when combining plots
- ncol
Number of columns when combining plots
- byrow
Fill combined plots by row
- axes
How to handle axes in combined plots ("keep", "collect", "collect_x", "collect_y")
- axis_titles
How to handle axis titles in combined plots
- guides
How to handle guides in combined plots ("collect", "keep", "auto")
- design
Custom layout design for combined plots
- ...
Additional arguments passed to atomic plotting functions.
See also
Other single-cell-plots:
DimPlot(),
FeatureDimPlot(),
StackedViolinPlot(),
VelocityPlot(),
spatialplots
Examples
# \donttest{
set.seed(42)
n <- 300
t <- seq(0, 2 * pi, length.out = n)
data <- data.frame(
UMAP1 = t + rnorm(n, 0, 0.3),
UMAP2 = sin(t) + rnorm(n, 0, 0.3),
pseudotime = seq(0, 1, length.out = n),
cluster = sample(c("A", "B", "C"), n, replace = TRUE)
)
TrajectoryPlot(data, dims = 1:2, pseudotime = "pseudotime")
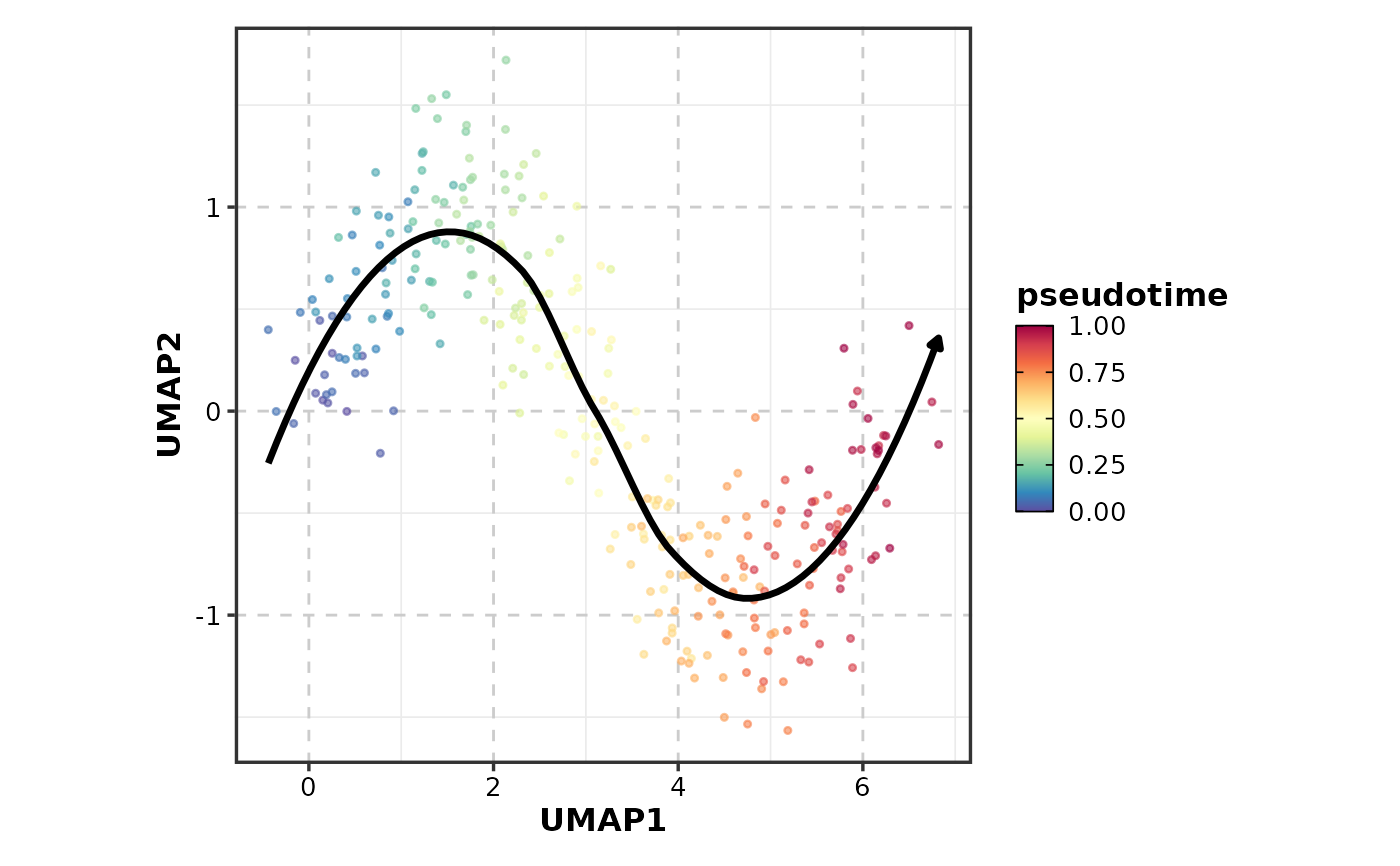 # }
# }