Functions for plotting spatial data including raster images, masks, shapes, and points.
These functions work with terra SpatRaster and SpatVector objects, as well as regular
data frames.
Usage
SpatImagePlot(
  data,
  ext = NULL,
  raster = NULL,
  raster_dpi = NULL,
  flip_y = TRUE,
  palette = "turbo",
  palcolor = NULL,
  palette_reverse = FALSE,
  alpha = 1,
  fill_name = NULL,
  return_layer = FALSE,
  theme = "theme_ggforge",
  theme_args = list(),
  legend.position = ifelse(return_layer, "none", "right"),
  legend.direction = "vertical",
  title = NULL,
  subtitle = NULL,
  xlab = NULL,
  ylab = NULL,
  seed = 8525
)

SpatMasksPlot(
  data,
  ext = NULL,
  flip_y = TRUE,
  add_border = TRUE,
  border_color = "black",
  border_size = 0.5,
  border_alpha = 1,
  palette = "turbo",
  palcolor = NULL,
  palette_reverse = FALSE,
  alpha = 1,
  fill_name = NULL,
  return_layer = FALSE,
  theme = "theme_ggforge",
  theme_args = list(),
  legend.position = "right",
  legend.direction = "vertical",
  title = NULL,
  subtitle = NULL,
  xlab = NULL,
  ylab = NULL,
  seed = 8525
)

SpatShapesPlot(
  data,
  x = NULL,
  y = NULL,
  group = NULL,
  ext = NULL,
  flip_y = TRUE,
  fill_by = NULL,
  border_color = "black",
  border_size = 0.5,
  border_alpha = 1,
  palette = NULL,
  palcolor = NULL,
  palette_reverse = FALSE,
  alpha = 1,
  fill_name = NULL,
  highlight = NULL,
  highlight_alpha = 1,
  highlight_size = 1,
  highlight_color = "black",
  highlight_stroke = 0.8,
  facet_scales = "fixed",
  facet_nrow = NULL,
  facet_ncol = NULL,
  facet_byrow = TRUE,
  return_layer = FALSE,
  theme = "theme_ggforge",
  theme_args = list(),
  legend.position = ifelse(return_layer, "none", "right"),
  legend.direction = "vertical",
  title = NULL,
  subtitle = NULL,
  xlab = NULL,
  ylab = NULL,
  seed = 8525
)

# S3 method for class 'SpatVector'
SpatShapesPlot(
  data,
  x = NULL,
  y = NULL,
  group = NULL,
  ext = NULL,
  flip_y = TRUE,
  fill_by = NULL,
  border_color = "black",
  border_size = 0.5,
  border_alpha = 1,
  palette = NULL,
  palcolor = NULL,
  palette_reverse = FALSE,
  alpha = 1,
  fill_name = NULL,
  highlight = NULL,
  highlight_alpha = 1,
  highlight_size = 1,
  highlight_color = "black",
  highlight_stroke = 0.8,
  facet_scales = "fixed",
  facet_nrow = NULL,
  facet_ncol = NULL,
  facet_byrow = TRUE,
  return_layer = FALSE,
  theme = "theme_ggforge",
  theme_args = list(),
  legend.position = ifelse(return_layer, "none", "right"),
  legend.direction = "vertical",
  title = NULL,
  subtitle = NULL,
  xlab = NULL,
  ylab = NULL,
  seed = 8525
)

# S3 method for class 'data.frame'
SpatShapesPlot(
  data,
  x,
  y,
  group,
  ext = NULL,
  flip_y = TRUE,
  fill_by = "grey90",
  border_color = "black",
  border_size = 0.5,
  border_alpha = 1,
  palette = NULL,
  palcolor = NULL,
  palette_reverse = FALSE,
  alpha = 1,
  fill_name = NULL,
  highlight = NULL,
  highlight_alpha = 1,
  highlight_size = 1,
  highlight_color = "black",
  highlight_stroke = 0.8,
  facet_scales = "fixed",
  facet_nrow = NULL,
  facet_ncol = NULL,
  facet_byrow = TRUE,
  return_layer = FALSE,
  theme = "theme_ggforge",
  theme_args = list(),
  legend.position = ifelse(return_layer, "none", "right"),
  legend.direction = "vertical",
  title = NULL,
  subtitle = NULL,
  xlab = NULL,
  ylab = NULL,
  seed = 8525
)

SpatPointsPlot(
  data,
  x = NULL,
  y = NULL,
  ext = NULL,
  flip_y = TRUE,
  color_by = NULL,
  size_by = NULL,
  size = NULL,
  fill_by = NULL,
  lower_quantile = 0,
  upper_quantile = 0.99,
  lower_cutoff = NULL,
  upper_cutoff = NULL,
  palette = NULL,
  palcolor = NULL,
  palette_reverse = FALSE,
  alpha = 1,
  color_name = NULL,
  size_name = NULL,
  shape = 16,
  border_color = "black",
  border_size = 0.5,
  border_alpha = 1,
  raster = NULL,
  raster_dpi = c(512, 512),
  hex = FALSE,
  hex_linewidth = 0.5,
  hex_count = FALSE,
  hex_bins = 50,
  hex_binwidth = NULL,
  label = FALSE,
  label_size = 4,
  label_fg = "white",
  label_bg = "black",
  label_bg_r = 0.1,
  label_repel = FALSE,
  label_repulsion = 20,
  label_pt_size = 1,
  label_pt_color = "black",
  label_segment_color = "black",
  label_insitu = FALSE,
  label_pos = c("median", "mean", "max", "min", "first", "last", "center", "random"),
  highlight = NULL,
  highlight_alpha = 1,
  highlight_size = 1,
  highlight_color = "black",
  highlight_stroke = 0.8,
  graph = NULL,
  graph_x = NULL,
  graph_y = NULL,
  graph_xend = NULL,
  graph_yend = NULL,
  graph_value = NULL,
  edge_size = c(0.05, 0.5),
  edge_alpha = 0.1,
  edge_color = "grey40",
  facet_scales = "fixed",
  facet_nrow = NULL,
  facet_ncol = NULL,
  facet_byrow = TRUE,
  return_layer = FALSE,
  theme = "theme_ggforge",
  theme_args = list(),
  legend.position = ifelse(return_layer, "none", "right"),
  legend.direction = "vertical",
  title = NULL,
  subtitle = NULL,
  xlab = NULL,
  ylab = NULL,
  seed = 8525
)
Arguments
- data
A data.frame with spatial coordinates
- ext
Spatial extent (SpatExtent or numeric vector of length 4)
- raster
Whether to rasterize points
- raster_dpi
Rasterization resolution
- flip_y
Whether to flip y-axis
- palette
Color palette name
- palcolor
Custom colors
- palette_reverse
Reverse palette
- alpha
Transparency level
- fill_name
Legend title
- return_layer
Whether to return layers only
- theme
Theme name or function
- theme_args
Theme arguments
- legend.position
Legend position
- legend.direction
Legend direction
- title
Plot title
- subtitle
Plot subtitle
- xlab
X-axis label
- ylab
Y-axis label
- seed
Random seed
- add_border
Whether to add border around masks
- border_color
Border color
- border_size
Border width
- border_alpha
Border transparency
- x
X-coordinate column name
- y
Y-coordinate column name
- group
Grouping column (for data.frame)
- fill_by
Alternative to color_by (for compatibility)
- highlight
Rows to highlight
- highlight_alpha
Highlight transparency
- highlight_size
Highlight size
- highlight_color
Highlight color
- highlight_stroke
Highlight stroke width
- facet_scales
Facet scales
- facet_nrow
Number of facet rows
- facet_ncol
Number of facet columns
- facet_byrow
Fill facets by row
- color_by
Column to color points by
- size_by
Column to size points by
- size
Fixed point size (alternative to size_by)
- lower_quantile
Lower quantile for color scaling
- upper_quantile
Upper quantile for color scaling
- lower_cutoff
Lower cutoff for color values
- upper_cutoff
Upper cutoff for color values
- color_name
Legend title for color
- size_name
Legend title for size
- shape
Point shape
- hex
Whether to use hex binning
- hex_linewidth
Hex border width
- hex_count
Whether to count in hex bins
- hex_bins
Number of hex bins
- hex_binwidth
Hex bin width
- label
Whether to add labels
- label_size
Label size
- label_fg
Label foreground color
- label_bg
Label background color
- label_bg_r
Label background ratio
- label_repel
Whether to repel labels
- label_repulsion
Label repulsion force
- label_pt_size
Label point size
- label_pt_color
Label point color
- label_segment_color
Label segment color
- label_insitu
Whether to use actual labels in situ
- label_pos
Label position function
- graph
Graph/network adjacency matrix or data
- graph_x
Graph x column
- graph_y
Graph y column
- graph_xend
Graph xend column
- graph_yend
Graph yend column
- graph_value
Graph value column
- edge_size
Edge size range
- edge_alpha
Edge transparency
- edge_color
Edge color
Value
ggplot object or list of layers
ggplot object or list of layers
ggplot object or list of layers
ggplot object or list of layers
See also
Other single-cell-plots:
DimPlot(),
FeatureDimPlot(),
StackedViolinPlot(),
TrajectoryPlot(),
VelocityPlot()
Other single-cell-plots:
DimPlot(),
FeatureDimPlot(),
StackedViolinPlot(),
TrajectoryPlot(),
VelocityPlot()
Other single-cell-plots:
DimPlot(),
FeatureDimPlot(),
StackedViolinPlot(),
TrajectoryPlot(),
VelocityPlot()
Other single-cell-plots:
DimPlot(),
FeatureDimPlot(),
StackedViolinPlot(),
TrajectoryPlot(),
VelocityPlot()
Examples
# \donttest{
# Create a simple raster
library(terra)
#> terra 1.9.27
#>
#> Attaching package: ‘terra’
#> The following objects are masked from ‘package:Hmisc’:
#>
#> describe, mask, zoom
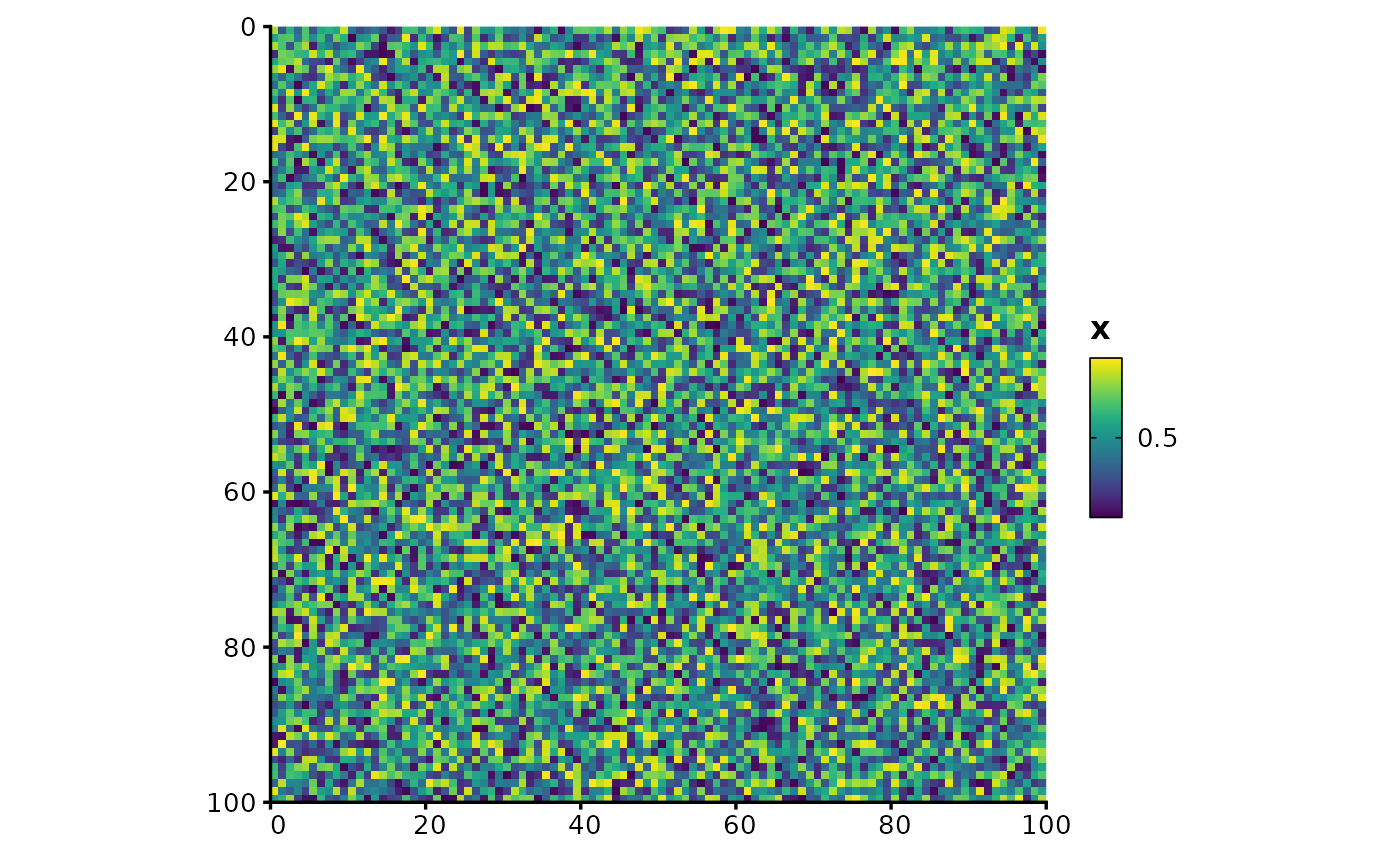
r <- rast(ncols = 100, nrows = 100, xmin = 0, xmax = 100, ymin = 0, ymax = 100)
values(r) <- runif(ncell(r))
# Plot raster image
SpatImagePlot(r, palette = "viridis")
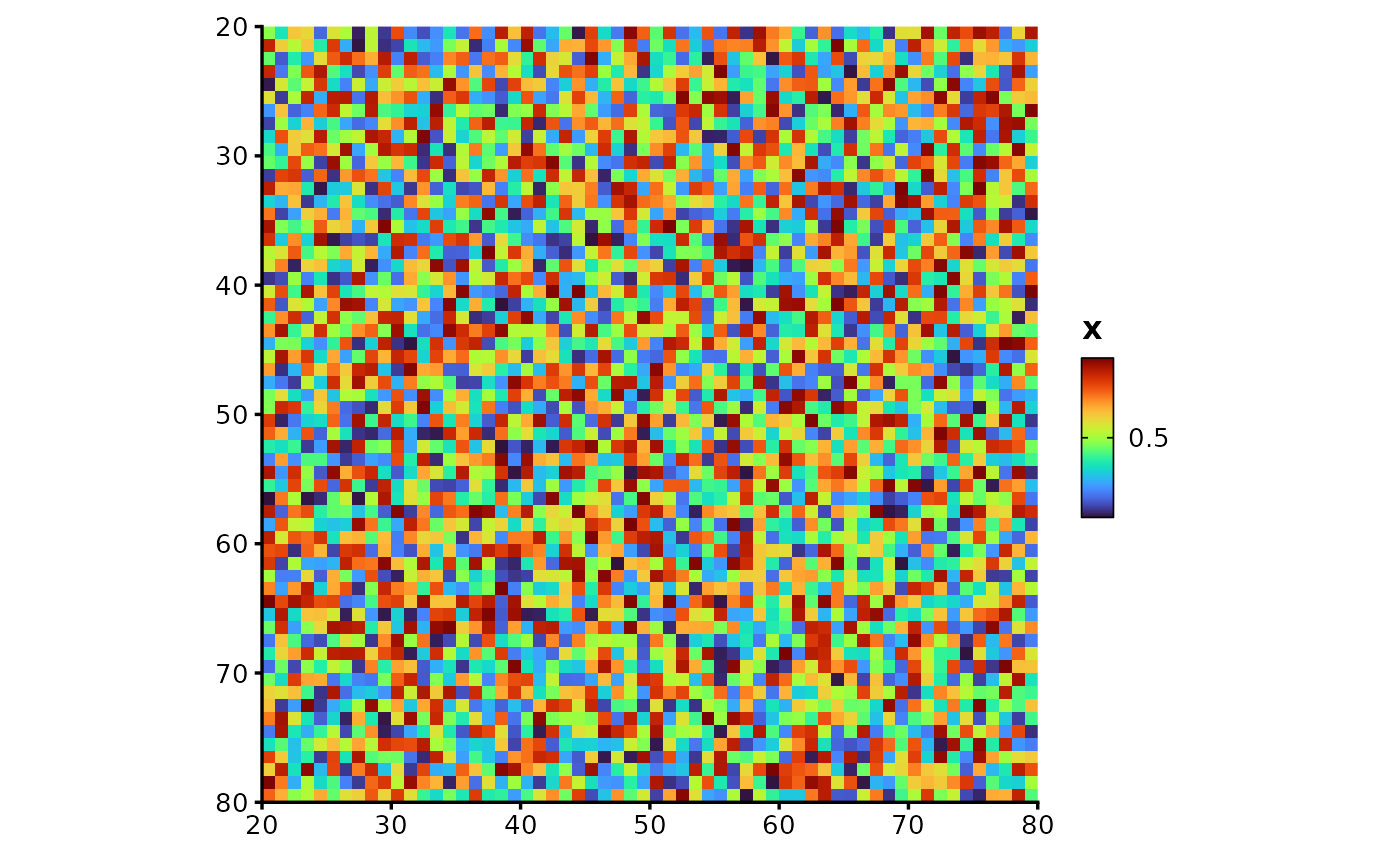
 # Plot with custom extent
SpatImagePlot(r, ext = c(20, 80, 20, 80), palette = "turbo")
# Plot with custom extent
SpatImagePlot(r, ext = c(20, 80, 20, 80), palette = "turbo")
 # }
# \donttest{
# Create a mask raster
library(terra)
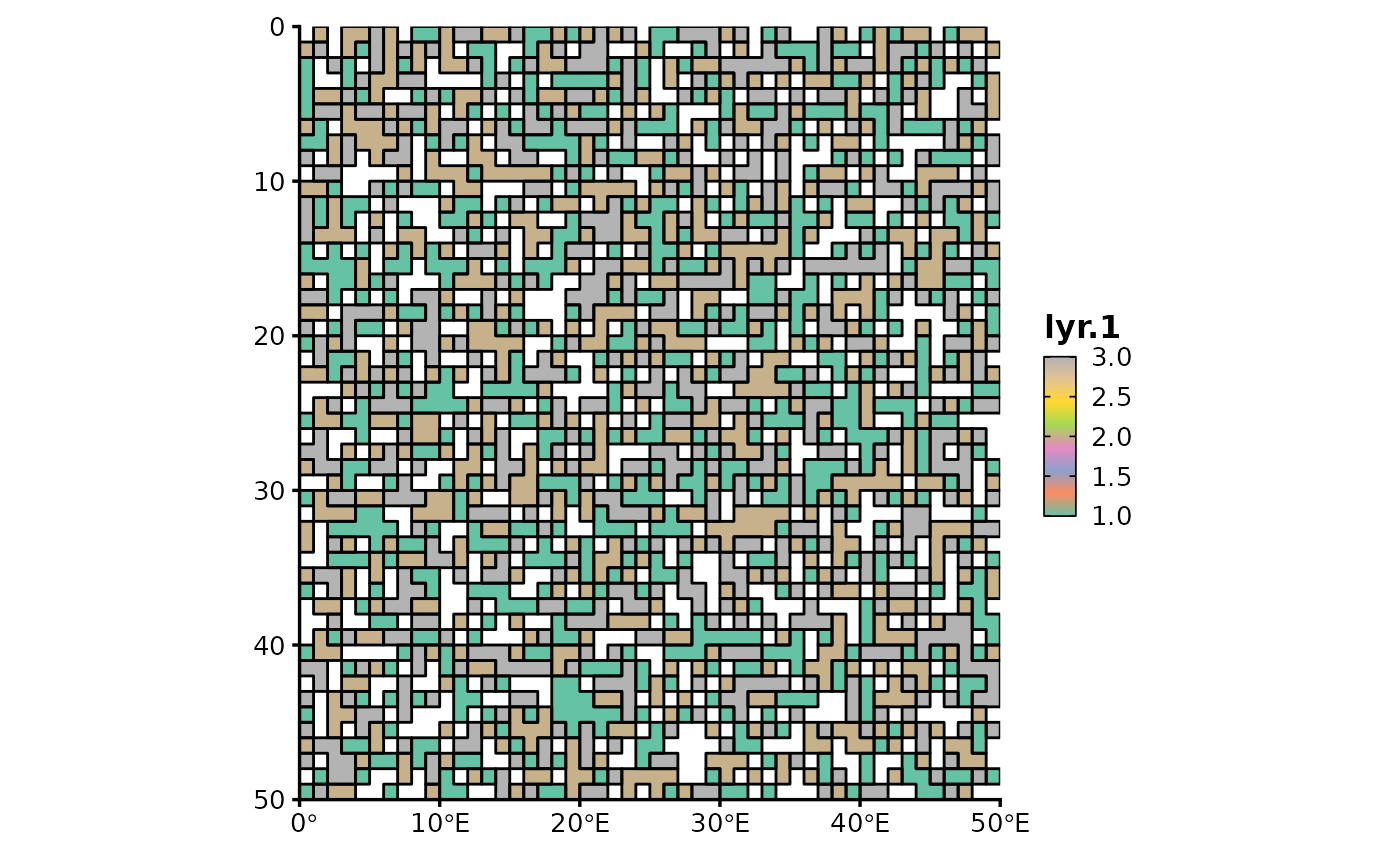
r <- rast(ncols = 50, nrows = 50, xmin = 0, xmax = 50, ymin = 0, ymax = 50)
values(r) <- sample(0:3, ncell(r), replace = TRUE)
# Plot masks with borders
SpatMasksPlot(r, add_border = TRUE, palette = "Set2")
# }
# \donttest{
# Create a mask raster
library(terra)
r <- rast(ncols = 50, nrows = 50, xmin = 0, xmax = 50, ymin = 0, ymax = 50)
values(r) <- sample(0:3, ncell(r), replace = TRUE)
# Plot masks with borders
SpatMasksPlot(r, add_border = TRUE, palette = "Set2")
 # }
# \donttest{
# Create polygon data
library(terra)
v <- vect("POLYGON ((0 0, 10 0, 10 10, 0 10, 0 0))")
# Plot shapes
SpatShapesPlot(v, fill_by = "grey80", border_color = "black")
# }
# \donttest{
# Create polygon data
library(terra)
v <- vect("POLYGON ((0 0, 10 0, 10 10, 0 10, 0 0))")
# Plot shapes
SpatShapesPlot(v, fill_by = "grey80", border_color = "black")
 # Plot with data.frame
poly_df <- data.frame(
x = c(0, 10, 10, 0),
y = c(0, 0, 10, 10),
group = rep(1, 4)
)
SpatShapesPlot(poly_df, x = "x", y = "y", group = "group")
# Plot with data.frame
poly_df <- data.frame(
x = c(0, 10, 10, 0),
y = c(0, 0, 10, 10),
group = rep(1, 4)
)
SpatShapesPlot(poly_df, x = "x", y = "y", group = "group")
 # }
# \donttest{
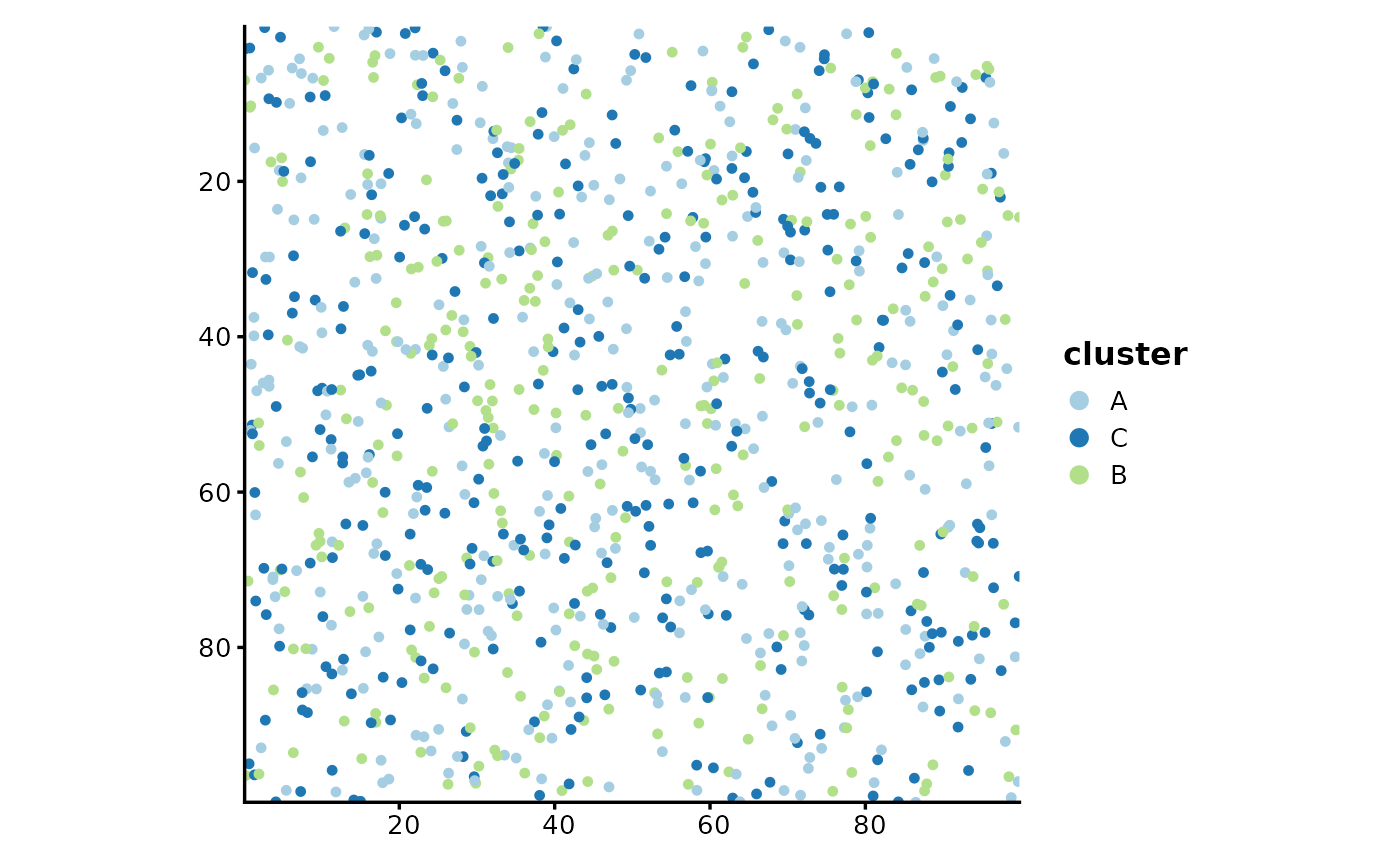
# Create spatial point data
spatial_data <- data.frame(
x = runif(1000, 0, 100),
y = runif(1000, 0, 100),
cluster = sample(c("A", "B", "C"), 1000, replace = TRUE),
value = rnorm(1000)
)
# Basic point plot
SpatPointsPlot(spatial_data, x = "x", y = "y", color_by = "cluster")
# }
# \donttest{
# Create spatial point data
spatial_data <- data.frame(
x = runif(1000, 0, 100),
y = runif(1000, 0, 100),
cluster = sample(c("A", "B", "C"), 1000, replace = TRUE),
value = rnorm(1000)
)
# Basic point plot
SpatPointsPlot(spatial_data, x = "x", y = "y", color_by = "cluster")
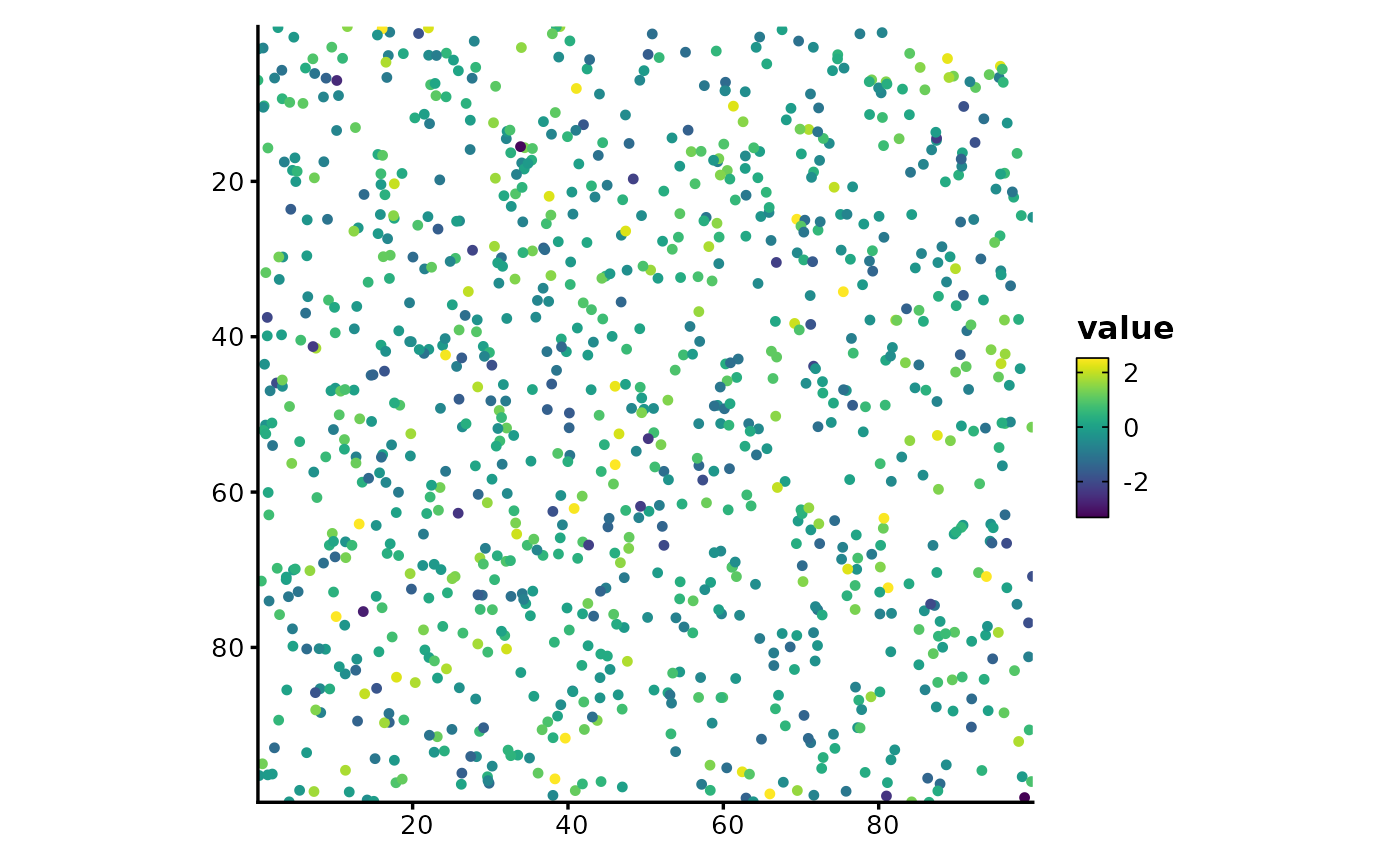
 # Continuous color scale
SpatPointsPlot(spatial_data, x = "x", y = "y", color_by = "value", palette = "viridis")
# Continuous color scale
SpatPointsPlot(spatial_data, x = "x", y = "y", color_by = "value", palette = "viridis")
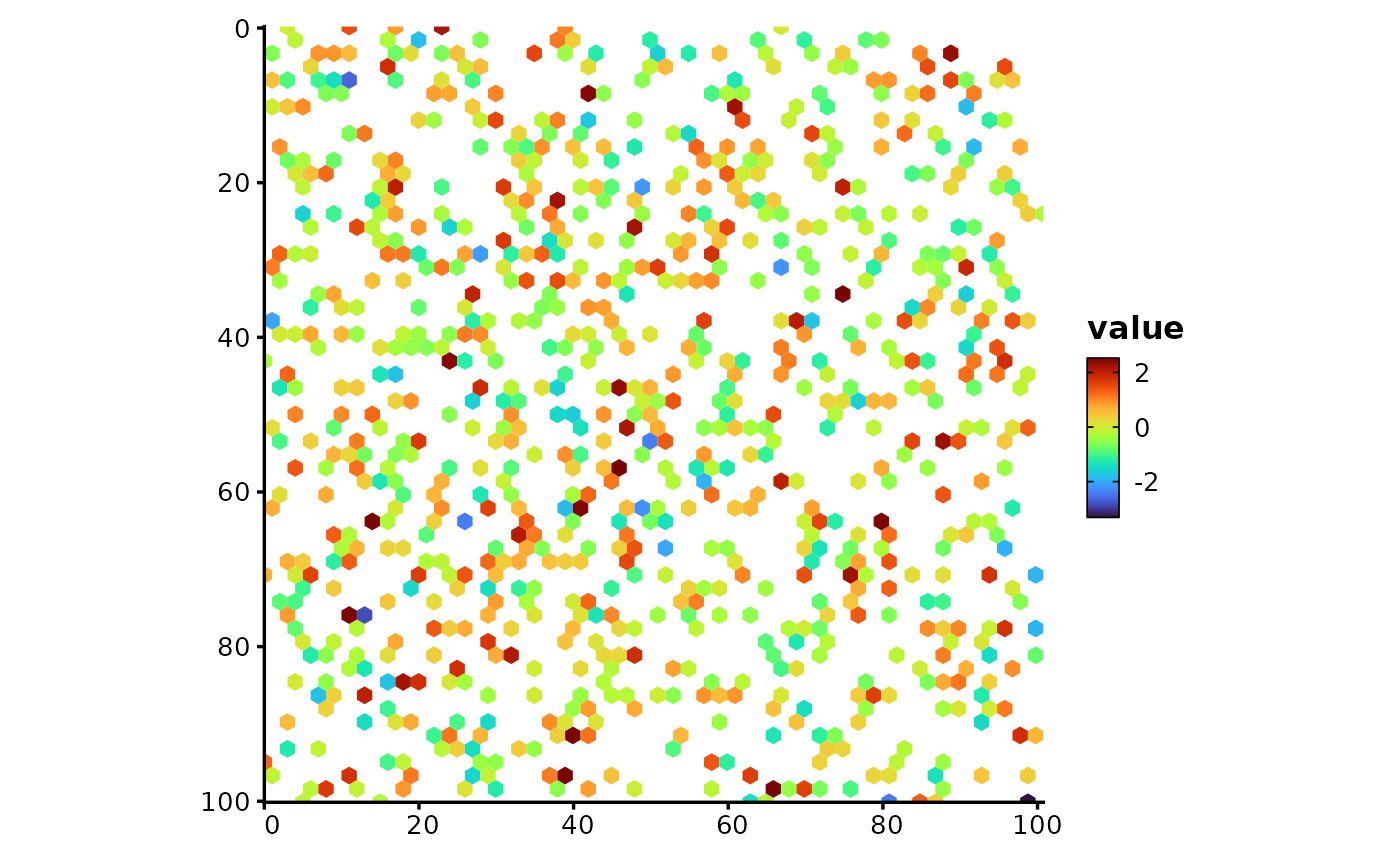
 # Hex binning for large datasets
SpatPointsPlot(spatial_data, x = "x", y = "y", color_by = "value", hex = TRUE)
# Hex binning for large datasets
SpatPointsPlot(spatial_data, x = "x", y = "y", color_by = "value", hex = TRUE)
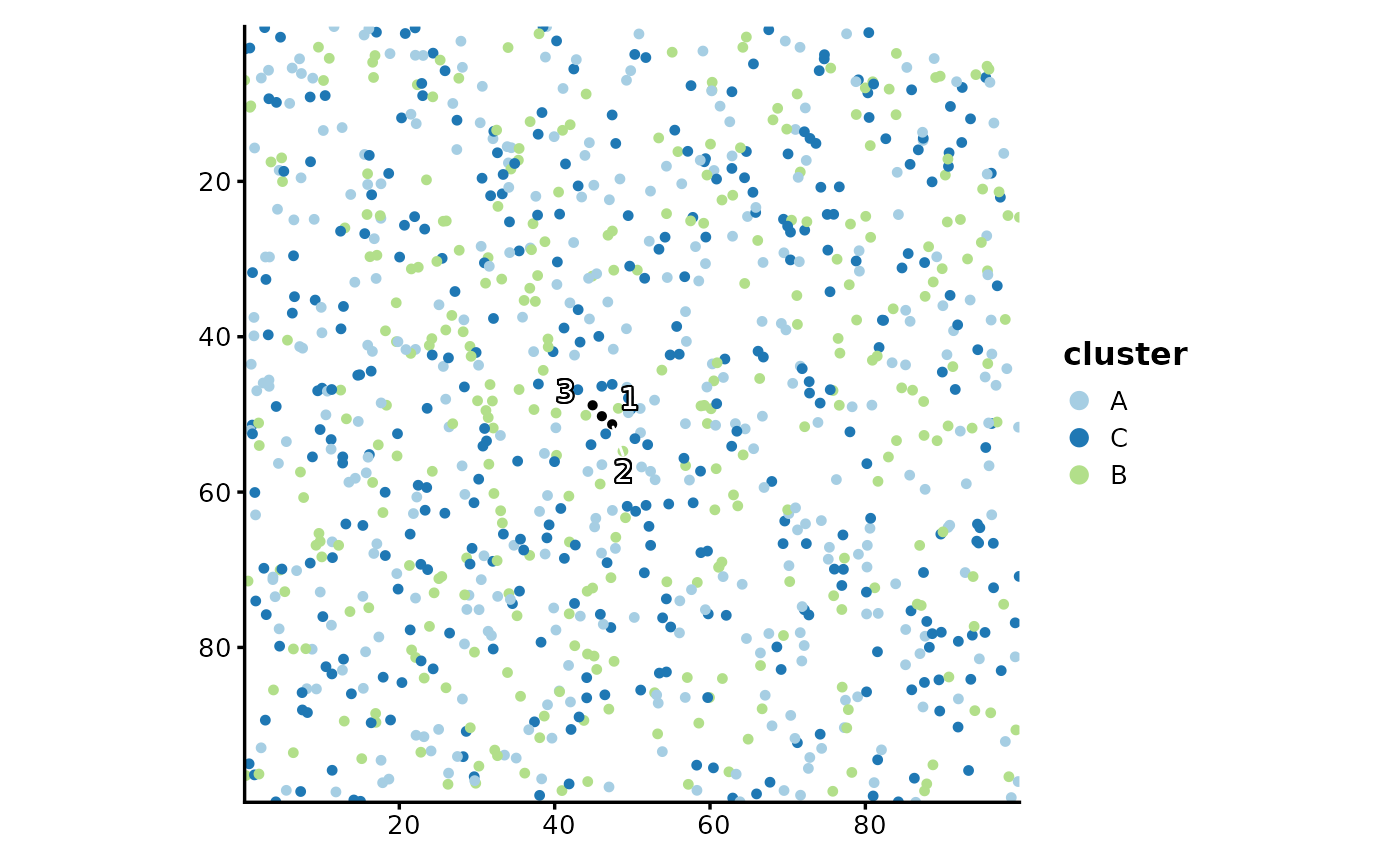
 # Add labels
SpatPointsPlot(spatial_data,
x = "x", y = "y", color_by = "cluster",
label = TRUE, label_repel = TRUE
)
# Add labels
SpatPointsPlot(spatial_data,
x = "x", y = "y", color_by = "cluster",
label = TRUE, label_repel = TRUE
)
 # }
# }