Visualizes clusterings at different resolutions using a tree structure. This function wraps the clustree package with consistent ggforge styling.
Usage
ClustreePlot(
  data,
  prefix,
  flip = FALSE,
  split_by = NULL,
  split_by_sep = "_",
  palette = "forge",
  palcolor = NULL,
  edge_palette = "Spectral",
  edge_palcolor = NULL,
  alpha = 0.85,
  aspect.ratio = NULL,
  legend.position = "right",
  legend.direction = "vertical",
  title = NULL,
  subtitle = NULL,
  xlab = NULL,
  ylab = NULL,
  expand = c(0.1, 0.1),
  theme = "theme_ggforge",
  theme_args = list(),
  combine = TRUE,
  nrow = NULL,
  ncol = NULL,
  byrow = TRUE,
  seed = 8525,
  axes = NULL,
  axis_titles = axes,
  guides = NULL,
  design = NULL,
  ...
)
Arguments
- data
A data frame containing the data to plot
- prefix
A character string of the prefix of the columns to plot. The columns with the prefix will be used to plot the tree.
- flip
A logical value to flip the tree (horizontal layout).
- split_by
Column name(s) to split data into multiple plots
- split_by_sep
Separator when concatenating multiple split_by columns
- palette
Color palette name
- palcolor
Custom colors for palette
- edge_palette
A character string of the palette name to color the edges.
- edge_palcolor
A character vector of colors to color the edges.
- alpha
Transparency level (0-1)
- aspect.ratio
Aspect ratio of plot panel
- legend.position
Legend position: "none", "left", "right", "bottom", "top"
- legend.direction
Legend direction: "horizontal" or "vertical"
- title
Plot title
- subtitle
Plot subtitle
- xlab
X-axis label
- ylab
Y-axis label
- expand
Expansion values for plot limits (CSS-like notation).
- theme
Theme name (string) or theme function
- theme_args
List of arguments passed to theme function
- combine
Whether to combine split plots into one
- nrow
Number of rows when combining plots
- ncol
Number of columns when combining plots
- byrow
Fill combined plots by row
- seed
Random seed for reproducibility
- axes
How to handle axes in combined plots ("keep", "collect", "collect_x", "collect_y")
- axis_titles
How to handle axis titles in combined plots
- guides
How to handle guides in combined plots ("collect", "keep", "auto")
- design
Custom layout design for combined plots
- ...
Other arguments passed to
clustree::clustree.
See also
Other specialized-plots:
BeeswarmPlot(),
ChordPlot(),
DendrogramPlot(),
Heatmap(),
PieChart(),
RadarPlot(),
RarefactionPlot(),
RingPlot(),
SplitBarPlot(),
SunburstPlot(),
WordCloudPlot()
Examples
# \donttest{
set.seed(8525)
N <- 100
data <- data.frame(
p.0.4 = sample(LETTERS[1:5], N, replace = TRUE),
p.0.5 = sample(LETTERS[1:6], N, replace = TRUE),
p.0.6 = sample(LETTERS[1:7], N, replace = TRUE),
p.0.7 = sample(LETTERS[1:8], N, replace = TRUE),
p.0.8 = sample(LETTERS[1:9], N, replace = TRUE),
p.0.9 = sample(LETTERS[1:10], N, replace = TRUE),
p.1 = sample(LETTERS[1:30], N, replace = TRUE),
split = sample(1:2, N, replace = TRUE)
)
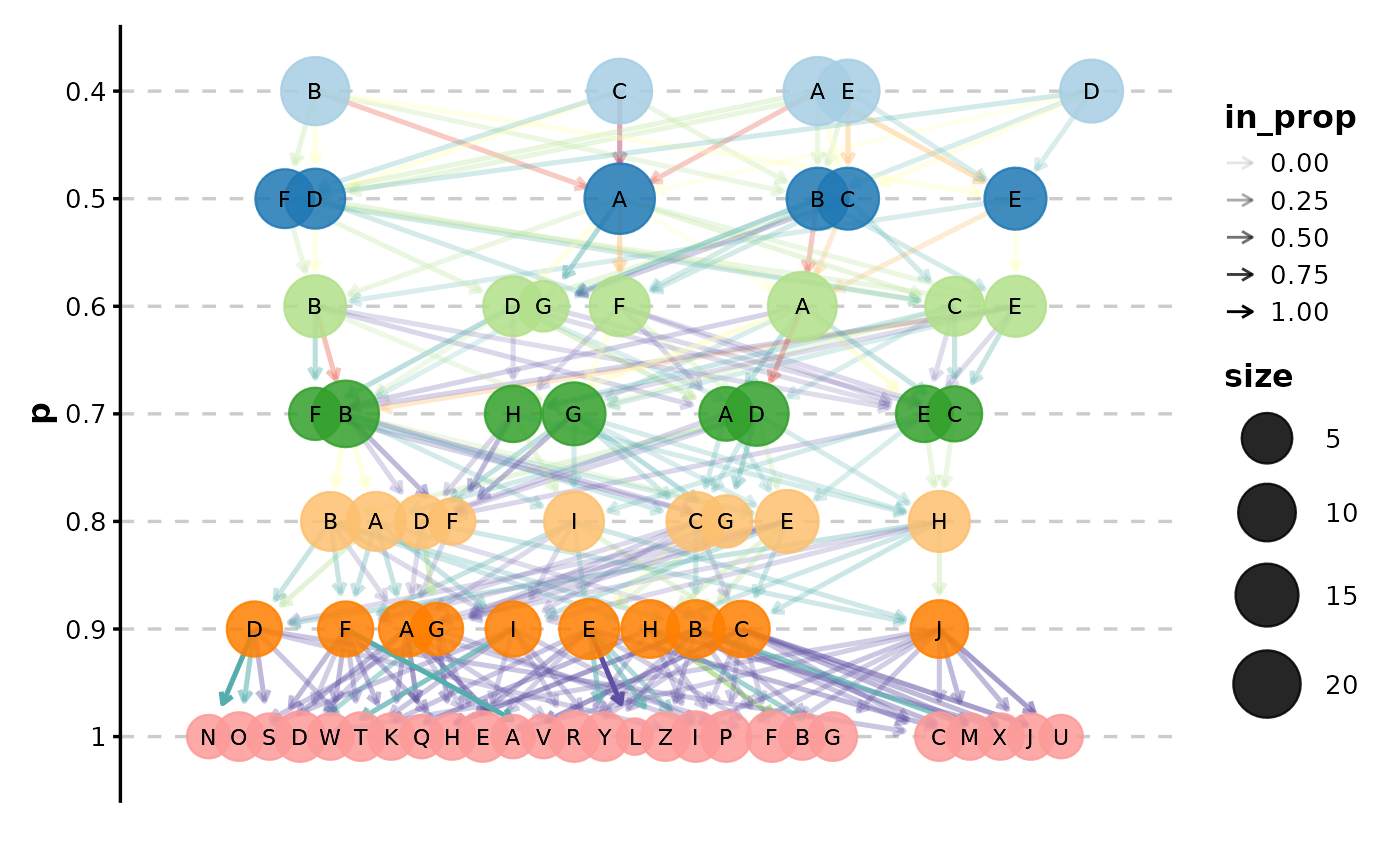
ClustreePlot(data, prefix = "p")
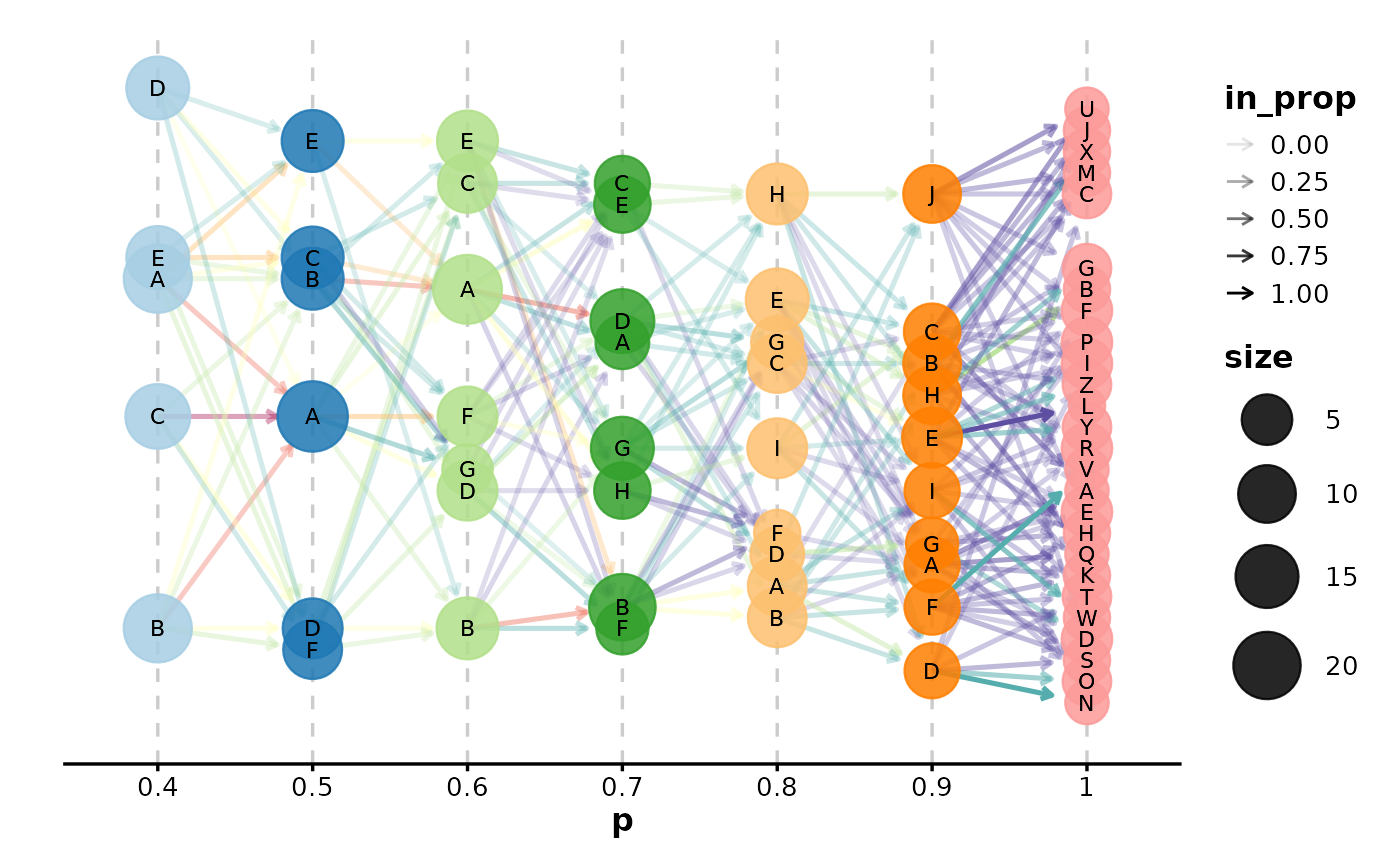
 ClustreePlot(data, prefix = "p", flip = TRUE)
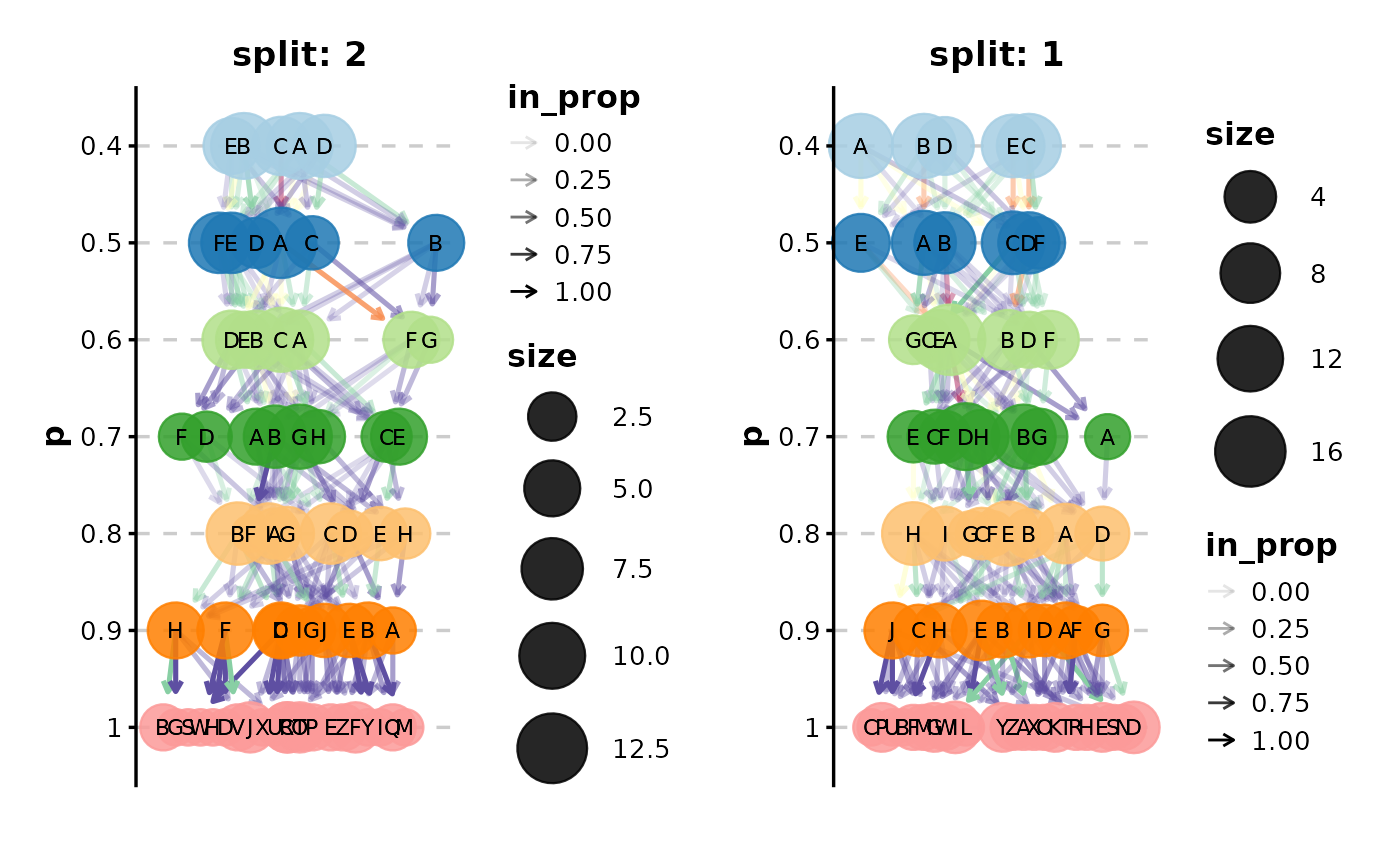
 ClustreePlot(data, prefix = "p", split_by = "split")
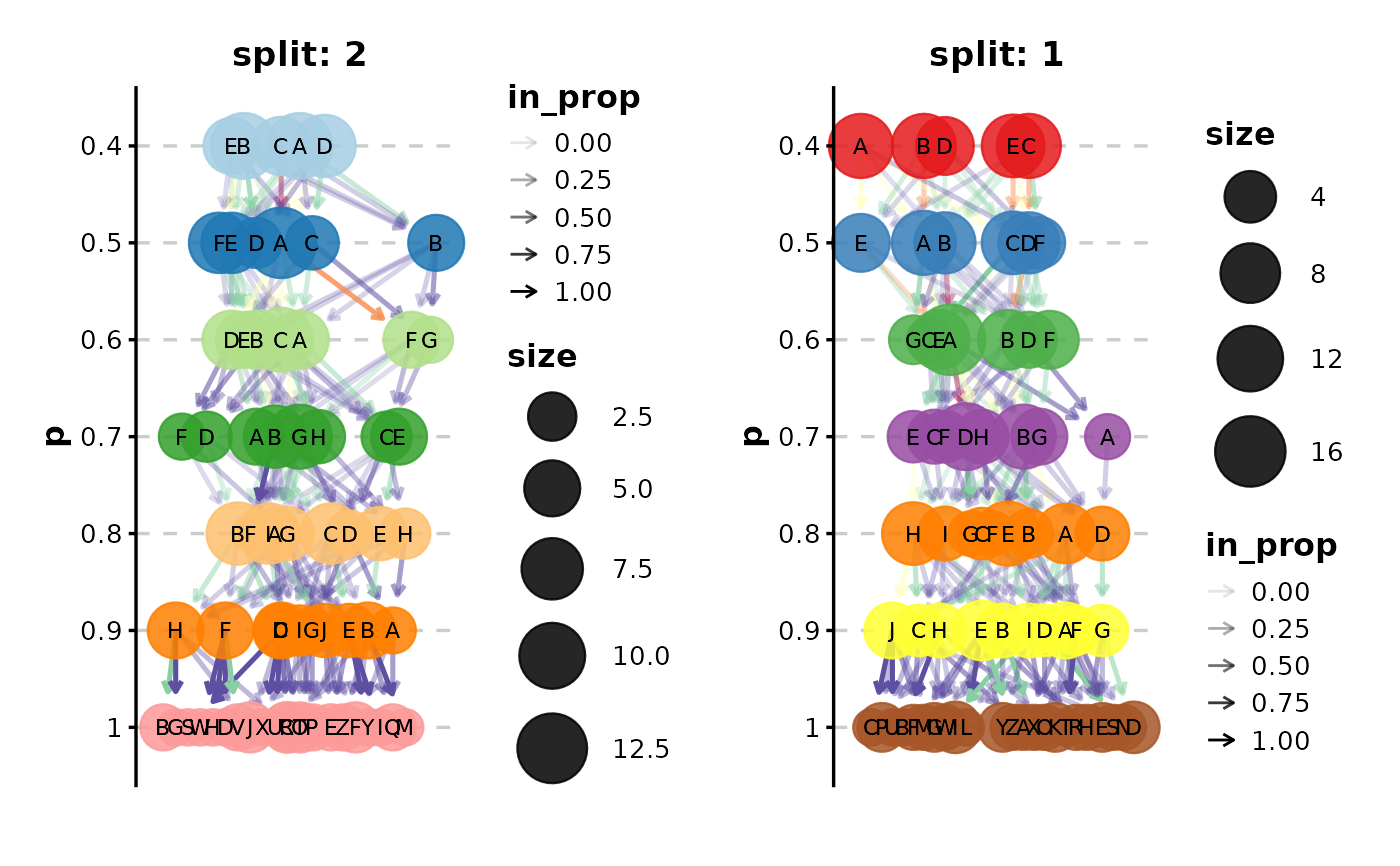
 ClustreePlot(data,
prefix = "p", split_by = "split",
palette = c("1" = "Set1", "2" = "Paired")
)
ClustreePlot(data,
prefix = "p", split_by = "split",
palette = c("1" = "Set1", "2" = "Paired")
)
 # }
# }