Generate rarefaction/extrapolation curves for diversity analysis using iNEXT. This function visualizes species diversity estimates with different levels of sampling effort.
Usage
RarefactionPlot(
  data,
  type = 1,
  se = NULL,
  group_by = "group",
  group_by_sep = "_",
  group_name = NULL,
  split_by = NULL,
  split_by_sep = "_",
  theme = "theme_ggforge",
  theme_args = list(),
  palette = "Spectral",
  palcolor = NULL,
  alpha = 0.2,
  pt_size = 3,
  line_width = 1,
  facet_by = NULL,
  facet_scales = "fixed",
  facet_ncol = NULL,
  facet_nrow = NULL,
  facet_byrow = TRUE,
  aspect.ratio = NULL,
  legend.position = "right",
  legend.direction = "vertical",
  title = NULL,
  subtitle = NULL,
  xlab = NULL,
  ylab = NULL,
  seed = 8525,
  combine = TRUE,
  nrow = NULL,
  ncol = NULL,
  byrow = TRUE,
  axes = NULL,
  axis_titles = axes,
  guides = NULL,
  design = NULL,
  ...
)
Arguments
- data
An iNEXT object or a list of data that will be handled by iNEXT::iNEXT.
- type
Three types of plots: sample-size-based rarefaction/extrapolation curve (
type = 1); sample completeness curve (type = 2); coverage-based rarefaction/extrapolation curve (type = 3).- se
A logical variable to display confidence interval around the estimated sampling curve. Default to
NULLwhich means TRUE if the data has the lower and upper bounds.- group_by
A character string indicating how to group the data (color the lines). Possible values are "q" and "group"
- group_by_sep
A character string indicating how to separate the group_by column if both "q" and "group" are used. Default to "_".
- group_name
A character string indicating the name of the group, showing as the legend title.
- split_by
A character string indicating how to split the data and plots. Possible values are "q" and "group"
- split_by_sep
Separator when concatenating multiple split_by columns
- theme
Theme name (string) or theme function
- theme_args
List of arguments passed to theme function
- palette
Color palette name
- palcolor
Custom colors for palette
- alpha
Transparency level (0-1)
- pt_size
A numeric value specifying the size of the points.
- line_width
A numeric value specifying the width of the lines.
- facet_by
A character string indicating how to facet the data and plots. Possible values are "q" and "group"
- facet_scales
Scales for facets: "fixed", "free", "free_x", "free_y"
- facet_ncol
Number of columns in facet layout
- facet_nrow
Number of rows in facet layout
- facet_byrow
Fill facets by row (TRUE) or column (FALSE)
- aspect.ratio
Aspect ratio of plot panel
- legend.position
Legend position: "none", "left", "right", "bottom", "top"
- legend.direction
Legend direction: "horizontal" or "vertical"
- title
Plot title
- subtitle
Plot subtitle
- xlab
X-axis label
- ylab
Y-axis label
- seed
Random seed for reproducibility
- combine
Whether to combine split plots into one
- nrow
Number of rows when combining plots
- ncol
Number of columns when combining plots
- byrow
Fill combined plots by row
- axes
How to handle axes in combined plots ("keep", "collect", "collect_x", "collect_y")
- axis_titles
How to handle axis titles in combined plots
- guides
How to handle guides in combined plots ("collect", "keep", "auto")
- design
Custom layout design for combined plots
- ...
Additional arguments to pass to iNEXT::iNEXT when
datais not an iNEXT object.
See also
Other specialized-plots:
BeeswarmPlot(),
ChordPlot(),
ClustreePlot(),
DendrogramPlot(),
Heatmap(),
PieChart(),
RadarPlot(),
RingPlot(),
SplitBarPlot(),
SunburstPlot(),
WordCloudPlot()
Examples
# \donttest{
set.seed(8525)
spider <- list(
Girdled = c(46, 22, 17, 15, 15, 9, 8, 6, 6, 4, rep(2, 4), rep(1, 12)),
Logged = c(
88, 22, 16, 15, 13, 10, 8, 8, 7, 7, 7, 5, 4, 4, 4, 3, 3, 3, 3,
2, 2, 2, 2, rep(1, 14)
)
)
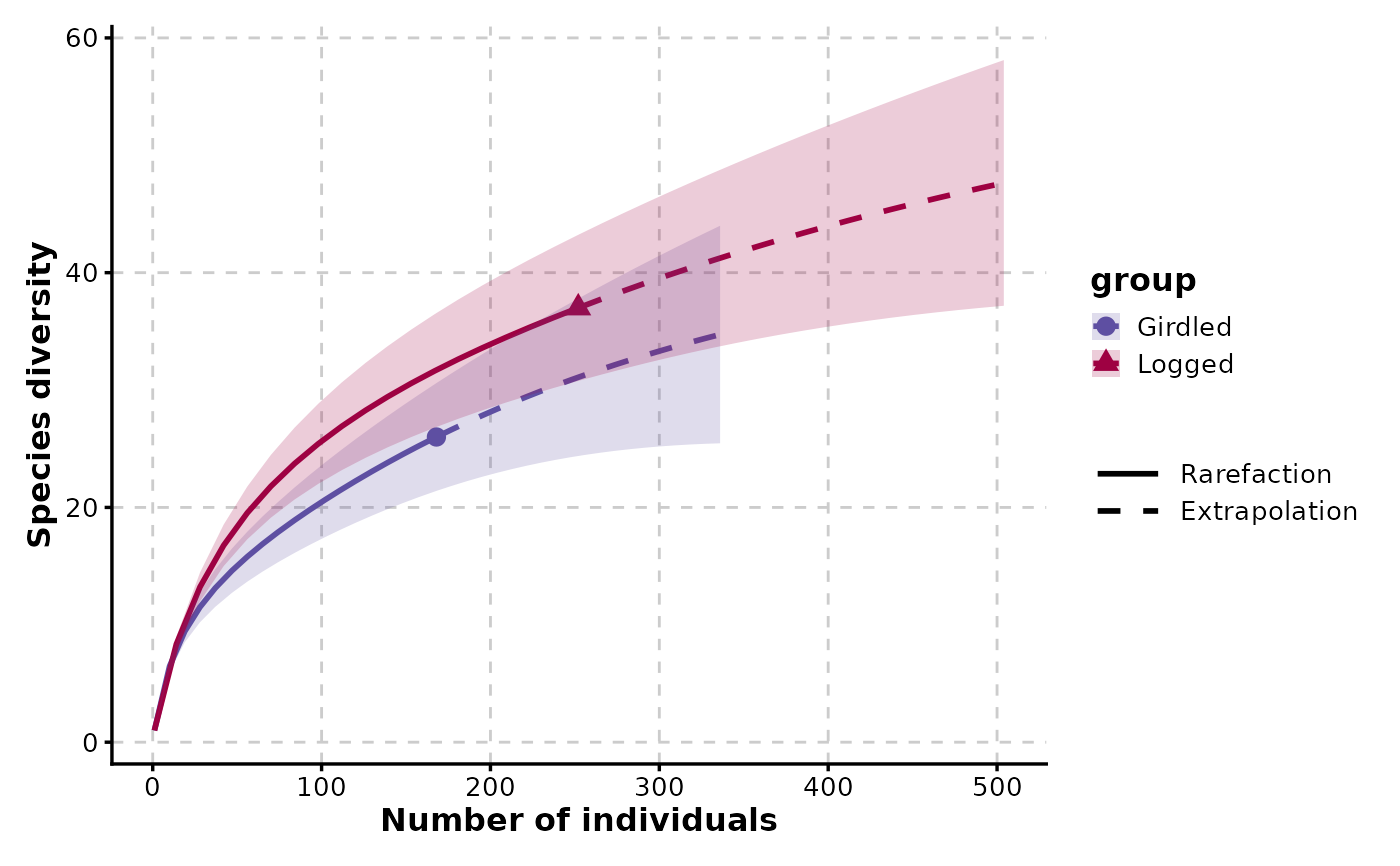
RarefactionPlot(spider)
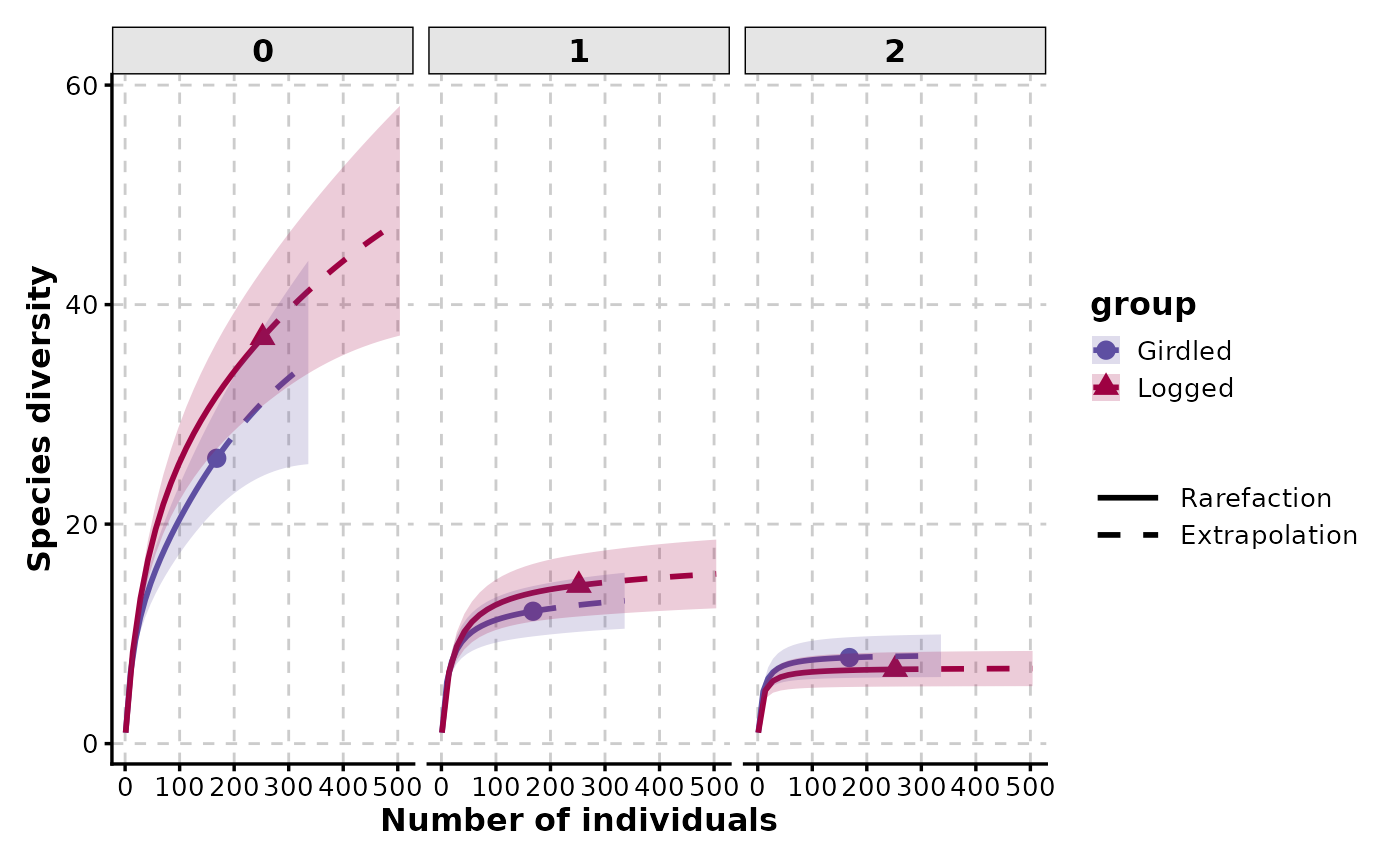
 RarefactionPlot(spider, q = c(0, 1, 2), facet_by = "q")
 RarefactionPlot(spider, q = c(0, 1, 2), split_by = "q")
 RarefactionPlot(spider,
q = c(0, 1, 2), split_by = "q",
palette = c("0" = "Paired", "1" = "Set1", "2" = "Dark2")
)
RarefactionPlot(spider,
q = c(0, 1, 2), split_by = "q",
palette = c("0" = "Paired", "1" = "Set1", "2" = "Dark2")
)
 RarefactionPlot(spider,
q = c(0, 1, 2), group_by = "q",
facet_by = "group", palette = "Set1", type = 3
)
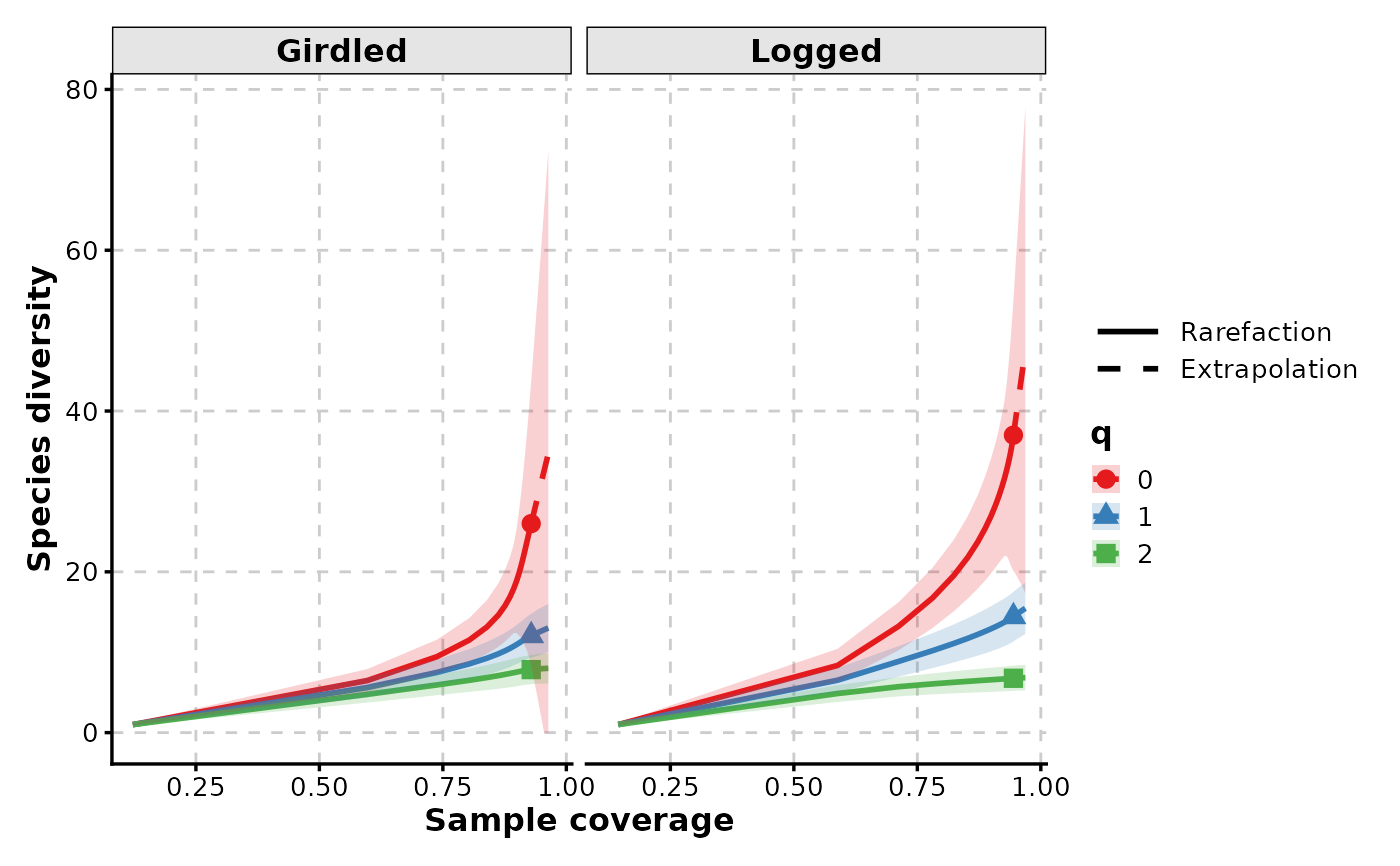
RarefactionPlot(spider,
q = c(0, 1, 2), group_by = "q",
facet_by = "group", palette = "Set1", type = 3
)
 # }
# }