Create a radar plot (circular grid) or spider plot (polygonal grid) for visualizing multivariate data across multiple categories.
Usage
RadarPlot(
  data,
  x,
  x_sep = "_",
  group_by = NULL,
  group_by_sep = "_",
  y = NULL,
  group_name = NULL,
  scale_y = c("group", "global", "x", "none"),
  y_min = 0,
  y_max = NULL,
  y_nbreaks = 4,
  bg_color = "grey80",
  bg_alpha = 0.1,
  fill = TRUE,
  linewidth = 1,
  pt_size = 4,
  max_charwidth = 16,
  split_by = NULL,
  split_by_sep = "_",
  facet_by = NULL,
  facet_scales = "fixed",
  facet_nrow = NULL,
  facet_ncol = NULL,
  facet_byrow = TRUE,
  theme = "theme_ggforge",
  theme_args = list(),
  palette = "forge",
  palcolor = NULL,
  alpha = 0.2,
  aspect.ratio = 1,
  legend.position = "right",
  legend.direction = "vertical",
  title = NULL,
  subtitle = NULL,
  xlab = NULL,
  ylab = NULL,
  seed = 8525,
  combine = TRUE,
  nrow = NULL,
  ncol = NULL,
  byrow = TRUE,
  axes = NULL,
  axis_titles = NULL,
  guides = NULL,
  design = NULL,
  ...
)

SpiderPlot(
  data,
  x,
  x_sep = "_",
  group_by = NULL,
  group_by_sep = "_",
  y = NULL,
  group_name = NULL,
  scale_y = c("group", "global", "x", "none"),
  y_min = 0,
  y_max = NULL,
  y_nbreaks = 4,
  bg_color = "grey80",
  bg_alpha = 0.1,
  fill = TRUE,
  linewidth = 1,
  pt_size = 4,
  max_charwidth = 16,
  split_by = NULL,
  split_by_sep = "_",
  facet_by = NULL,
  facet_scales = "fixed",
  facet_nrow = NULL,
  facet_ncol = NULL,
  facet_byrow = TRUE,
  theme = "theme_ggforge",
  theme_args = list(),
  palette = "forge",
  palcolor = NULL,
  alpha = 0.2,
  aspect.ratio = 1,
  legend.position = "right",
  legend.direction = "vertical",
  title = NULL,
  subtitle = NULL,
  xlab = NULL,
  ylab = NULL,
  seed = 8525,
  combine = TRUE,
  nrow = NULL,
  ncol = NULL,
  byrow = TRUE,
  axes = NULL,
  axis_titles = NULL,
  guides = NULL,
  design = NULL,
  ...
)
Arguments
- data
A data frame containing the data to plot
- x
Column name for the x-axis/circles. Character/factor column expected.
- x_sep
Separator for concatenating multiple x columns.
- group_by
Column name(s) for grouping data (the lines). Character/factor column(s) expected.
- group_by_sep
Separator for concatenating multiple group_by columns.
- y
Column name for the y-axis. Numeric column expected. If NULL, counts of x-axis column in each group will be used.
- group_name
Legend title for groups.
- scale_y
How to scale the y-axis. Options: "group", "global", "x", "none".
"group": Scale to fraction within each group
"global": Scale to fraction of total
"x": Scale to fraction within each x-axis group
"none": Use raw counts/values
- y_min
Minimum value of y-axis.
- y_max
Maximum value of y-axis.
- y_nbreaks
Number of breaks in y-axis.
- bg_color
Background color of the plot.
- bg_alpha
Transparency of background color.
- fill
Fill polygons with colors.
- linewidth
Width of the lines.
- pt_size
Size of the points.
- max_charwidth
Maximum character width for x labels.
- split_by
Column name(s) to split data into multiple plots
- split_by_sep
Separator when concatenating multiple split_by columns
- facet_by
Column name(s) for faceting the plot
- facet_scales
Scales for facets: "fixed", "free", "free_x", "free_y"
- facet_nrow
Number of rows in facet layout
- facet_ncol
Number of columns in facet layout
- facet_byrow
Fill facets by row (TRUE) or column (FALSE)
- theme
Theme name (string) or theme function
- theme_args
List of arguments passed to theme function
- palette
Color palette name
- palcolor
Custom colors for palette
- alpha
Transparency level (0-1)
- aspect.ratio
Aspect ratio of plot panel
- legend.position
Legend position: "none", "left", "right", "bottom", "top"
- legend.direction
Legend direction: "horizontal" or "vertical"
- title
Plot title
- subtitle
Plot subtitle
- xlab
X-axis label
- ylab
Y-axis label
- seed
Random seed for reproducibility
- combine
Whether to combine split plots into one
- nrow
Number of rows when combining plots
- ncol
Number of columns when combining plots
- byrow
Fill combined plots by row
- axes
How to handle axes in combined plots ("keep", "collect", "collect_x", "collect_y")
- axis_titles
How to handle axis titles in combined plots
- guides
How to handle guides in combined plots ("collect", "keep", "auto")
- design
Custom layout design for combined plots
- ...
Additional arguments passed to atomic plotting functions.
See also
SpiderPlot()
RadarPlot()
Other specialized-plots:
BeeswarmPlot(),
ChordPlot(),
ClustreePlot(),
DendrogramPlot(),
Heatmap(),
PieChart(),
RarefactionPlot(),
RingPlot(),
SplitBarPlot(),
SunburstPlot(),
WordCloudPlot()
Other specialized-plots:
BeeswarmPlot(),
ChordPlot(),
ClustreePlot(),
DendrogramPlot(),
Heatmap(),
PieChart(),
RarefactionPlot(),
RingPlot(),
SplitBarPlot(),
SunburstPlot(),
WordCloudPlot()
Examples
# Use counts
data <- data.frame(
x = c(rep("A", 2), rep("B", 3), rep("C", 3), rep("D", 4), rep("E", 5)),
group = sample(paste0("G", 1:4), 17, replace = TRUE)
)
RadarPlot(data, x = "x")
 RadarPlot(data, x = "x", bg_color = "lightpink")
 RadarPlot(data, x = "x", scale_y = "none")
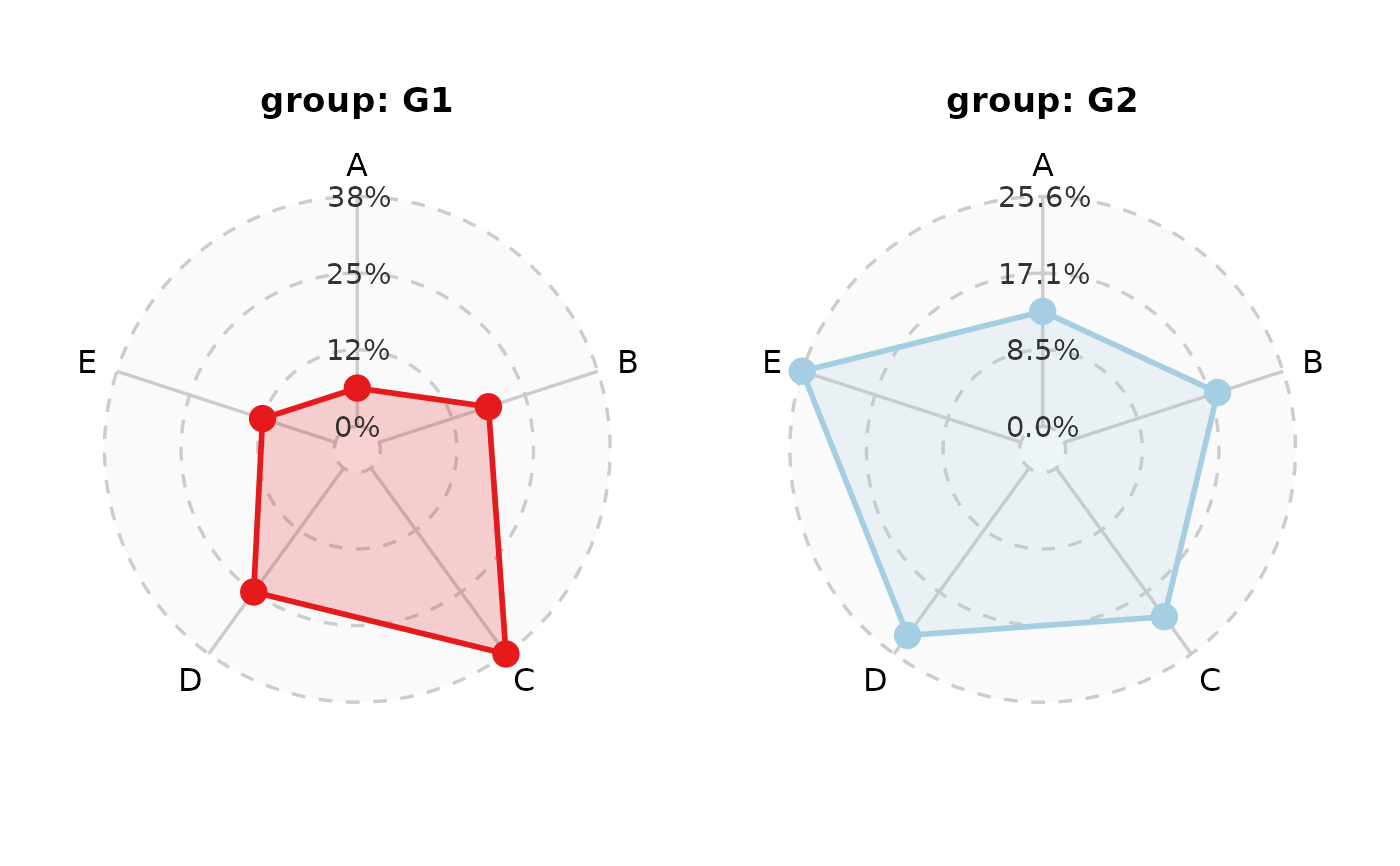
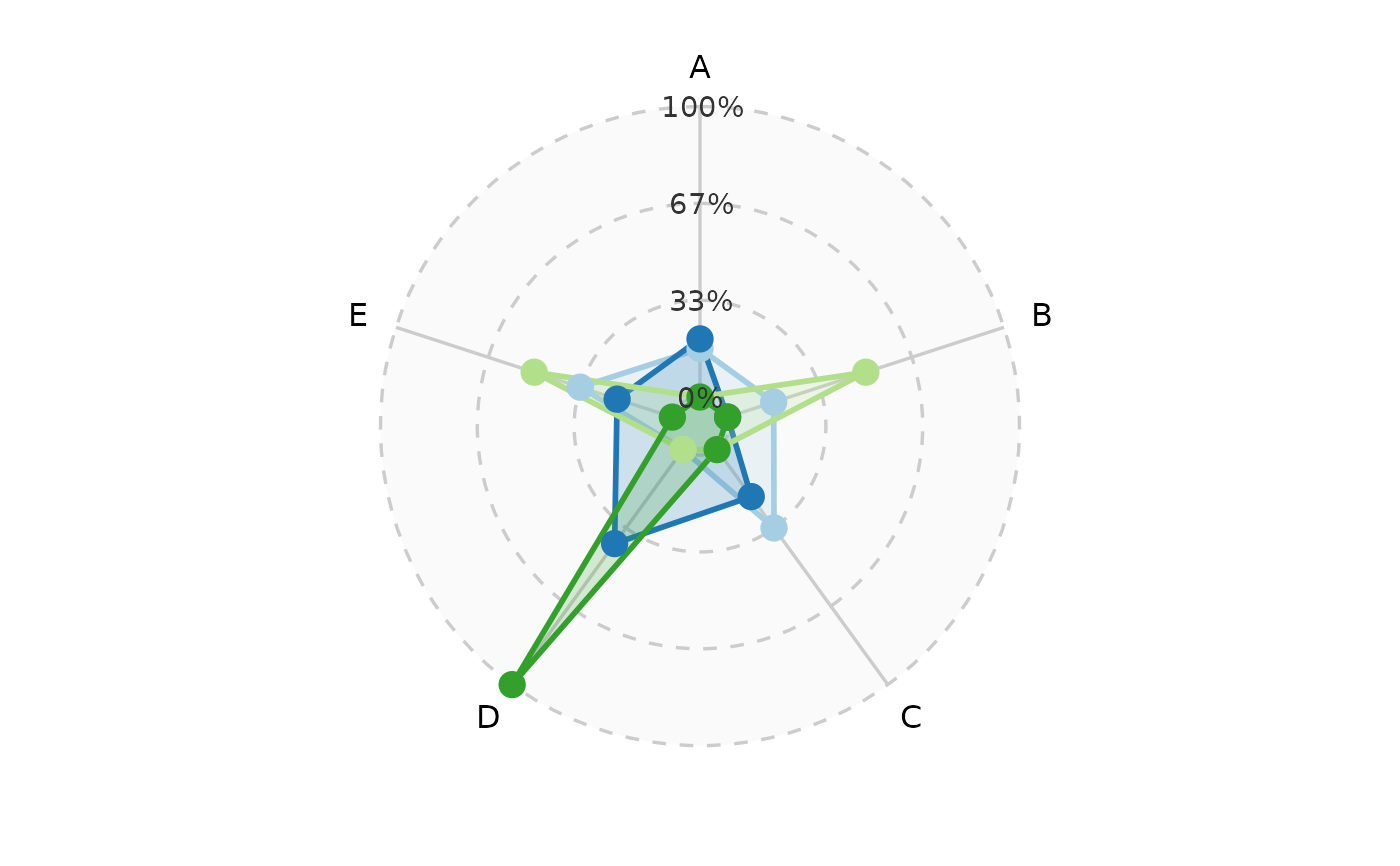
 RadarPlot(data, x = "x", group_by = "group")
 SpiderPlot(data, x = "x")
 SpiderPlot(data, x = "x", group_by = "group")
 # Use y values
data <- data.frame(
x = rep(LETTERS[1:5], 2),
y = c(1, 3, 6, 4, 2, 5, 7, 8, 9, 10),
group = rep(c("G1", "G2"), each = 5)
)
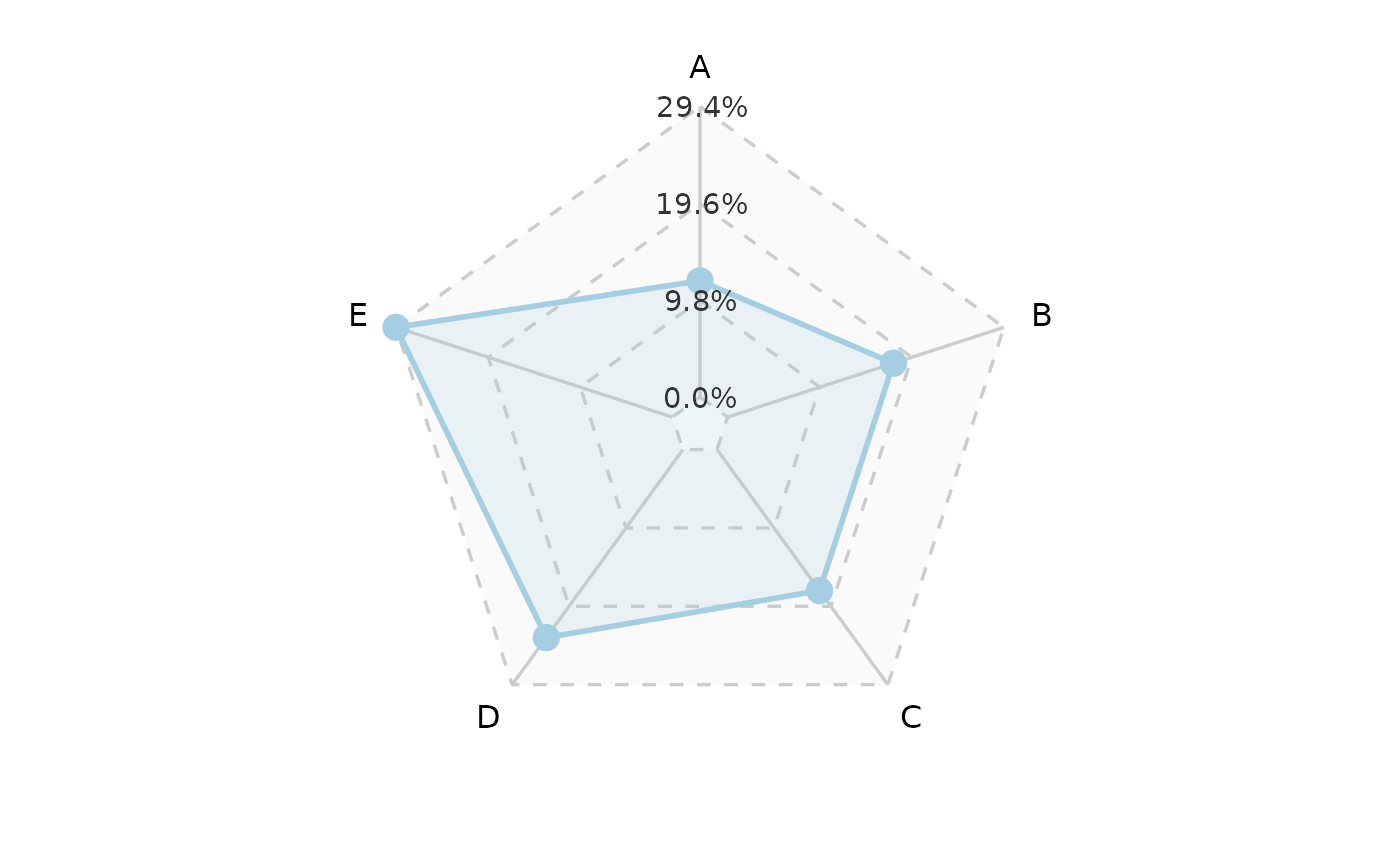
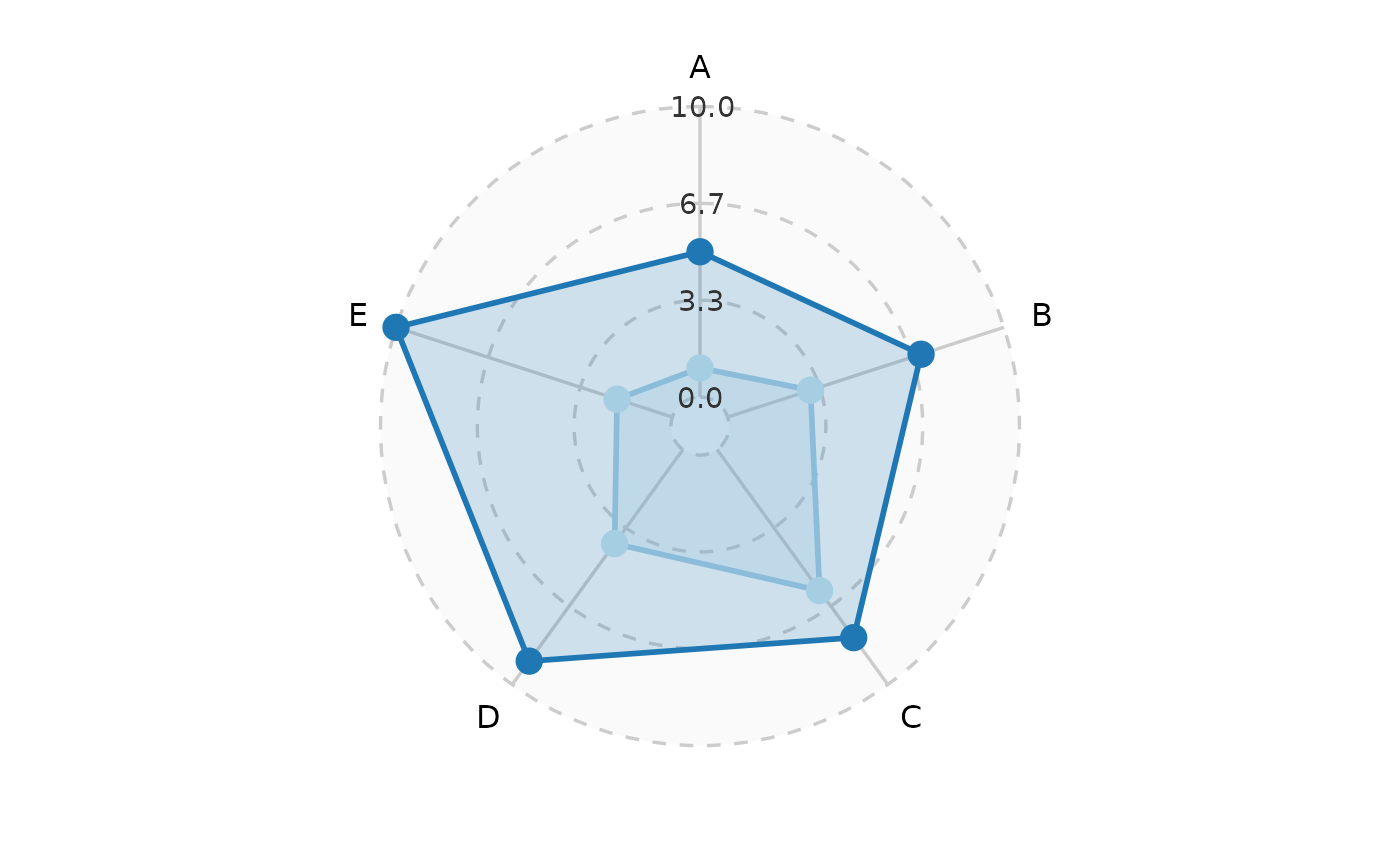
RadarPlot(data, x = "x", y = "y", scale_y = "none", group_by = "group")
# Use y values
data <- data.frame(
x = rep(LETTERS[1:5], 2),
y = c(1, 3, 6, 4, 2, 5, 7, 8, 9, 10),
group = rep(c("G1", "G2"), each = 5)
)
RadarPlot(data, x = "x", y = "y", scale_y = "none", group_by = "group")
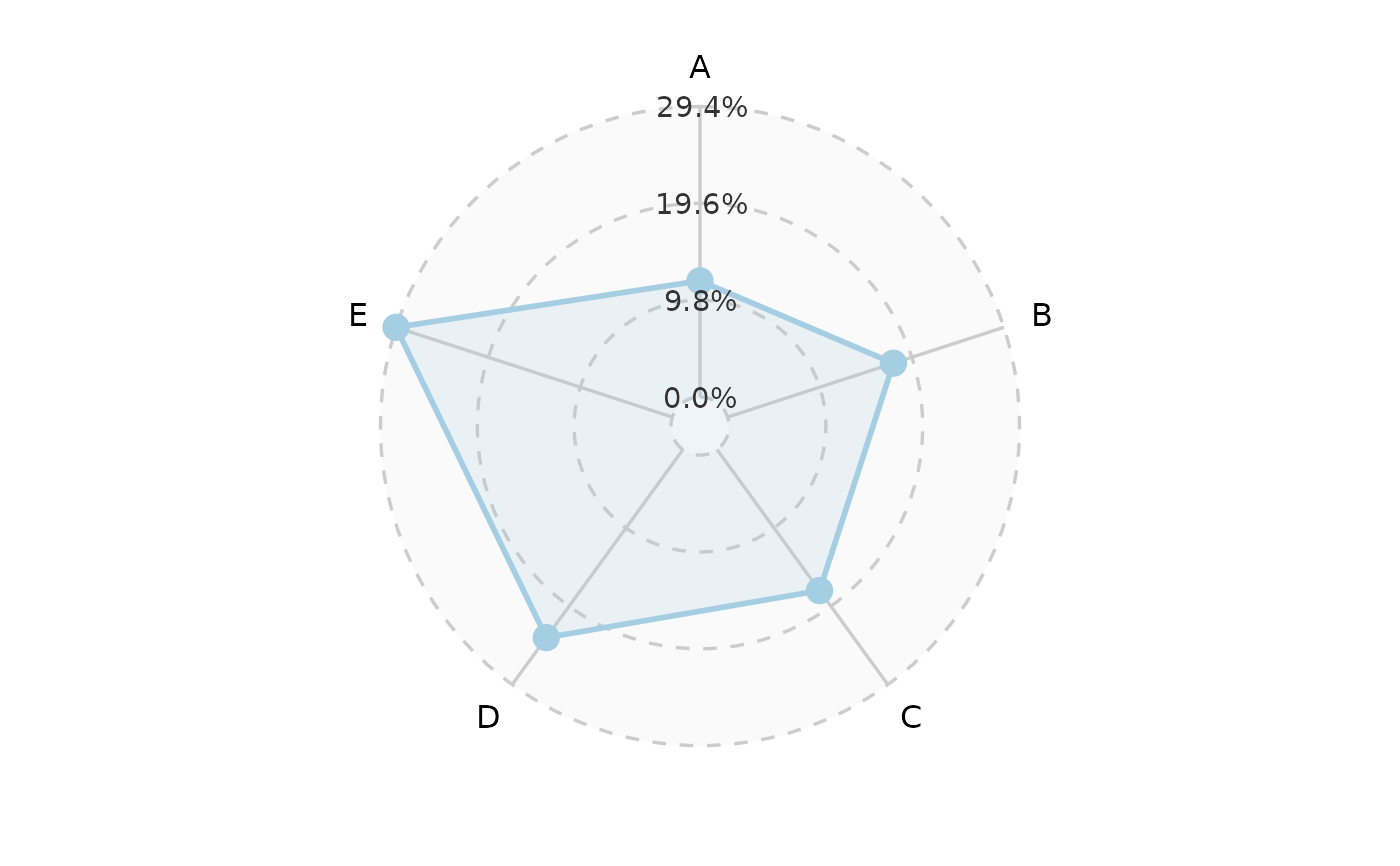
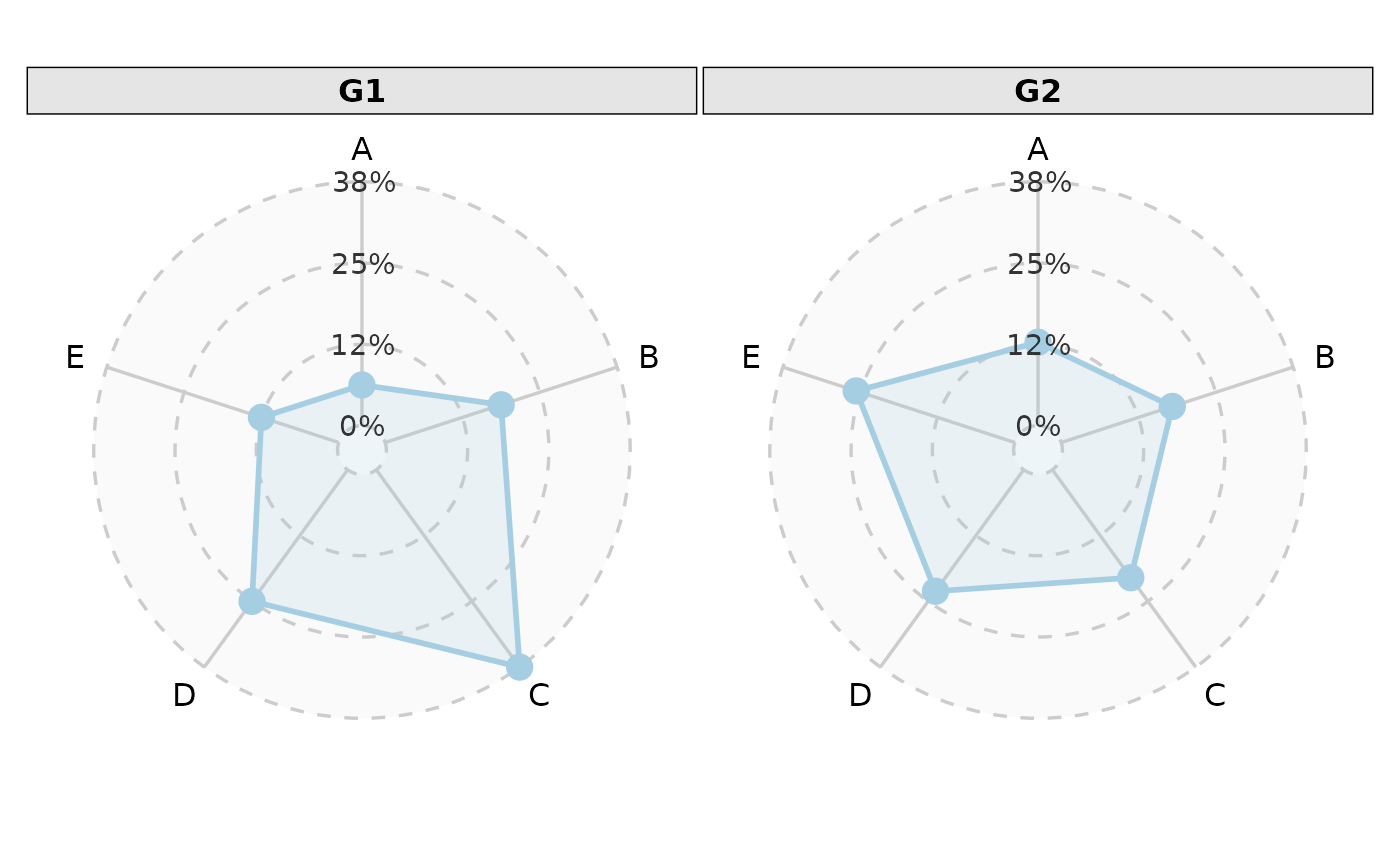
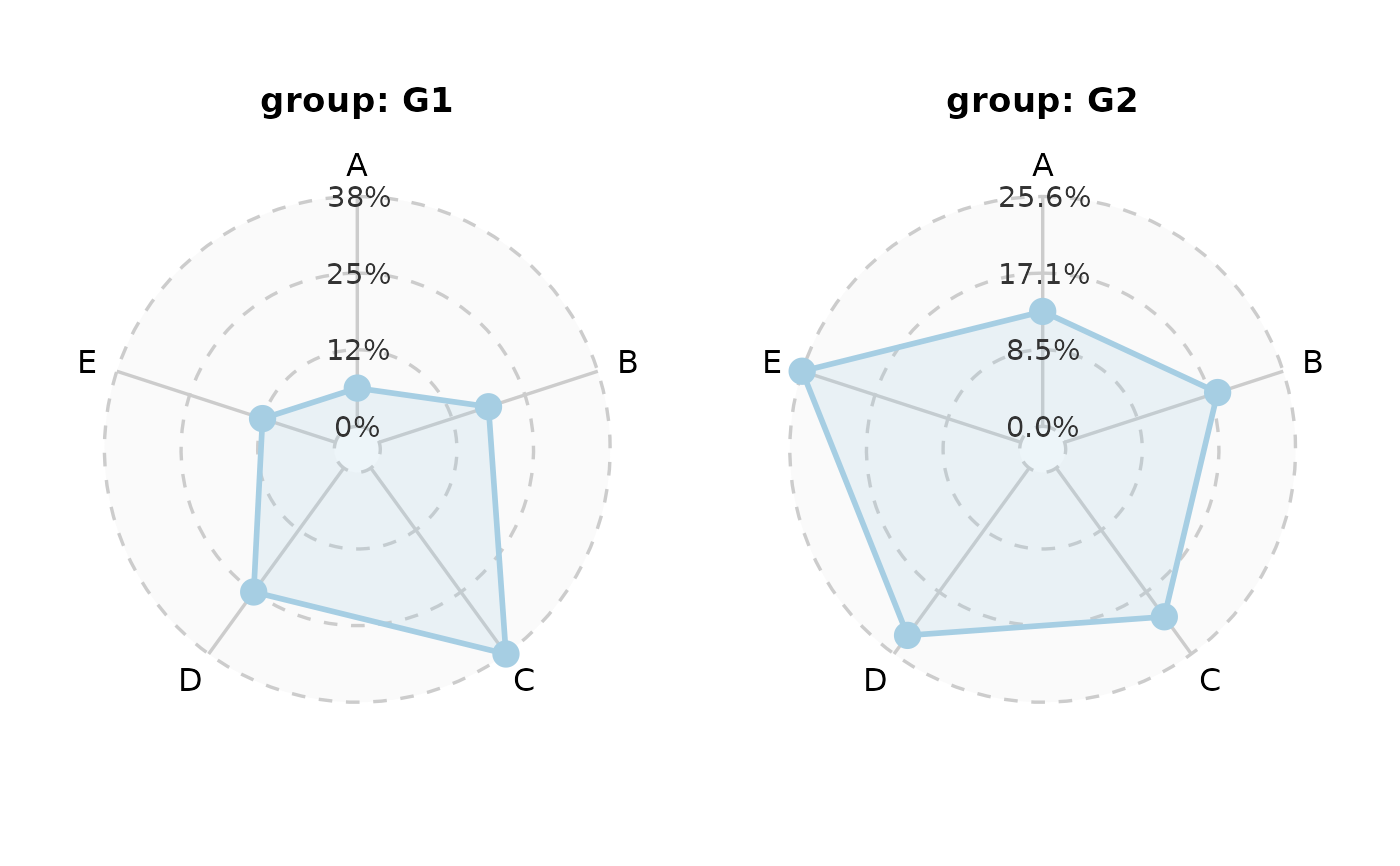
 RadarPlot(data, x = "x", y = "y", facet_by = "group")
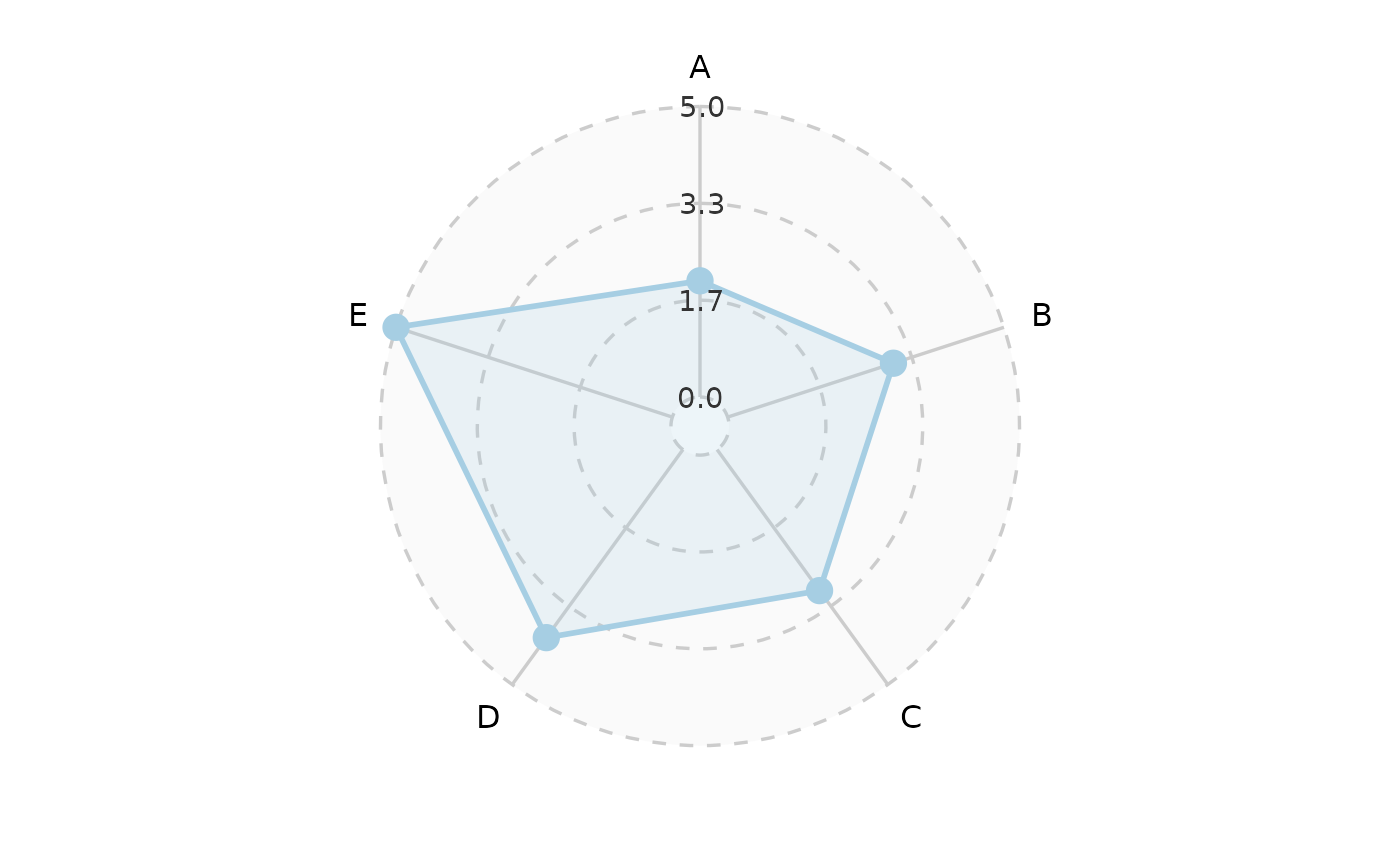
 RadarPlot(data, x = "x", y = "y", split_by = "group")
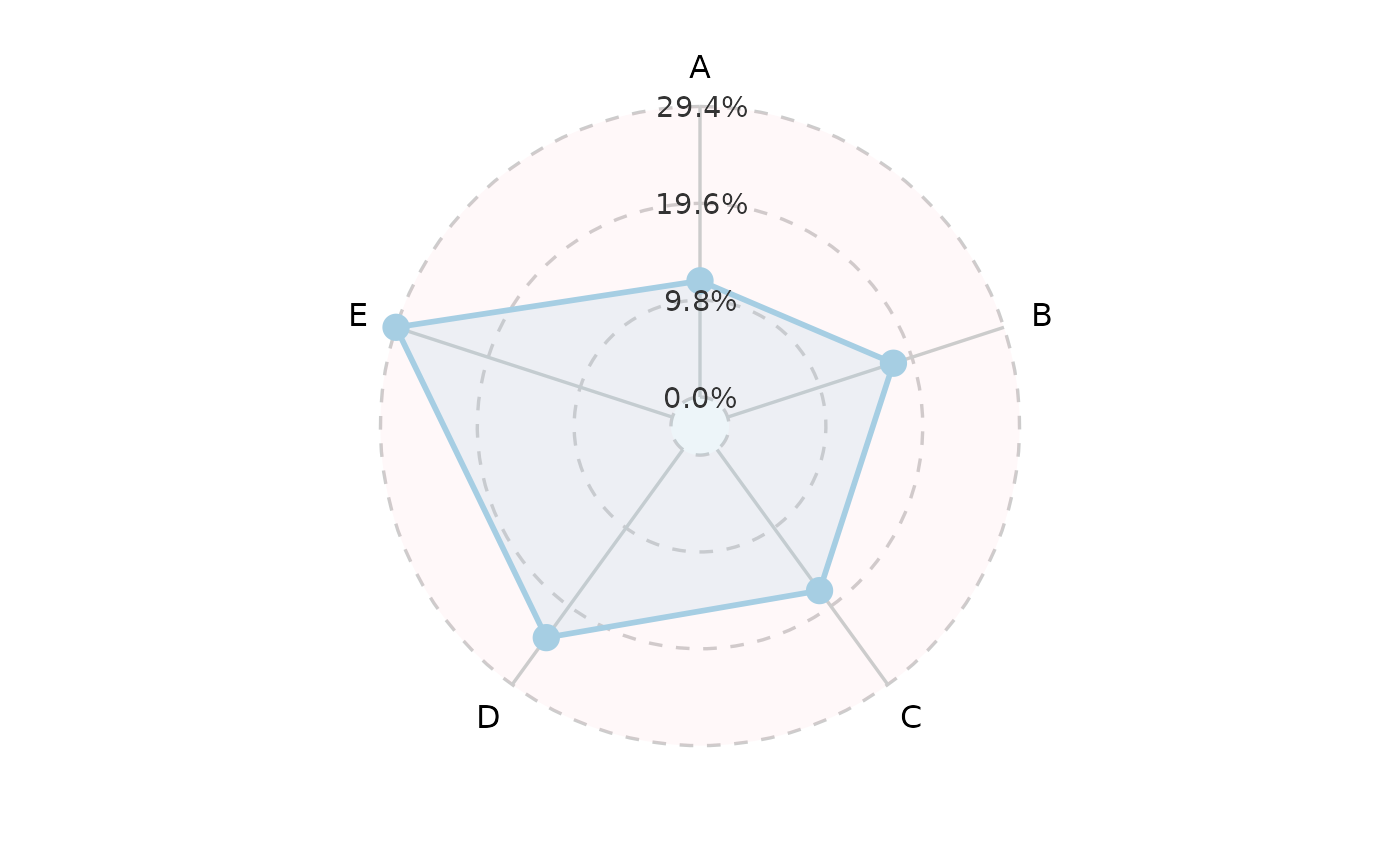
 RadarPlot(data,
x = "x", y = "y", split_by = "group",
palette = c(G1 = "Set1", G2 = "Paired")
)
RadarPlot(data,
x = "x", y = "y", split_by = "group",
palette = c(G1 = "Set1", G2 = "Paired")
)