Create beeswarm plots showing individual data points arranged to avoid
overlap while reflecting density. This is a convenience wrapper around
BoxPlot() with add_beeswarm = TRUE and add_point = TRUE.
See also
Other specialized-plots:
ChordPlot(),
ClustreePlot(),
DendrogramPlot(),
Heatmap(),
PieChart(),
RadarPlot(),
RarefactionPlot(),
RingPlot(),
SplitBarPlot(),
SunburstPlot(),
WordCloudPlot()
Examples
# \donttest{
set.seed(123)
data <- data.frame(
group = rep(LETTERS[1:4], each = 25),
value = c(
rnorm(25, 10, 2), rnorm(25, 12, 2),
rnorm(25, 11, 3), rnorm(25, 14, 2)
)
)
# Basic beeswarm plot
BeeswarmPlot(data, x = "group", y = "value")
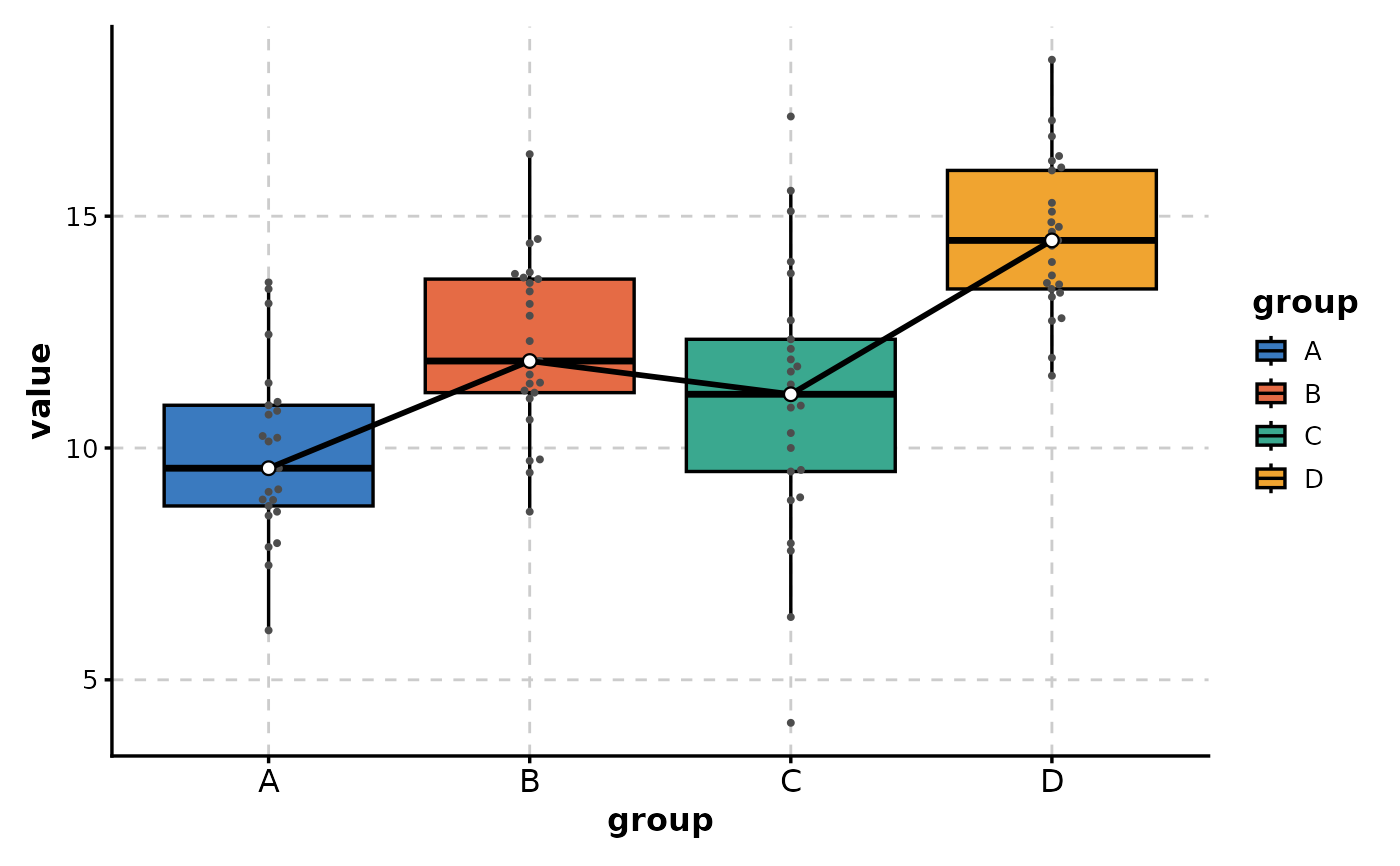
 # With trend line
BeeswarmPlot(data, x = "group", y = "value", add_trend = TRUE)
# With trend line
BeeswarmPlot(data, x = "group", y = "value", add_trend = TRUE)
 # }
# }