Creates standalone dendrogram (tree) plots from hierarchical clustering. Unlike the Heatmap function's built-in dendrograms (via ComplexHeatmap), this creates independent ggplot2 dendrogram objects. Useful for any clustering visualization across disciplines.
Usage
DendrogramPlot(
  data,
  columns = NULL,
  method = "complete",
  dist_method = "euclidean",
  k = NULL,
  color_name = "Cluster",
  horiz = FALSE,
  labels_col = NULL,
  label_size = 3,
  line_width = 0.6,
  split_by = NULL,
  split_by_sep = "_",
  theme = "theme_ggforge",
  theme_args = list(),
  palette = "forge",
  palcolor = NULL,
  alpha = 1,
  legend.position = "right",
  legend.direction = "vertical",
  title = NULL,
  subtitle = NULL,
  xlab = NULL,
  ylab = NULL,
  seed = 8525,
  combine = TRUE,
  nrow = NULL,
  ncol = NULL,
  byrow = TRUE,
  axes = NULL,
  axis_titles = NULL,
  guides = NULL,
  design = NULL,
  ...
)
Arguments
- data
A data frame containing the data to plot
- columns
Numeric columns to use for clustering. If NULL, uses all numeric columns.
- method
Clustering method: "complete", "ward.D2", "average", "single", etc.
- dist_method
Distance method: "euclidean", "manhattan", "maximum", etc.
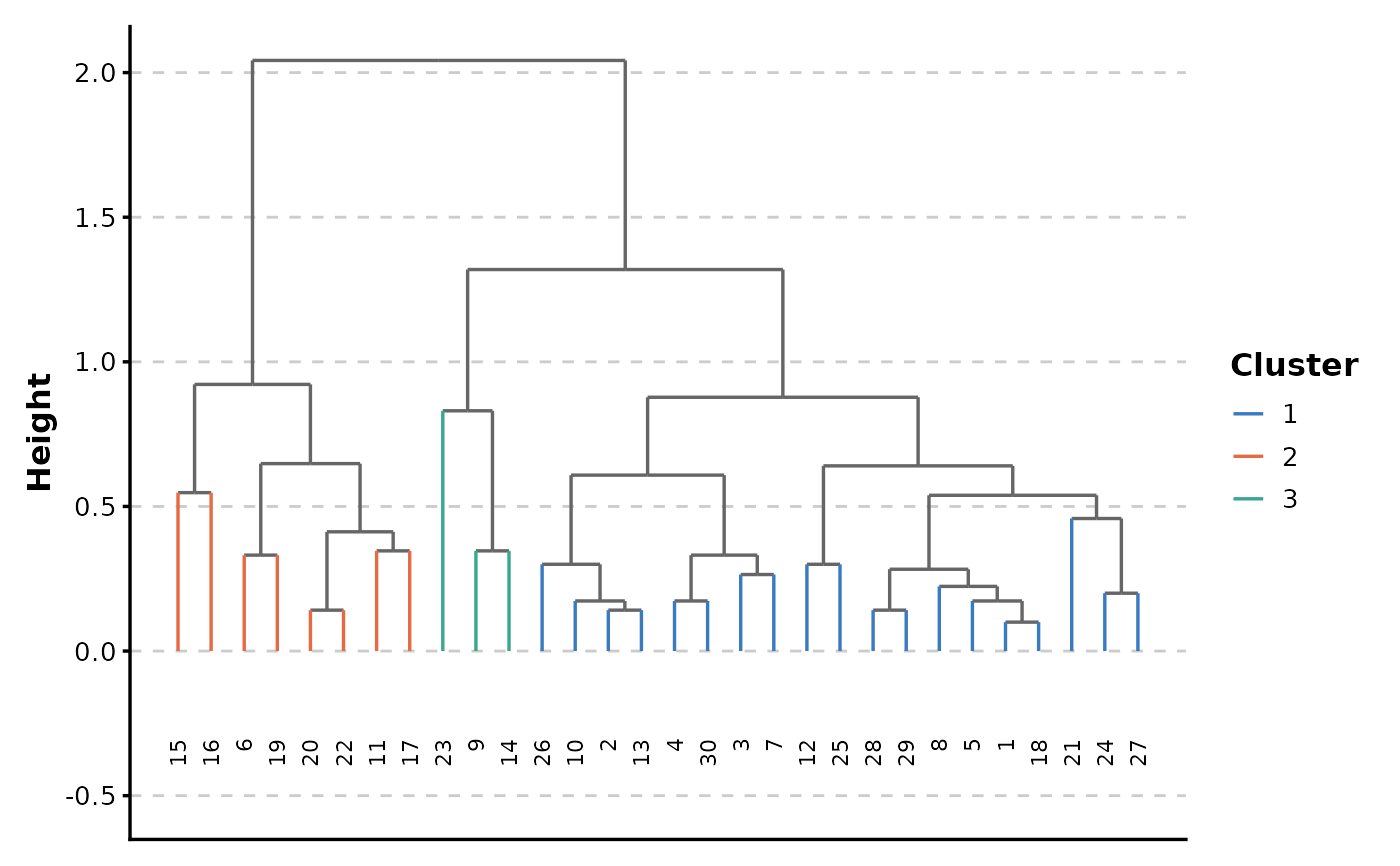
- k
Number of clusters to cut. If provided, branches are colored by cluster.
- color_name
Legend title for cluster colors.
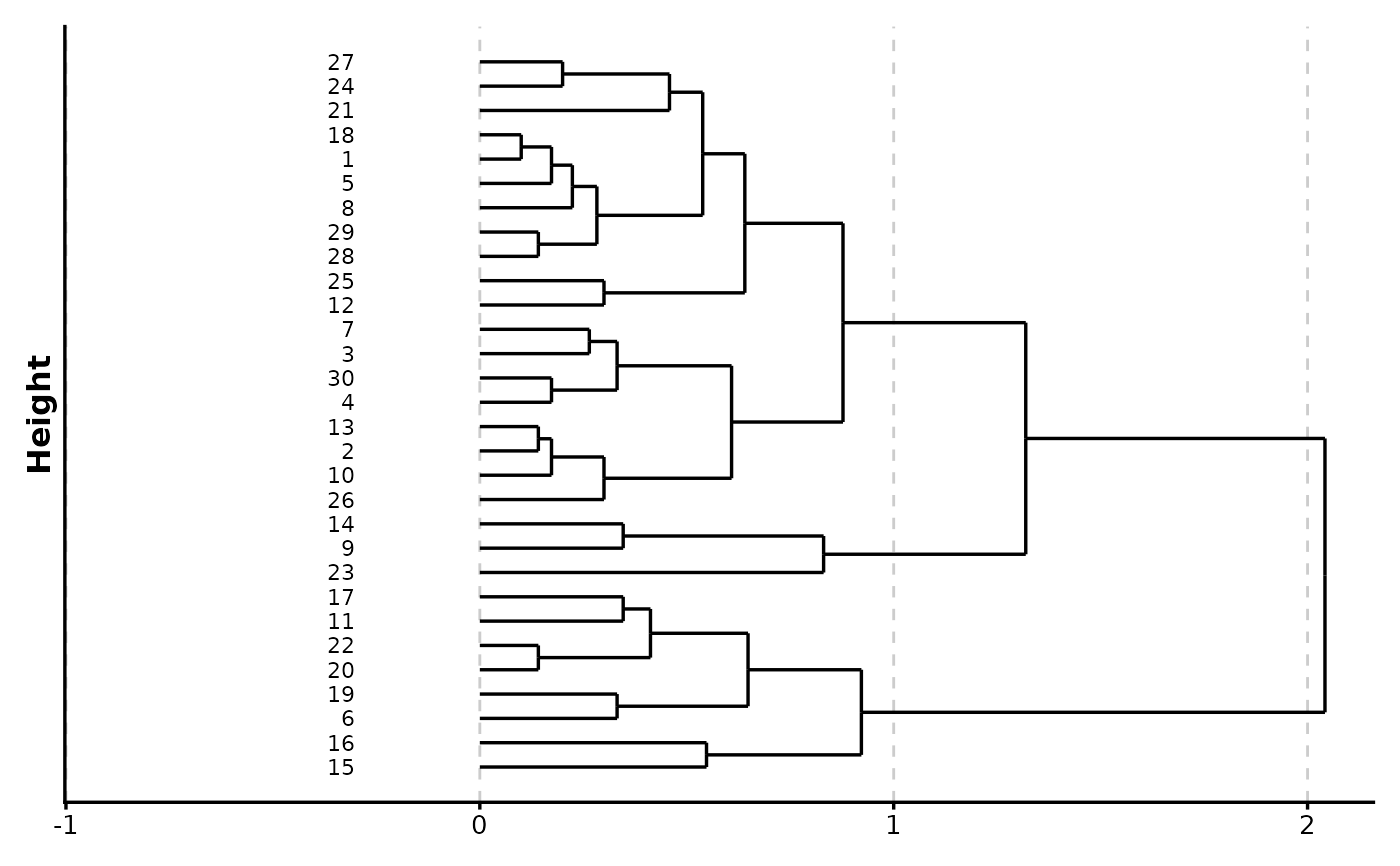
- horiz
Whether to draw horizontal dendrogram.
- labels_col
Column to use for leaf labels. If NULL, uses rownames.
- label_size
Size of leaf labels.
- line_width
Line width of dendrogram branches.
- split_by
Column name(s) to split data into multiple plots
- split_by_sep
Separator when concatenating multiple split_by columns
- theme
Theme name (string) or theme function
- theme_args
List of arguments passed to theme function
- palette
Color palette name
- palcolor
Custom colors for palette
- alpha
Transparency level (0-1)
- legend.position
Legend position: "none", "left", "right", "bottom", "top"
- legend.direction
Legend direction: "horizontal" or "vertical"
- title
Plot title
- subtitle
Plot subtitle
- xlab
X-axis label
- ylab
Y-axis label
- seed
Random seed for reproducibility
- combine
Whether to combine split plots into one
- nrow
Number of rows when combining plots
- ncol
Number of columns when combining plots
- byrow
Fill combined plots by row
- axes
How to handle axes in combined plots ("keep", "collect", "collect_x", "collect_y")
- axis_titles
How to handle axis titles in combined plots
- guides
How to handle guides in combined plots ("collect", "keep", "auto")
- design
Custom layout design for combined plots
- ...
Additional arguments passed to atomic plotting functions.
See also
Other specialized-plots:
BeeswarmPlot(),
ChordPlot(),
ClustreePlot(),
Heatmap(),
PieChart(),
RadarPlot(),
RarefactionPlot(),
RingPlot(),
SplitBarPlot(),
SunburstPlot(),
WordCloudPlot()