Creates pie charts to illustrate numerical proportion of each group. Supports splitting by groups, faceting, and custom color palettes.
Usage
PieChart(
  data,
  x,
  y = NULL,
  label = y,
  split_by = NULL,
  split_by_sep = "_",
  clockwise = TRUE,
  facet_by = NULL,
  facet_scales = "free_y",
  facet_ncol = NULL,
  facet_nrow = NULL,
  facet_byrow = TRUE,
  theme = "theme_ggforge",
  theme_args = list(),
  palette = "forge",
  palcolor = NULL,
  alpha = 1,
  aspect.ratio = 1,
  legend.position = "right",
  legend.direction = "vertical",
  title = NULL,
  subtitle = NULL,
  xlab = NULL,
  ylab = NULL,
  keep_empty = FALSE,
  combine = TRUE,
  nrow = NULL,
  ncol = NULL,
  byrow = TRUE,
  seed = 8525,
  axes = NULL,
  axis_titles = axes,
  guides = NULL,
  design = NULL,
  ...
)
Arguments
- data
A data frame
- x
Column name for categories. Will be converted to factor.
- y
Column name for values. If NULL, counts will be used.
- label
Column to use for labels. Default is same as y. If y is NULL, use ".y" to specify counts as labels.
- split_by
Column(s) to split the data by, creating separate plots. Multiple columns will be concatenated with split_by_sep.
- split_by_sep
Separator for concatenating multiple split_by columns.
- clockwise
Whether to draw pie chart clockwise (default: TRUE)
- facet_by
Column(s) to facet by (max 2 columns).
- facet_scales
Scale type for facets: "fixed", "free", "free_x", or "free_y"
- facet_ncol
Number of columns for faceting.
- facet_nrow
Number of rows for faceting.
- facet_byrow
Whether to fill facets by row.
- theme
Theme name or function. Default is "theme_ggforge".
- theme_args
List of arguments to pass to the theme function.
- palette
Color palette name. Default is "forge".
- palcolor
Custom colors (overrides palette).
- alpha
Transparency level (0-1). Default is 1.
- aspect.ratio
Aspect ratio of the plot. Default is 1.
- legend.position
Legend position ("none", "left", "right", "bottom", "top").
- legend.direction
Legend direction ("horizontal" or "vertical").
- title
Plot title. Can be a string or function.
- subtitle
Plot subtitle.
- xlab
X-axis label.
- ylab
Y-axis label.
- keep_empty
Keep empty factor levels.
- combine
Whether to combine plots when split_by is used.
- nrow
Number of rows when combining plots.
- ncol
Number of columns when combining plots.
- byrow
Whether to arrange plots by row when combining.
- seed
Random seed for reproducibility. Default is 8525.
- axes
Axis handling when combining plots.
- axis_titles
Axis title handling when combining plots.
- guides
Guide handling when combining plots.
- design
Custom design for combining plots.
- ...
Additional arguments (currently unused).
See also
Other specialized-plots:
BeeswarmPlot(),
ChordPlot(),
ClustreePlot(),
DendrogramPlot(),
Heatmap(),
RadarPlot(),
RarefactionPlot(),
RingPlot(),
SplitBarPlot(),
SunburstPlot(),
WordCloudPlot()
Examples
# Create sample data
data <- data.frame(
x = c("A", "B", "C", "D", "E", "F", "G", "H"),
y = c(10, 8, 16, 4, 6, 12, 14, 2),
group = c("G1", "G1", "G2", "G2", "G3", "G3", "G4", "G4"),
facet = c("F1", "F2", "F3", "F4", "F1", "F2", "F3", "F4")
)
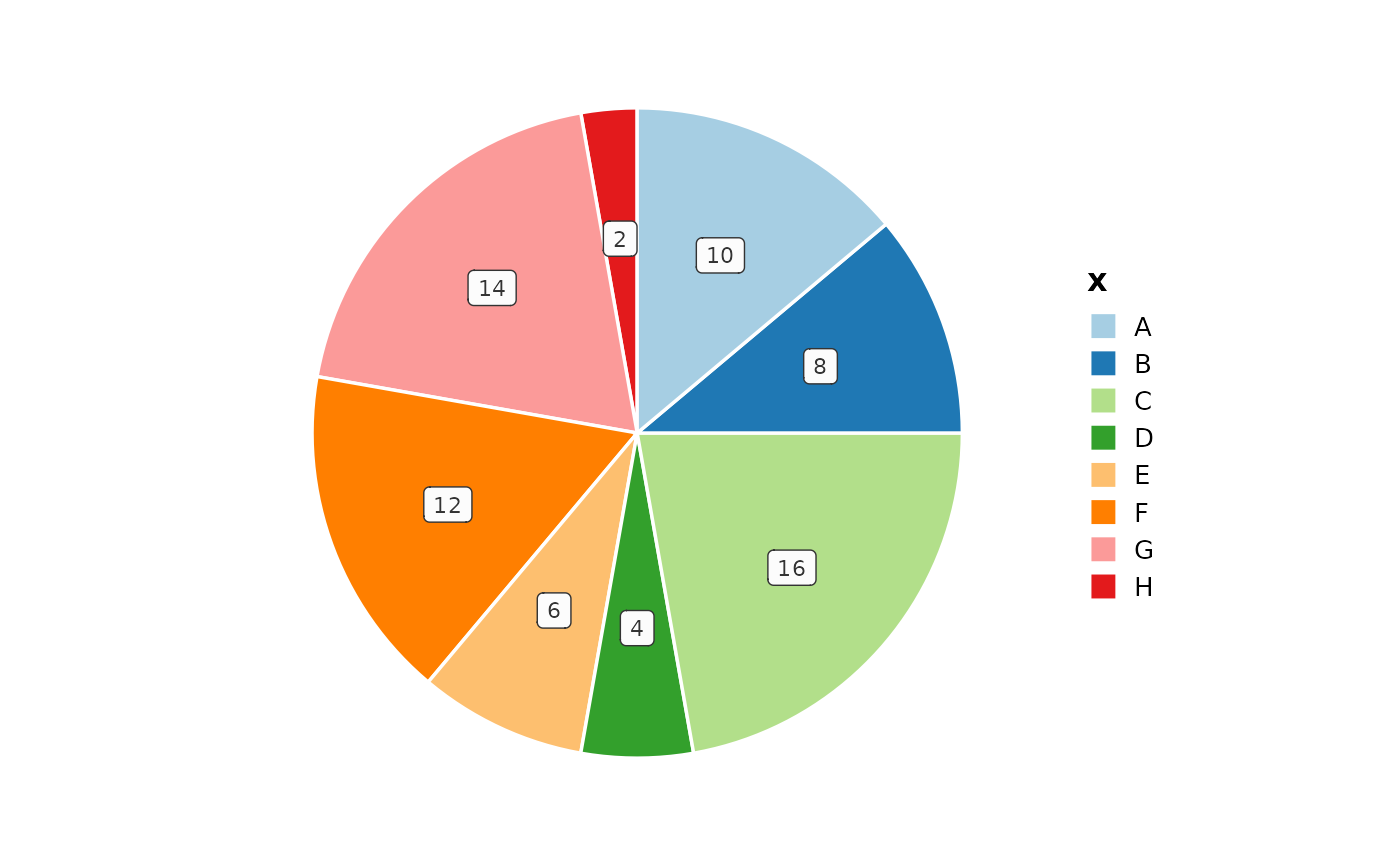
# Basic pie chart
PieChart(data, x = "x", y = "y")
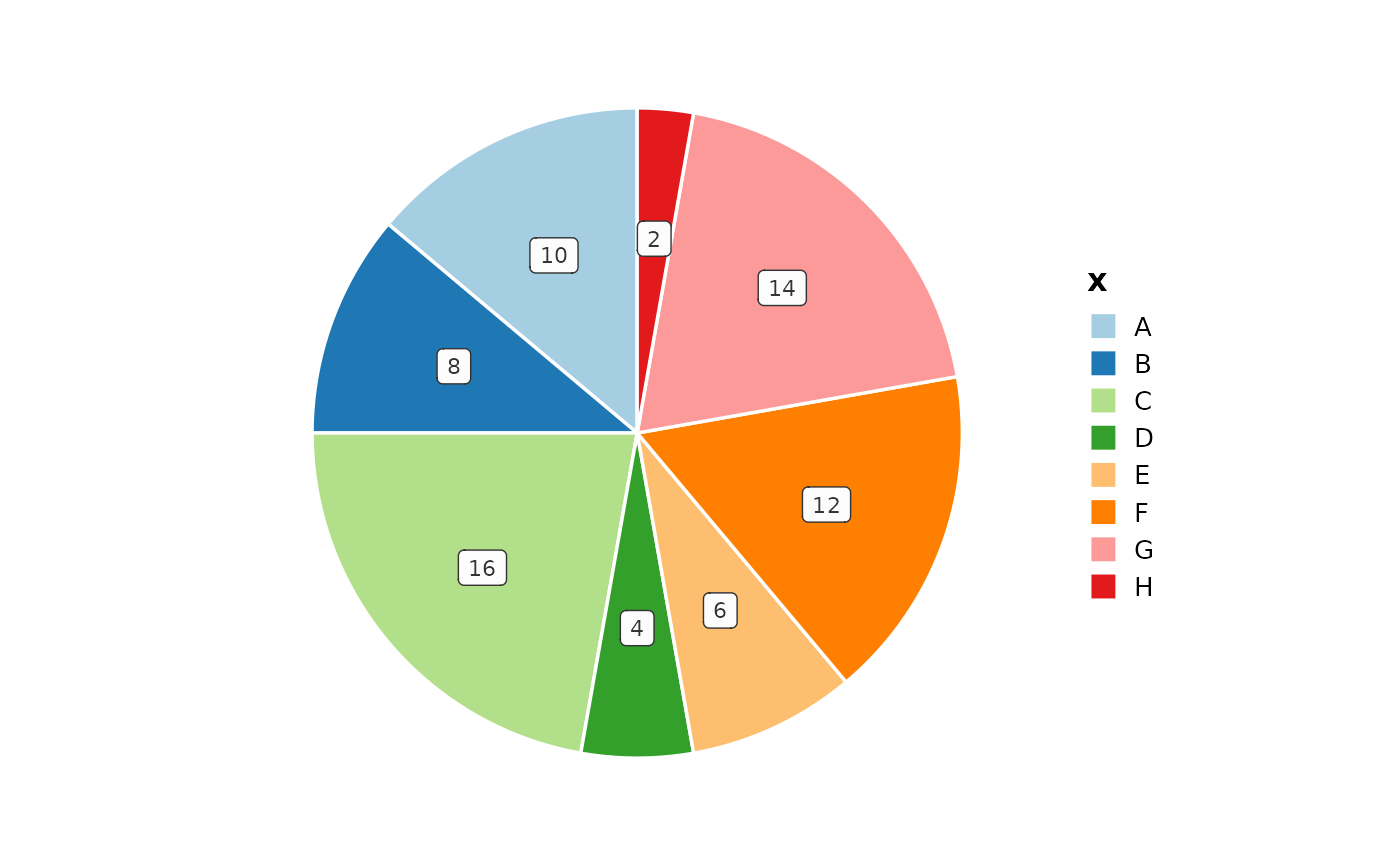
 # Counter-clockwise
PieChart(data, x = "x", y = "y", clockwise = FALSE)
# Counter-clockwise
PieChart(data, x = "x", y = "y", clockwise = FALSE)
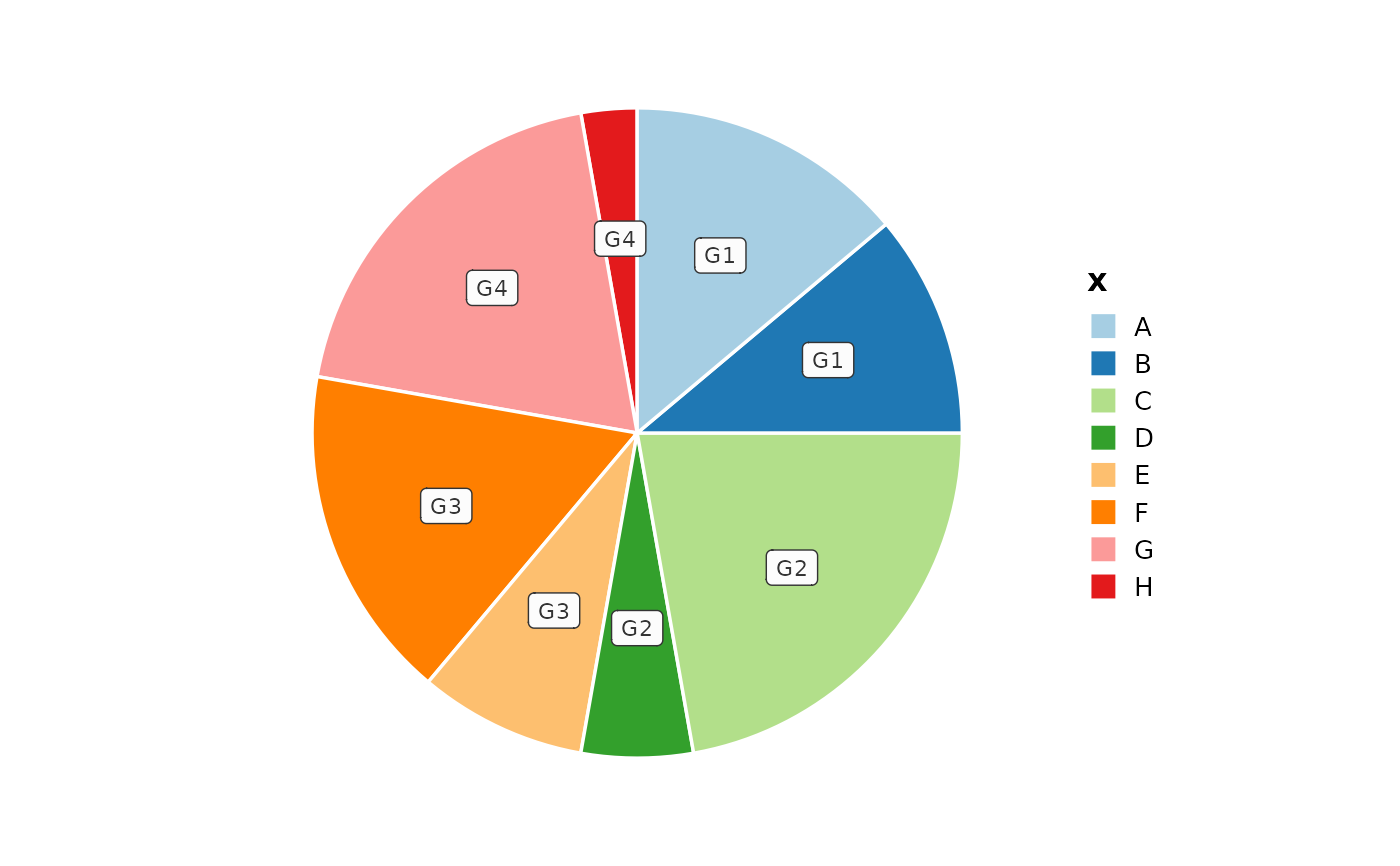
 # With labels
PieChart(data, x = "x", y = "y", label = "group")
# With labels
PieChart(data, x = "x", y = "y", label = "group")
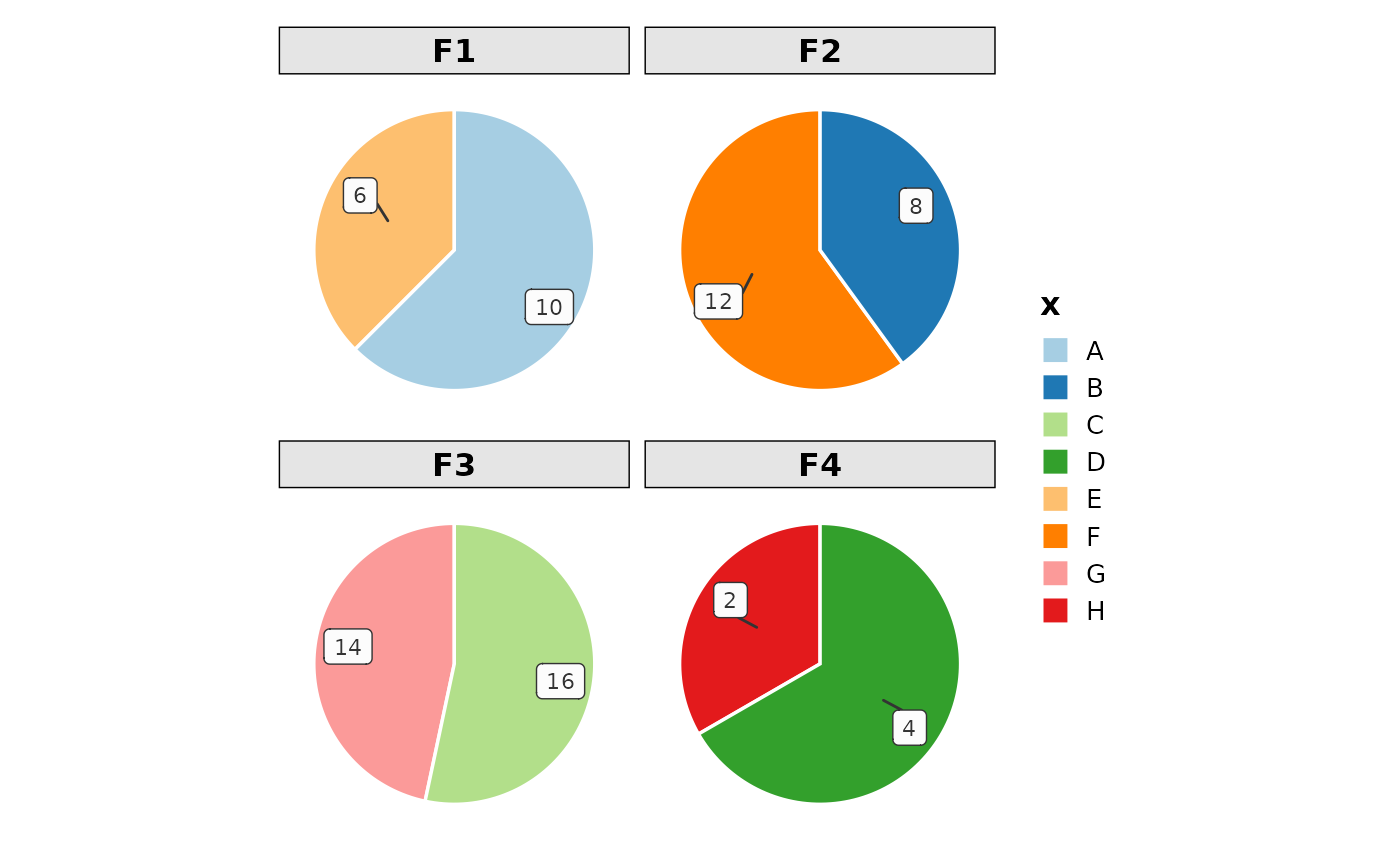
 # With faceting
PieChart(data, x = "x", y = "y", facet_by = "facet")
# With faceting
PieChart(data, x = "x", y = "y", facet_by = "facet")
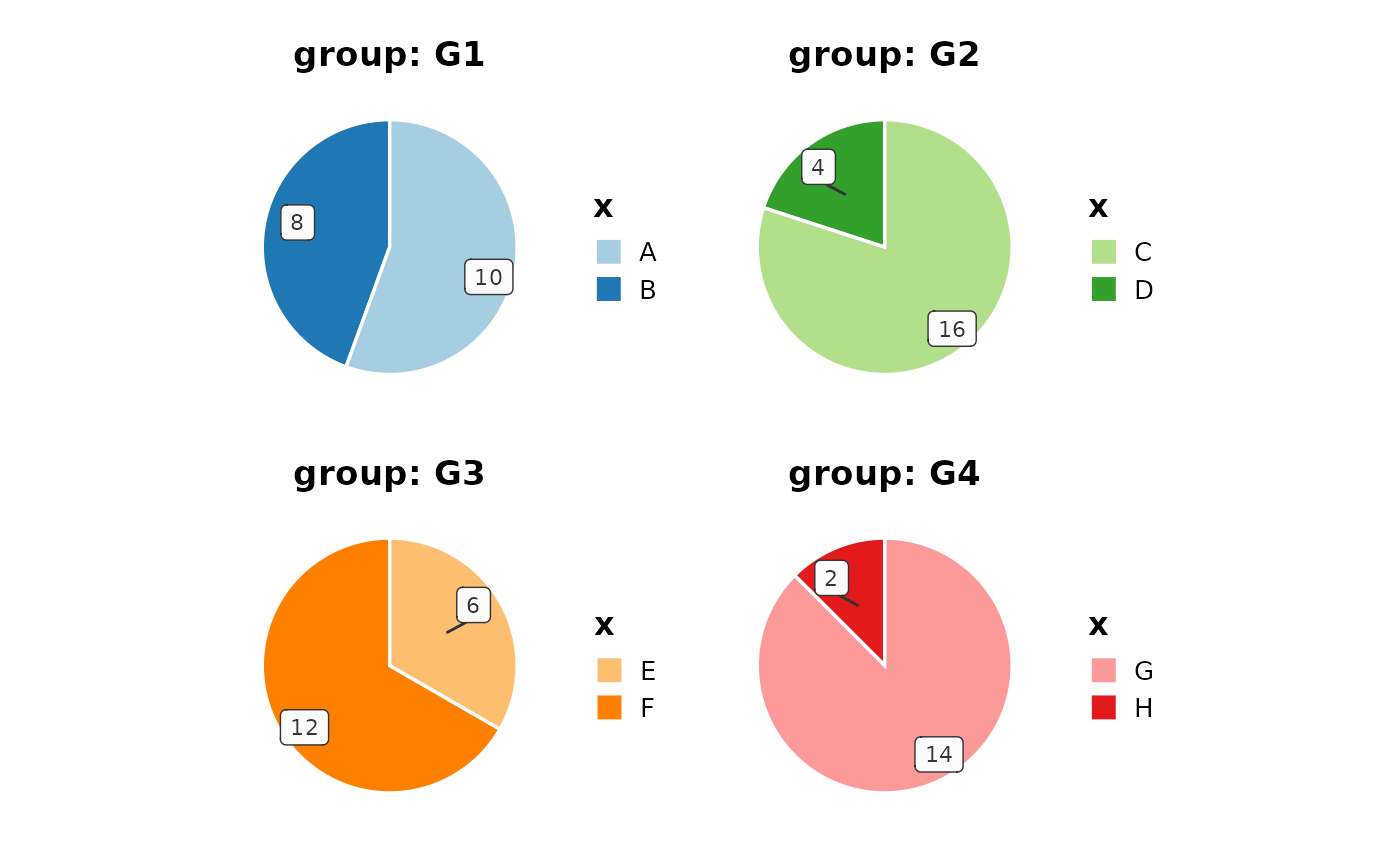
 # Split by group
PieChart(data, x = "x", y = "y", split_by = "group")
# Split by group
PieChart(data, x = "x", y = "y", split_by = "group")
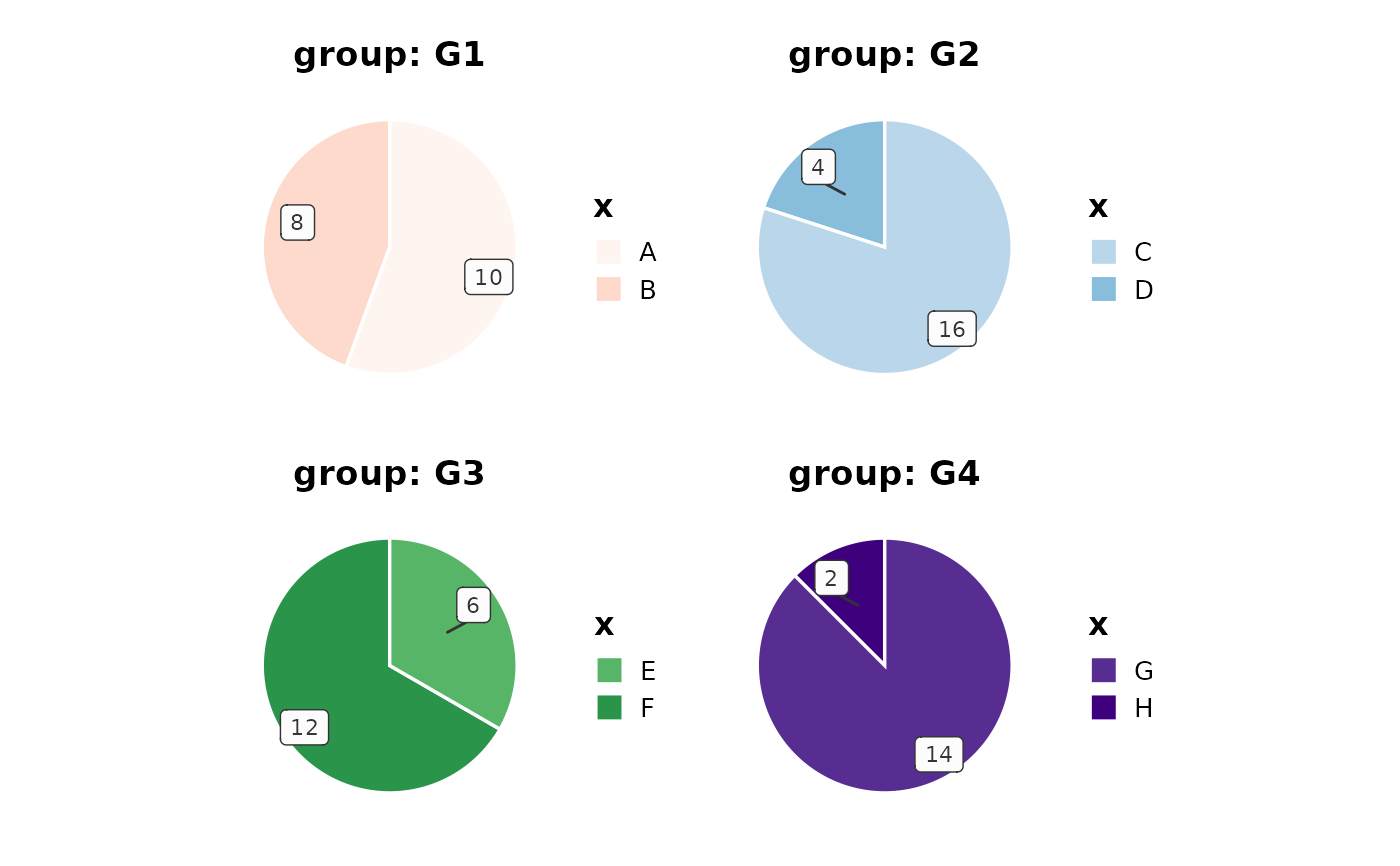
 # Custom palettes per split
PieChart(data,
x = "x", y = "y", split_by = "group",
palette = list(G1 = "Reds", G2 = "Blues", G3 = "Greens", G4 = "Purples")
)
# Custom palettes per split
PieChart(data,
x = "x", y = "y", split_by = "group",
palette = list(G1 = "Reds", G2 = "Blues", G3 = "Greens", G4 = "Purples")
)
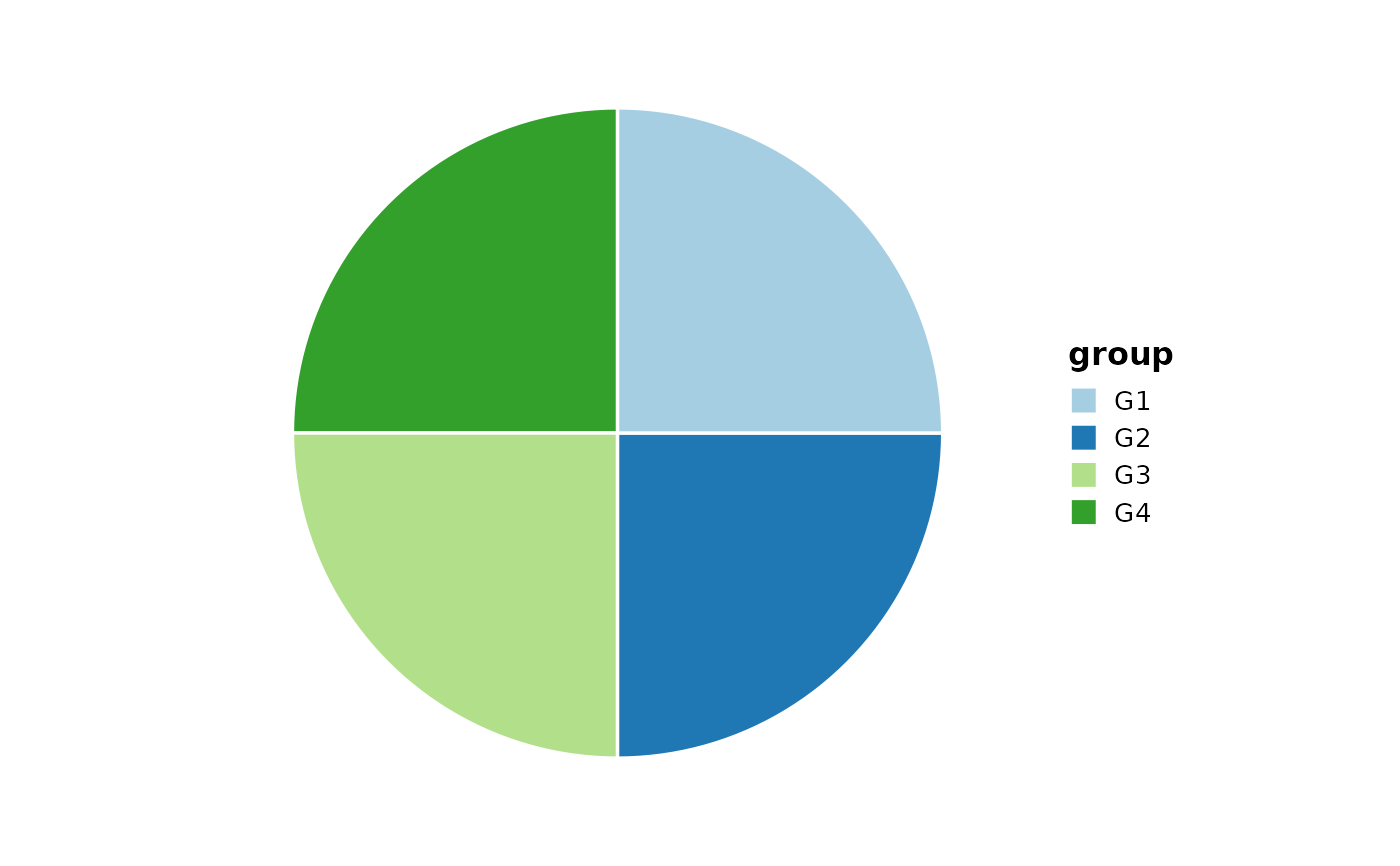
 # Use counts (y from count)
PieChart(data, x = "group")
# Use counts (y from count)
PieChart(data, x = "group")
 # With count labels
PieChart(data, x = "group", label = ".y")
# With count labels
PieChart(data, x = "group", label = ".y")
