A plot showing how one or more groups' numeric values change over the progression of another variable.
Usage
AreaPlot(
  data,
  x,
  y = NULL,
  x_sep = "_",
  group_by = NULL,
  group_by_sep = "_",
  group_name = NULL,
  scale_y = FALSE,
  split_by = NULL,
  split_by_sep = "_",
  facet_by = NULL,
  facet_scales = "fixed",
  facet_nrow = NULL,
  facet_ncol = NULL,
  facet_byrow = TRUE,
  theme = "theme_ggforge",
  theme_args = list(),
  palette = "forge",
  palcolor = NULL,
  alpha = 1,
  x_text_angle = 0,
  aspect.ratio = NULL,
  legend.position = "right",
  legend.direction = "vertical",
  title = NULL,
  subtitle = NULL,
  xlab = NULL,
  ylab = NULL,
  keep_empty = FALSE,
  seed = 8525,
  combine = TRUE,
  nrow = NULL,
  ncol = NULL,
  byrow = TRUE,
  axes = NULL,
  axis_titles = NULL,
  guides = NULL,
  design = NULL,
  ...
)
Arguments
- data
A data frame containing the data to plot
- x
A character string of the column name to plot on the x-axis. A character/factor column is expected.
- y
A character string of the column name to plot on the y-axis. A numeric column is expected. If NULL, the count of the x-axis column will be used.
- x_sep
A character string to concatenate the columns in
x, if multiple columns are provided.- group_by
A character vector of column names to fill the area plot by. If NULL, the plot will be filled by the first color of the palette. If multiple columns are provided, the columns will be concatenated with
group_by_sepand used as the fill column.- group_by_sep
A character string to separate the columns in
group_by.- group_name
A character string to name the legend of fill.
- scale_y
A logical value to scale the y-axis by the total number in each x-axis group.
- split_by
Column name(s) to split data into multiple plots
- split_by_sep
Separator when concatenating multiple split_by columns
- facet_by
Column name(s) for faceting the plot
- facet_scales
Scales for facets: "fixed", "free", "free_x", "free_y"
- facet_nrow
Number of rows in facet layout
- facet_ncol
Number of columns in facet layout
- facet_byrow
Fill facets by row (TRUE) or column (FALSE)
- theme
Theme name (string) or theme function
- theme_args
List of arguments passed to theme function
- palette
Color palette name
- palcolor
Custom colors for palette
- alpha
Transparency level (0-1)
- x_text_angle
Angle for x-axis text
- aspect.ratio
Aspect ratio of plot panel
- legend.position
Legend position: "none", "left", "right", "bottom", "top"
- legend.direction
Legend direction: "horizontal" or "vertical"
- title
Plot title
- subtitle
Plot subtitle
- xlab
X-axis label
- ylab
Y-axis label
- keep_empty
Whether to keep empty factor levels
- seed
Random seed for reproducibility
- combine
Whether to combine split plots into one
- nrow
Number of rows when combining plots
- ncol
Number of columns when combining plots
- byrow
Fill combined plots by row
- axes
How to handle axes in combined plots ("keep", "collect", "collect_x", "collect_y")
- axis_titles
How to handle axis titles in combined plots
- guides
How to handle guides in combined plots ("collect", "keep", "auto")
- design
Custom layout design for combined plots
- ...
Additional arguments passed to atomic plotting functions.
Examples
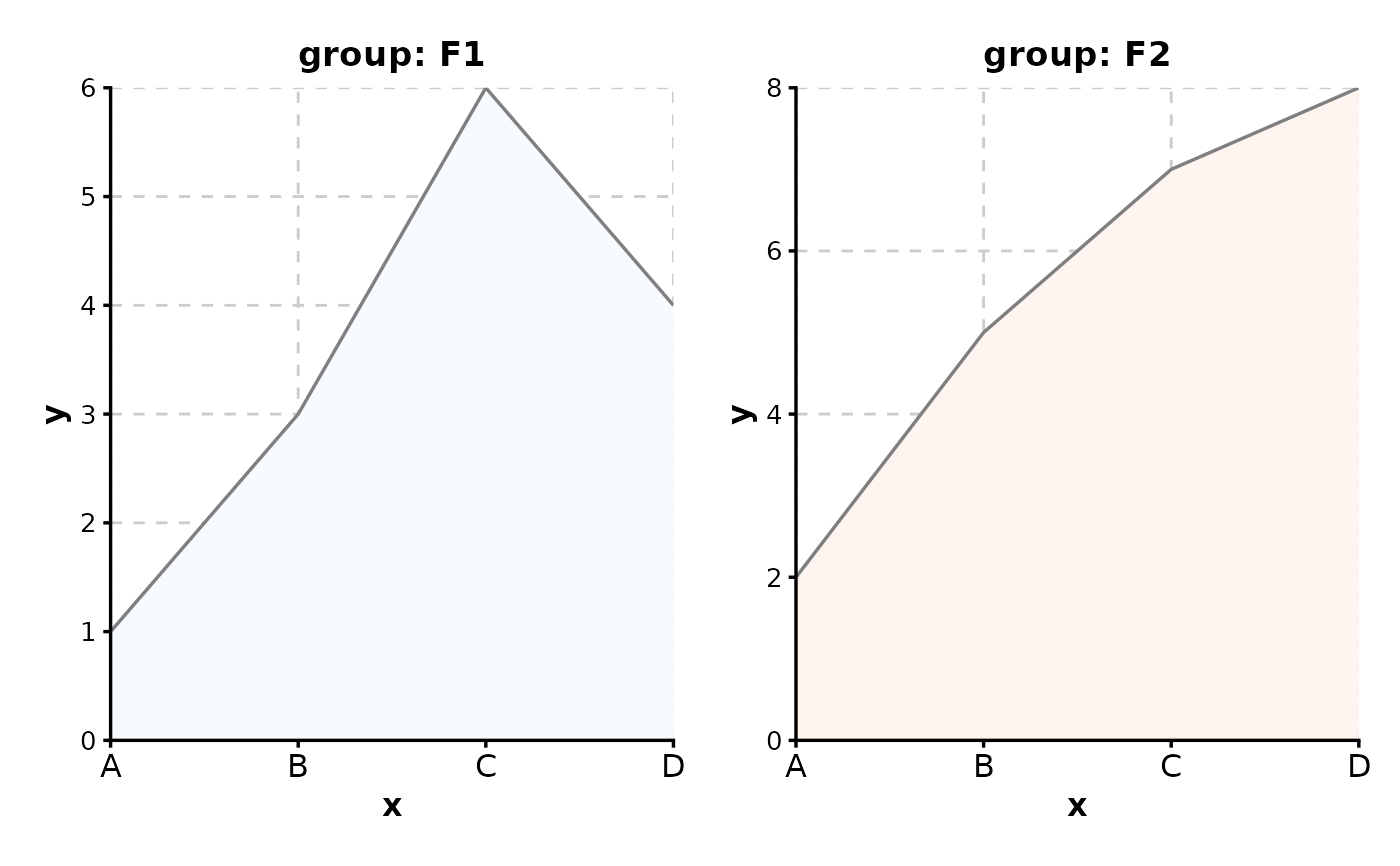
data <- data.frame(
x = rep(c("A", "B", "C", "D"), 2),
y = c(1, 3, 6, 4, 2, 5, 7, 8),
group = rep(c("F1", "F2"), each = 4),
split = rep(c("X", "Y"), 4)
)
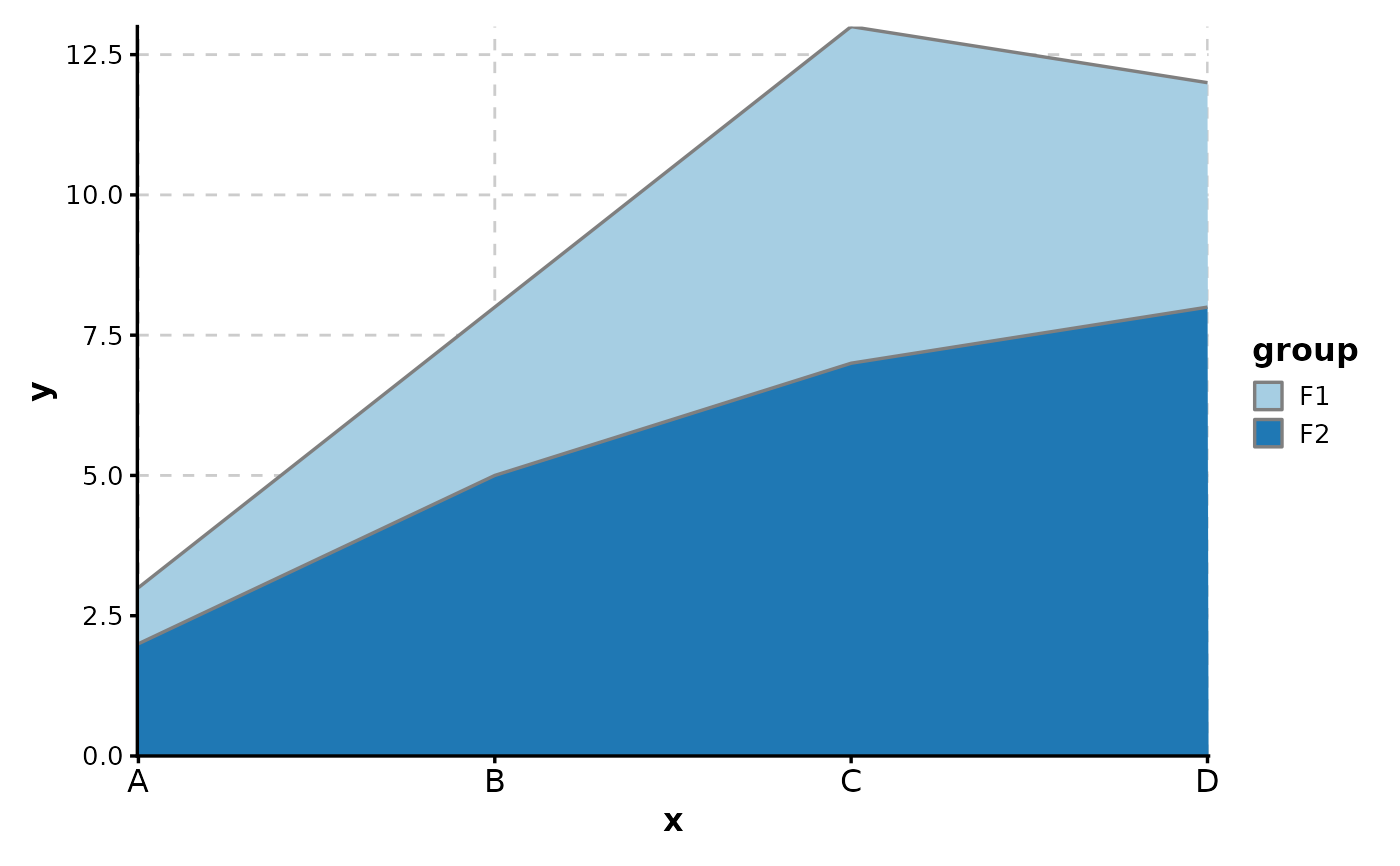
AreaPlot(data, x = "x", y = "y", group_by = "group")
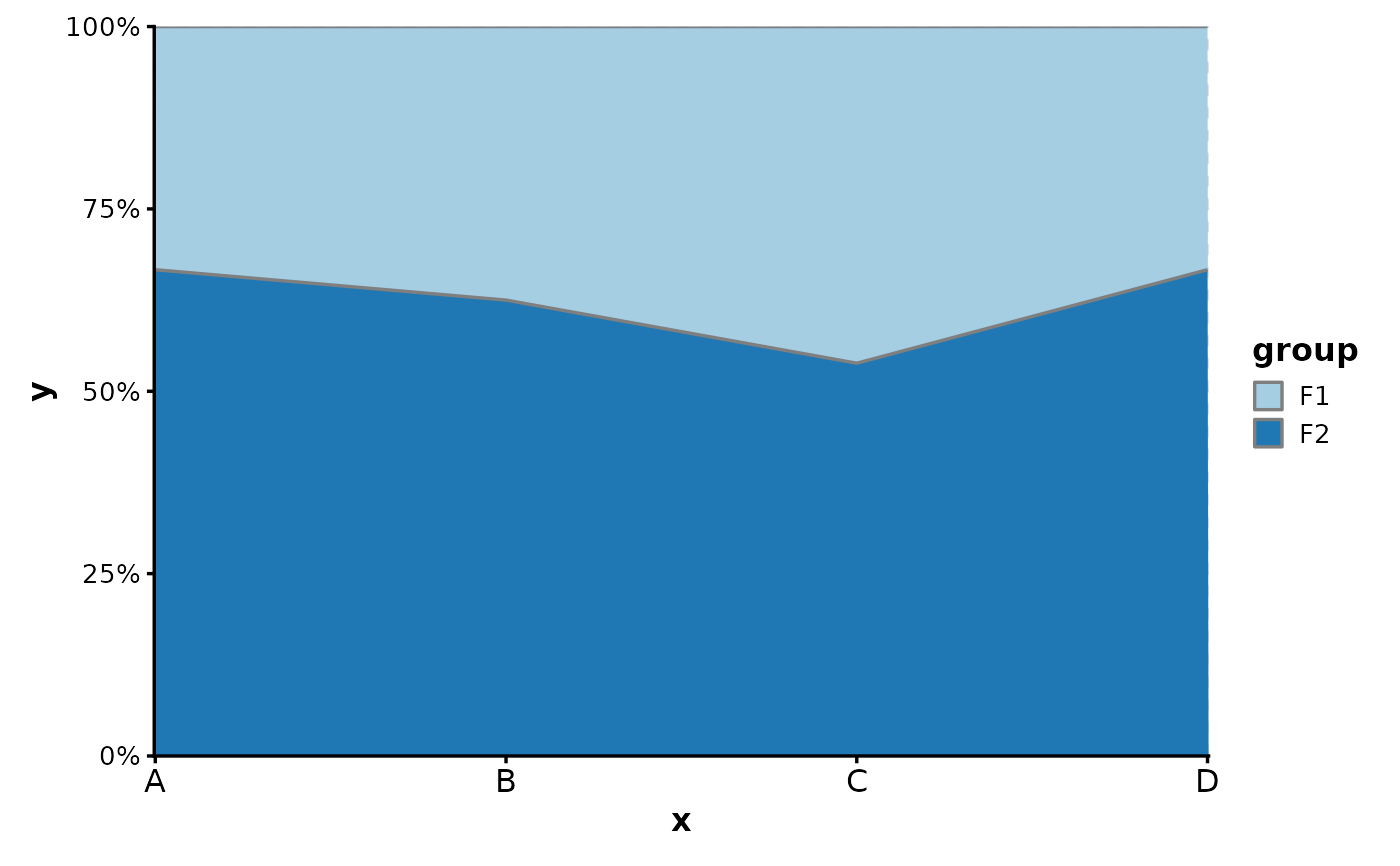
 AreaPlot(data,
x = "x", y = "y", group_by = "group",
scale_y = TRUE
)
AreaPlot(data,
x = "x", y = "y", group_by = "group",
scale_y = TRUE
)
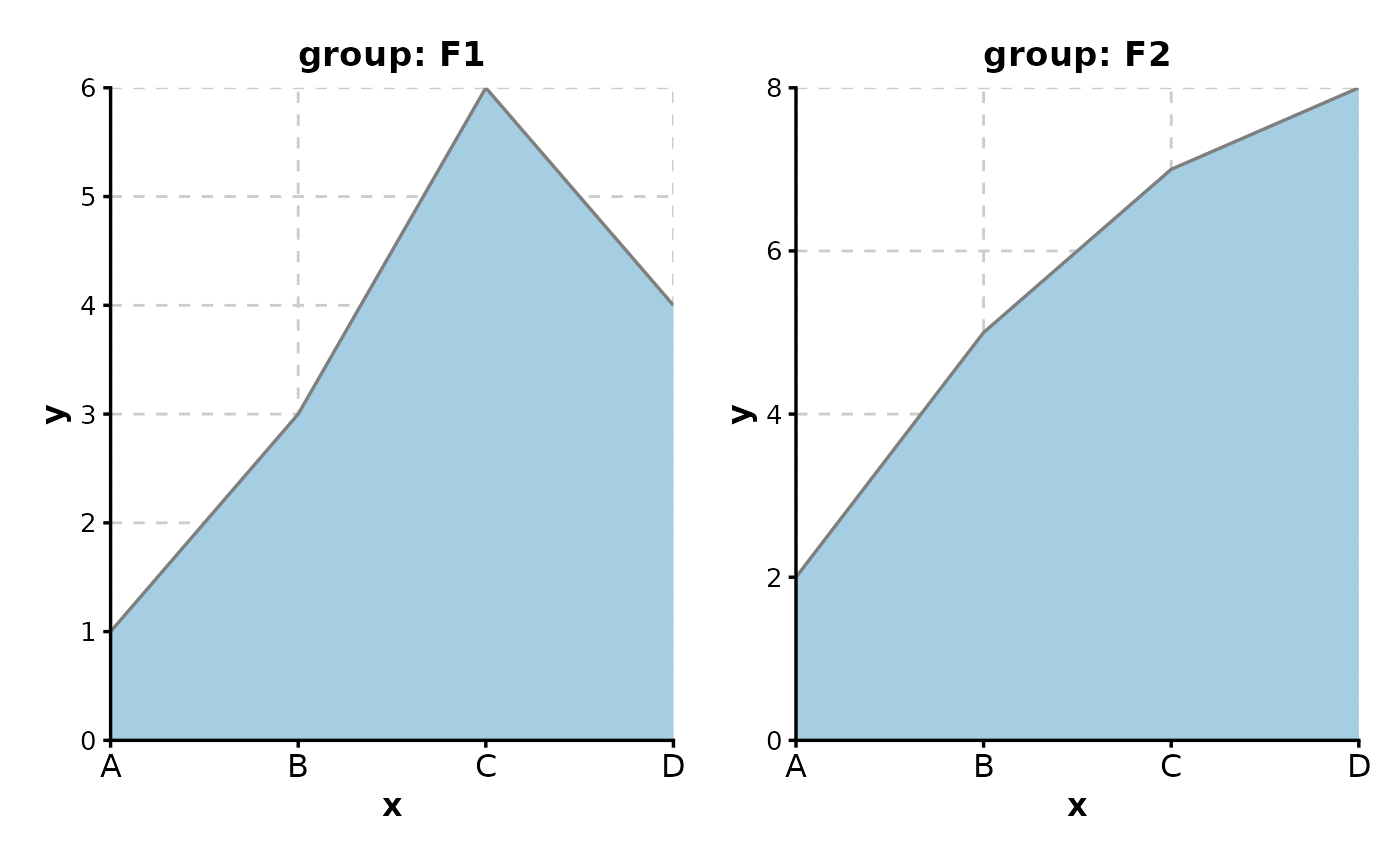
 AreaPlot(data, x = "x", y = "y", split_by = "group")
 AreaPlot(data, x = "x", y = "y", split_by = "group", palette = c(F1 = "Blues", F2 = "Reds"))
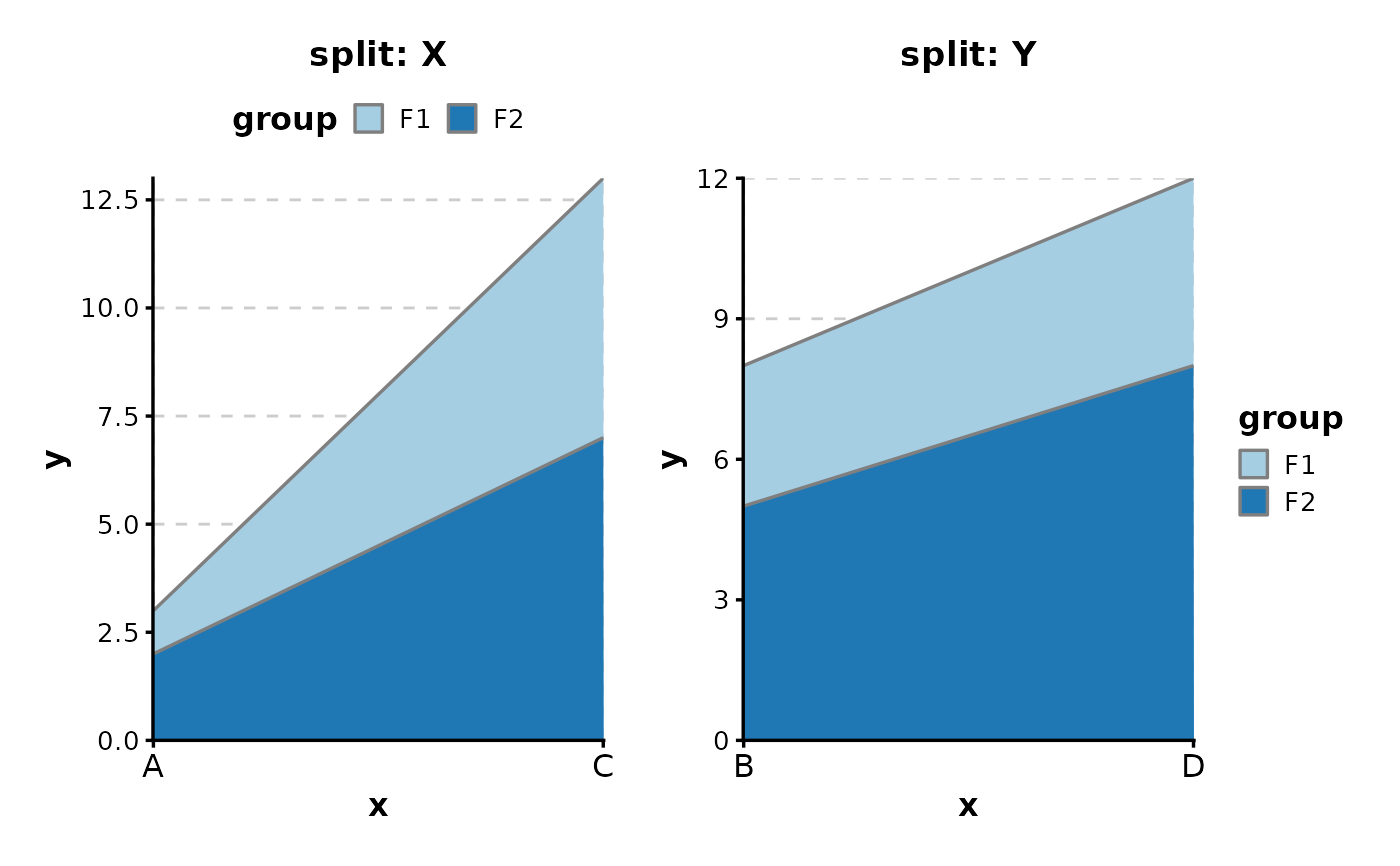
 AreaPlot(data,
x = "x", y = "y", group_by = "group", split_by = "split",
legend.direction = c(X = "horizontal", Y = "vertical"),
legend.position = c(X = "top", Y = "right")
)
AreaPlot(data,
x = "x", y = "y", group_by = "group", split_by = "split",
legend.direction = c(X = "horizontal", Y = "vertical"),
legend.position = c(X = "top", Y = "right")
)