Creates a lollipop plot with a numeric x-axis and categorical y-axis.
This is a convenience wrapper around DotPlot with lollipop = TRUE.
Usage
LollipopPlot(
  data,
  x,
  y,
  y_sep = "_",
  flip = FALSE,
  split_by = NULL,
  split_by_sep = "_",
  size_by = NULL,
  fill_by = NULL,
  fill_cutoff = NULL,
  fill_reverse = FALSE,
  size_name = NULL,
  fill_name = NULL,
  fill_cutoff_name = NULL,
  theme = "theme_ggforge_grid",
  theme_args = list(),
  palette = "Spectral",
  palcolor = NULL,
  alpha = 1,
  facet_by = NULL,
  facet_scales = "fixed",
  facet_ncol = NULL,
  facet_nrow = NULL,
  facet_byrow = TRUE,
  x_text_angle = 0,
  seed = 8525,
  aspect.ratio = NULL,
  legend.position = "right",
  legend.direction = "vertical",
  title = NULL,
  subtitle = NULL,
  xlab = NULL,
  ylab = NULL,
  keep_empty = FALSE,
  combine = TRUE,
  nrow = NULL,
  ncol = NULL,
  byrow = TRUE,
  axes = NULL,
  axis_titles = NULL,
  guides = NULL,
  design = NULL,
  ...
)
Arguments
- data
A data frame containing the data to plot
- x
A character string specifying the column to use for the x-axis (numeric column expected).
- y
A character string specifying the column to use for the y-axis (factor/character column expected).
- y_sep
A character string to concatenate multiple columns in y.
- flip
Whether to flip the x and y axes.
- split_by
Column name(s) to split data into multiple plots
- split_by_sep
Separator when concatenating multiple split_by columns
- size_by
Which column to use as the size of the dots (numeric column). If not provided, the size will be the count of instances for each (x, y) pair. Can also be a single numeric value to specify a fixed size.
- fill_by
Which column to use to fill the dots (numeric column). If not provided, all dots will be filled with the middle color of the palette.
- fill_cutoff
A numeric value specifying the cutoff for the fill column. Values below (or above if
fill_reverse = TRUE) will be shown in grey.- fill_reverse
Whether to reverse the fill direction. If FALSE (default), values < cutoff are grey. If TRUE, values > cutoff are grey.
- size_name
A character string to name the size legend.
- fill_name
A character string to name the fill legend.
- fill_cutoff_name
A character string to name the fill cutoff legend.
- theme
Theme name (string) or theme function
- theme_args
List of arguments passed to theme function
- palette
Color palette name
- palcolor
Custom colors for palette
- alpha
Transparency level (0-1)
- facet_by
Column name(s) for faceting the plot
- facet_scales
Scales for facets: "fixed", "free", "free_x", "free_y"
- facet_ncol
Number of columns in facet layout
- facet_nrow
Number of rows in facet layout
- facet_byrow
Fill facets by row (TRUE) or column (FALSE)
- x_text_angle
Angle for x-axis text.
- seed
Random seed for reproducibility
- aspect.ratio
Aspect ratio of plot panel
- legend.position
Legend position: "none", "left", "right", "bottom", "top"
- legend.direction
Legend direction: "horizontal" or "vertical"
- title
Plot title
- subtitle
Plot subtitle
- xlab
X-axis label
- ylab
Y-axis label
- keep_empty
Whether to keep empty factor levels.
- combine
Whether to combine split plots into one
- nrow
Number of rows when combining plots
- ncol
Number of columns when combining plots
- byrow
Fill combined plots by row
- axes
How to handle axes in combined plots ("keep", "collect", "collect_x", "collect_y")
- axis_titles
How to handle axis titles in combined plots
- guides
How to handle guides in combined plots ("collect", "keep", "auto")
- design
Custom layout design for combined plots
- ...
Additional arguments passed to atomic plotting functions.
Examples
# \donttest{
mtcars <- datasets::mtcars
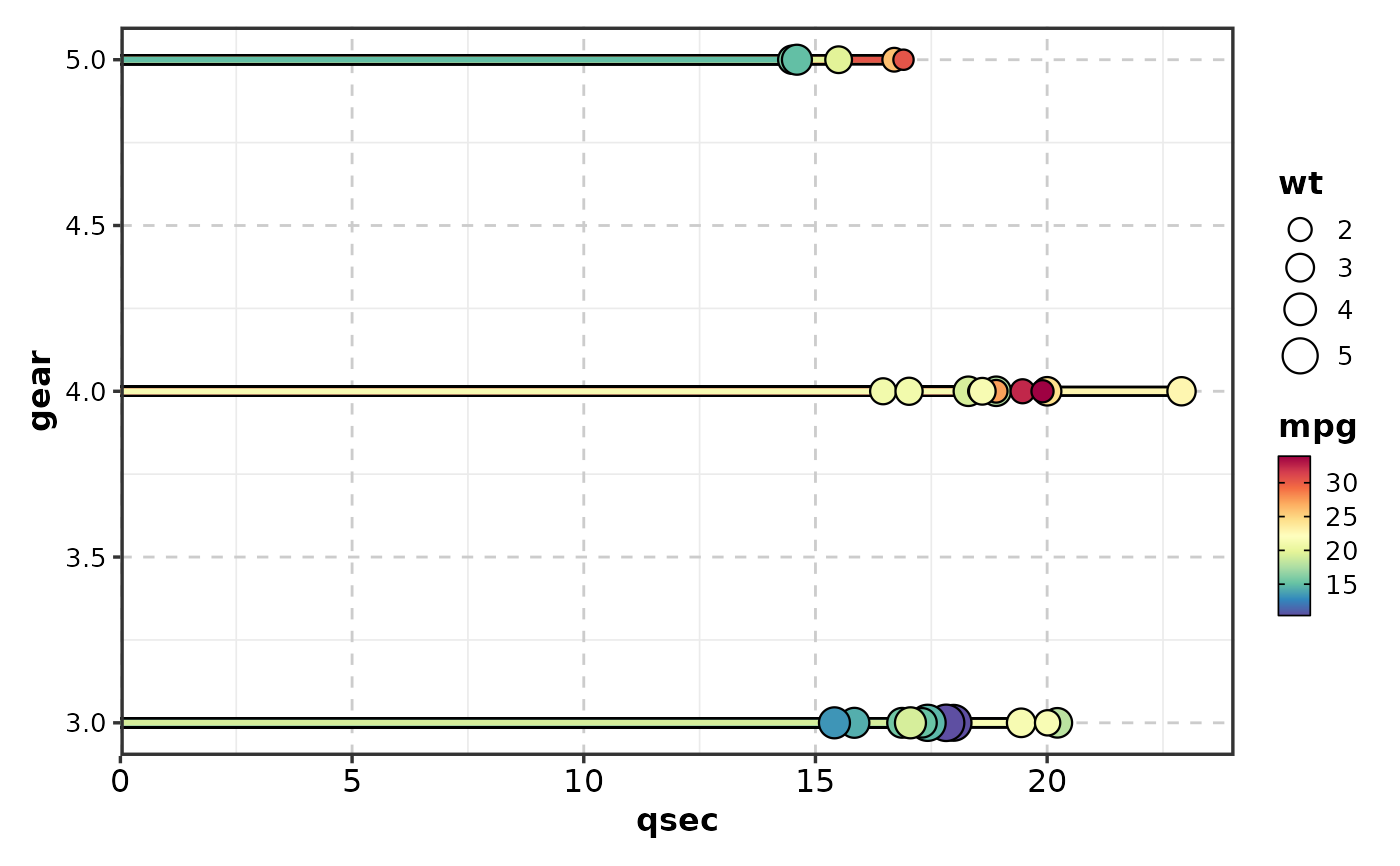
LollipopPlot(mtcars,
x = "qsec", y = "gear", size_by = "wt",
fill_by = "mpg"
)
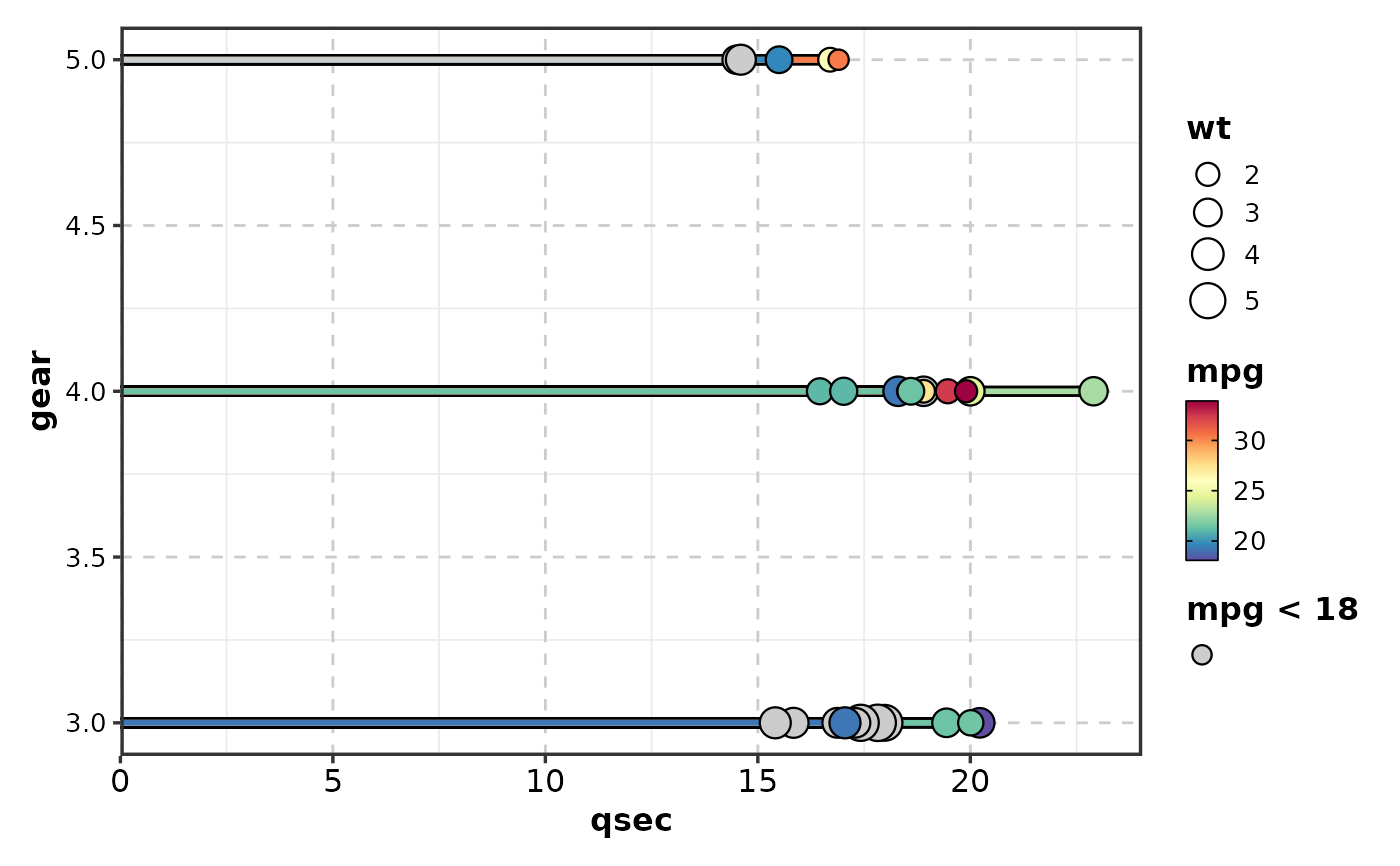
 LollipopPlot(mtcars,
x = "qsec", y = "gear", size_by = "wt",
fill_by = "mpg", fill_cutoff = 18
)
LollipopPlot(mtcars,
x = "qsec", y = "gear", size_by = "wt",
fill_by = "mpg", fill_cutoff = 18
)
 # }
# }