Creates histograms to illustrate the distribution of continuous data. Supports grouping, faceting, splitting, and trend lines.
Usage
Histogram(
  data,
  x,
  group_by = NULL,
  group_by_sep = "_",
  group_name = NULL,
  xtrans = "identity",
  ytrans = "identity",
  split_by = NULL,
  split_by_sep = "_",
  flip = FALSE,
  bins = NULL,
  binwidth = NULL,
  trend_skip_zero = FALSE,
  add_rug = FALSE,
  rug_alpha = 0.5,
  rug_length = 0.03,
  add_bars = FALSE,
  bar_height = 0.025,
  bar_alpha = 1,
  bar_width = 0.1,
  position = "identity",
  use_trend = FALSE,
  add_trend = FALSE,
  trend_alpha = 1,
  trend_linewidth = 0.8,
  trend_pt_size = 1.5,
  palette = "forge",
  palcolor = NULL,
  alpha = 0.5,
  theme = "theme_ggforge",
  theme_args = list(),
  title = NULL,
  subtitle = NULL,
  xlab = NULL,
  ylab = NULL,
  expand = c(bottom = 0, left = 0, right = 0),
  facet_by = NULL,
  facet_scales = "free_y",
  facet_ncol = NULL,
  facet_nrow = NULL,
  facet_byrow = TRUE,
  legend.position = "right",
  legend.direction = "vertical",
  seed = 8525,
  combine = TRUE,
  nrow = NULL,
  ncol = NULL,
  byrow = TRUE,
  axes = NULL,
  axis_titles = axes,
  guides = NULL,
  design = NULL,
  ...
)
Arguments
- data
A data frame containing the data to plot
- x
Column name for values (numeric expected)
- group_by
Column to group the data
- group_by_sep
Separator for concatenating multiple group_by columns
- group_name
Legend title for group_by
- xtrans
Transformation for x-axis (e.g., "identity", "log10")
- ytrans
Transformation for y-axis
- split_by
Column to split data into multiple plots
- split_by_sep
Separator for concatenating multiple split_by columns
- flip
Whether to flip the plot
- bins
Number of bins for histogram
- binwidth
Width of bins for histogram
- trend_skip_zero
Skip zero counts in trend line
- add_rug
Whether to add rug marks at bottom showing individual data points.
- rug_alpha
Alpha transparency for rug marks.
- rug_length
Length of rug marks as fraction of plot.
- add_bars
Whether to add data distribution lines at bottom
- bar_height
Height of distribution bars (as fraction of max)
- bar_alpha
Alpha for distribution bars
- bar_width
Width of distribution bars
- position
Position adjustment for overlapping groups
- use_trend
Use trend line instead of histogram bars
- add_trend
Add trend line to histogram
- trend_alpha
Alpha for trend line and points
- trend_linewidth
Width of trend line
- trend_pt_size
Size of trend points
- palette
Palette name
- palcolor
Custom colors
- alpha
Transparency for density curves
- theme
Theme name or function
- theme_args
Arguments passed to theme function
- title
Plot title
- subtitle
Plot subtitle
- xlab
X-axis label
- ylab
Y-axis label
- expand
Axis expansion
- facet_by
Columns for faceting
- facet_scales
Facet scales type
- facet_ncol
Number of facet columns
- facet_nrow
Number of facet rows
- facet_byrow
Fill facets by row
- legend.position
Legend position
- legend.direction
Legend direction
- seed
Random seed
- combine
Whether to combine multiple plots
- nrow
Number of rows for combined plots
- ncol
Number of columns for combined plots
- byrow
Fill combined plots by row
- axes
Axis handling for combined plots
- axis_titles
Axis title handling for combined plots
- guides
Guide handling for combined plots
- design
Custom design for combined plots
- ...
Additional arguments passed to geom_density
Examples
set.seed(8525)
data <- data.frame(
x = sample(setdiff(1:100, c(30:36, 50:55, 70:77)), 1000, replace = TRUE),
group = factor(rep(c("A", "B"), each = 500), levels = c("A", "B")),
facet = sample(c("F1", "F2"), 1000, replace = TRUE)
)
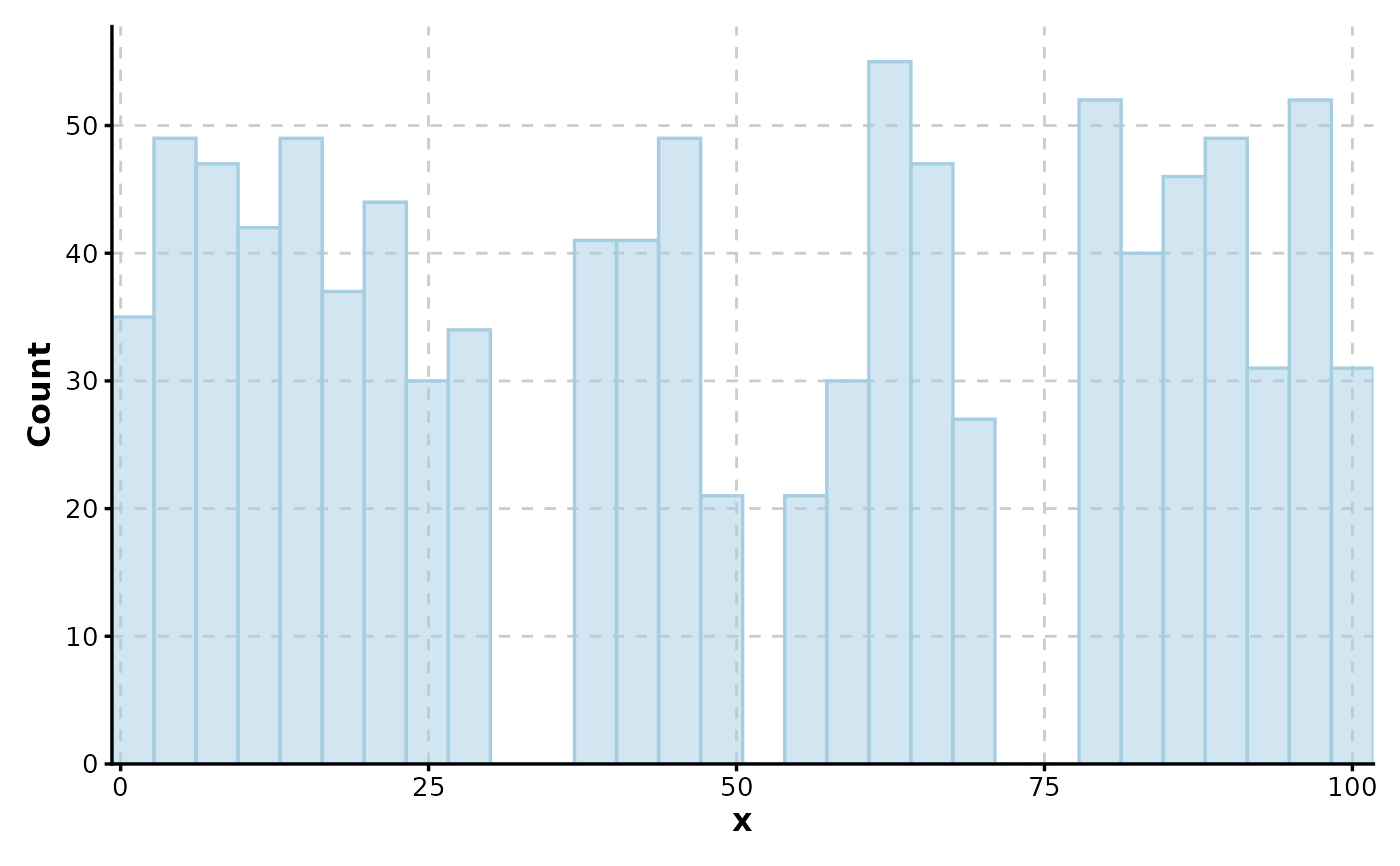
Histogram(data, x = "x")
#> Using `bins = 30`. Pick a better value with `binwidth`.
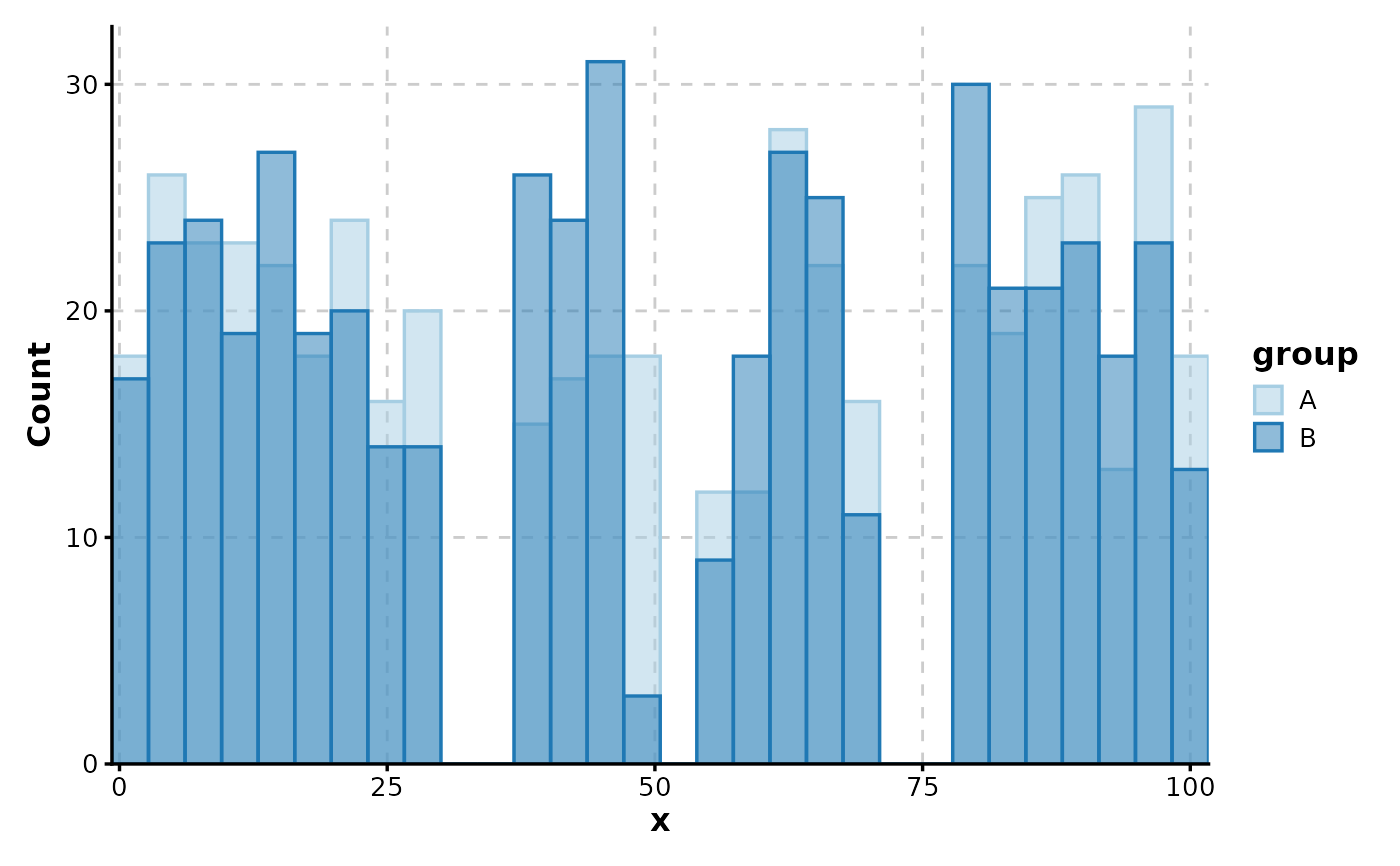
 Histogram(data, x = "x", group_by = "group")
#> Using `bins = 30`. Pick a better value with `binwidth`.
Histogram(data, x = "x", group_by = "group")
#> Using `bins = 30`. Pick a better value with `binwidth`.
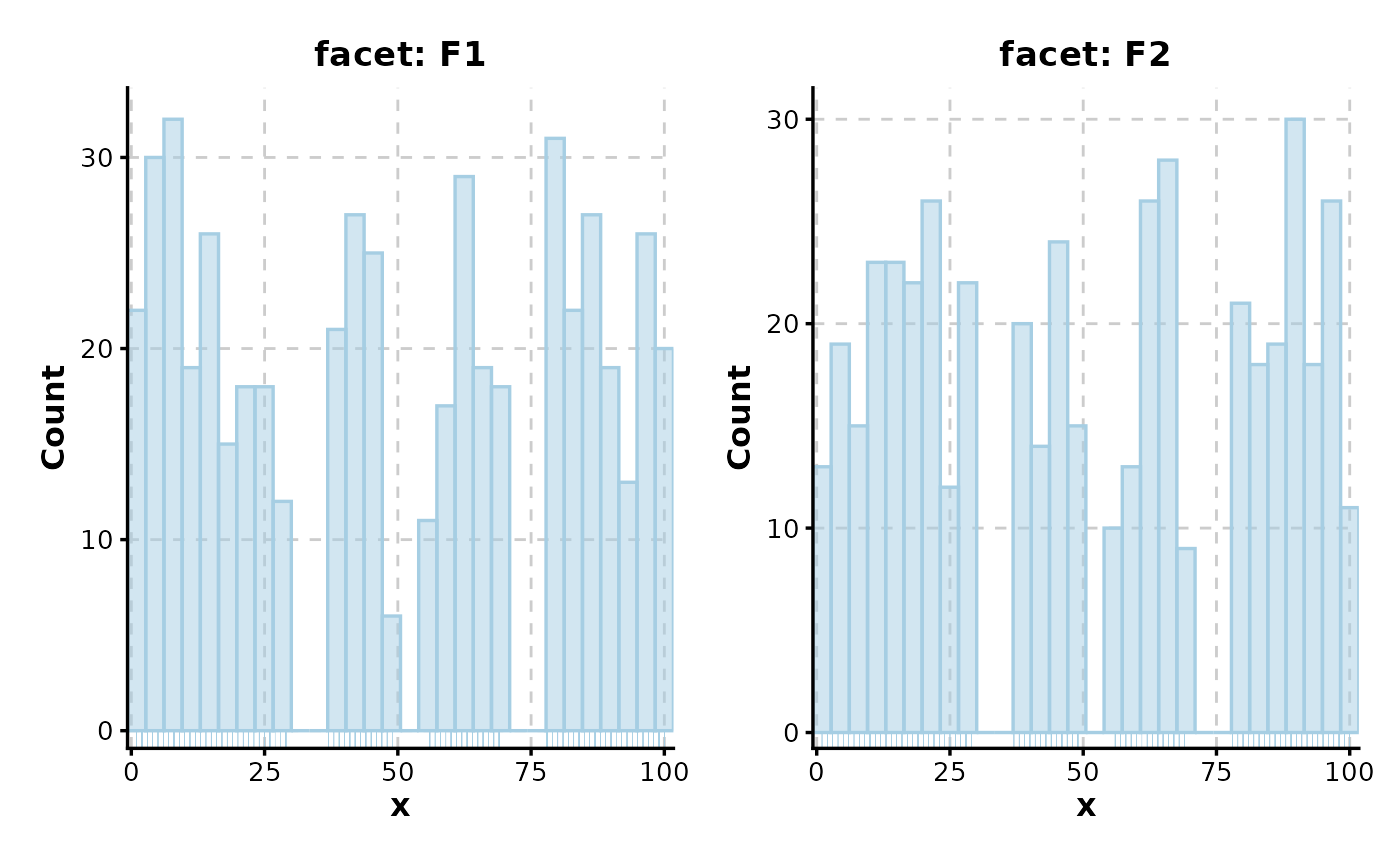
 Histogram(data, x = "x", split_by = "facet", add_bars = TRUE)
#> Using `bins = 30`. Pick a better value with `binwidth`.
#> Using `bins = 30`. Pick a better value with `binwidth`.
Histogram(data, x = "x", split_by = "facet", add_bars = TRUE)
#> Using `bins = 30`. Pick a better value with `binwidth`.
#> Using `bins = 30`. Pick a better value with `binwidth`.
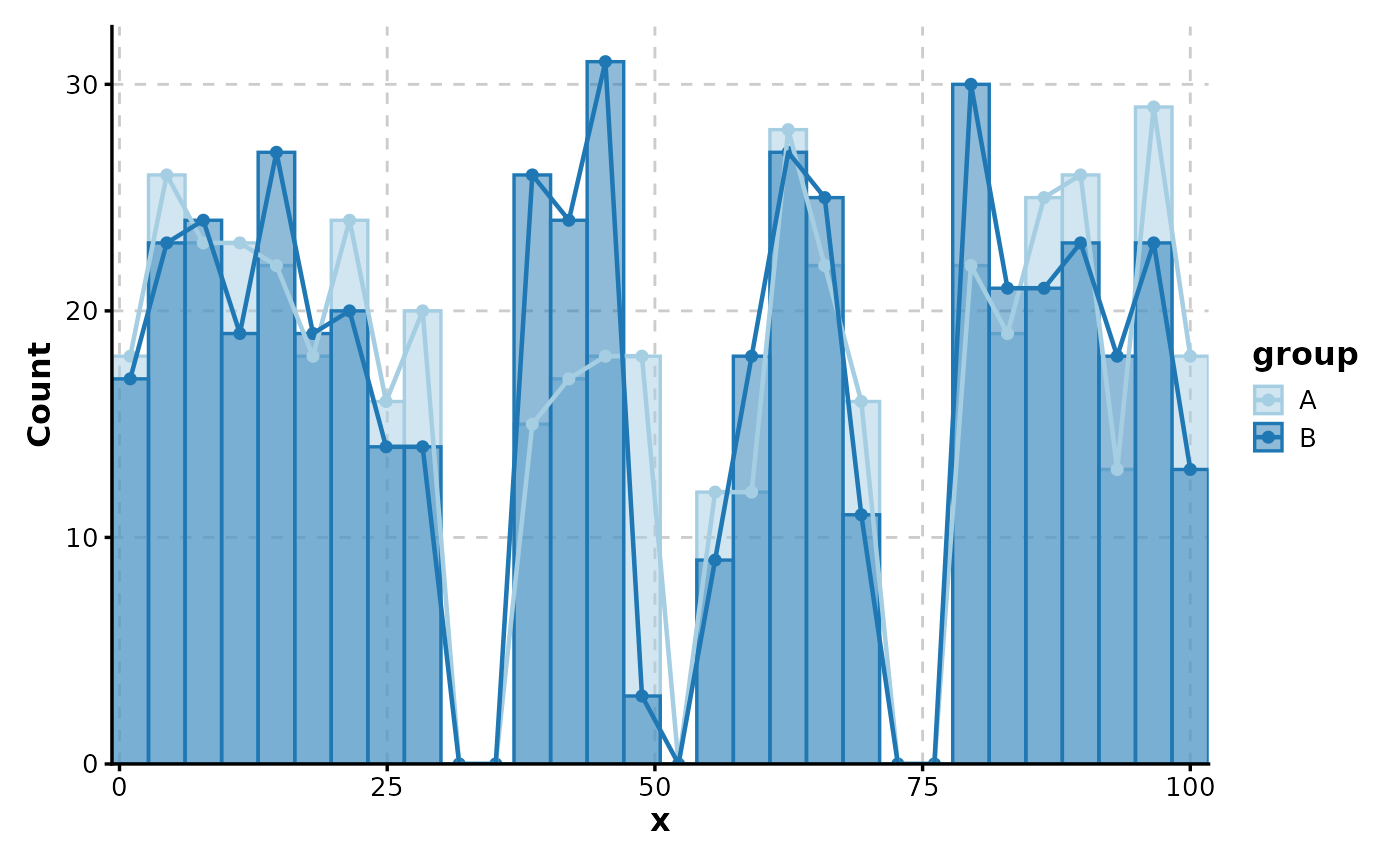
 Histogram(data, x = "x", group_by = "group", add_trend = TRUE)
#> Using `bins = 30`. Pick a better value with `binwidth`.
Histogram(data, x = "x", group_by = "group", add_trend = TRUE)
#> Using `bins = 30`. Pick a better value with `binwidth`.