Creates treemap (rectangular tree) plots for visualizing hierarchical data as nested rectangles. Useful for any data with proportional or hierarchical structure. Requires the treemapify package.
Usage
TreemapPlot(
  data,
  area,
  fill = NULL,
  fill_name = NULL,
  group = NULL,
  subgroup = NULL,
  label = NULL,
  label_size = 4,
  label_color = "white",
  border_color = "white",
  border_width = 1,
  split_by = NULL,
  split_by_sep = "_",
  theme = "theme_ggforge",
  theme_args = list(),
  palette = "forge",
  palcolor = NULL,
  alpha = 1,
  legend.position = "right",
  legend.direction = "vertical",
  title = NULL,
  subtitle = NULL,
  xlab = NULL,
  ylab = NULL,
  seed = 8525,
  combine = TRUE,
  nrow = NULL,
  ncol = NULL,
  byrow = TRUE,
  axes = NULL,
  axis_titles = NULL,
  guides = NULL,
  design = NULL,
  ...
)
Arguments
- data
A data frame containing the data to plot
- area
Column for rectangle area (numeric).
- fill
Column for rectangle fill color.
- fill_name
Legend title for fill.
- group
Column for primary grouping.
- subgroup
Column for nested grouping within groups.
- label
Column for rectangle labels. TRUE uses
groupcolumn.- label_size
Label text size.
- label_color
Label text color.
- border_color
Border color for rectangles.
- border_width
Border width for rectangles.
- split_by
Column name(s) to split data into multiple plots
- split_by_sep
Separator when concatenating multiple split_by columns
- theme
Theme name (string) or theme function
- theme_args
List of arguments passed to theme function
- palette
Color palette name
- palcolor
Custom colors for palette
- alpha
Transparency level (0-1)
- legend.position
Legend position: "none", "left", "right", "bottom", "top"
- legend.direction
Legend direction: "horizontal" or "vertical"
- title
Plot title
- subtitle
Plot subtitle
- xlab
X-axis label
- ylab
Y-axis label
- seed
Random seed for reproducibility
- combine
Whether to combine split plots into one
- nrow
Number of rows when combining plots
- ncol
Number of columns when combining plots
- byrow
Fill combined plots by row
- axes
How to handle axes in combined plots ("keep", "collect", "collect_x", "collect_y")
- axis_titles
How to handle axis titles in combined plots
- guides
How to handle guides in combined plots ("collect", "keep", "auto")
- design
Custom layout design for combined plots
- ...
Additional arguments passed to atomic plotting functions.
Examples
# \donttest{
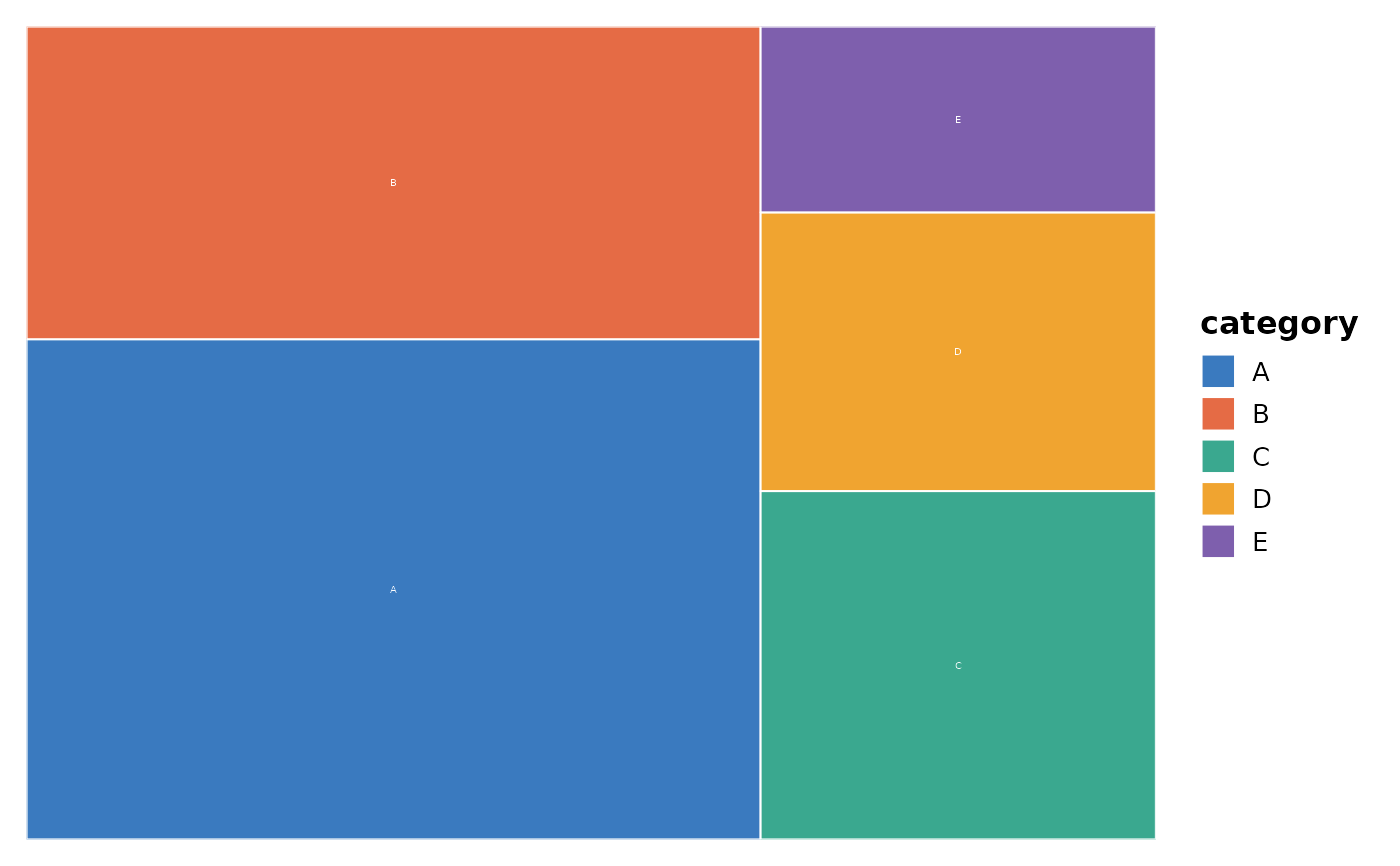
data <- data.frame(
category = c("A", "B", "C", "D", "E"),
value = c(40, 25, 15, 12, 8),
group = c("G1", "G1", "G2", "G2", "G2")
)
TreemapPlot(data, area = "value", fill = "category", group = "category")
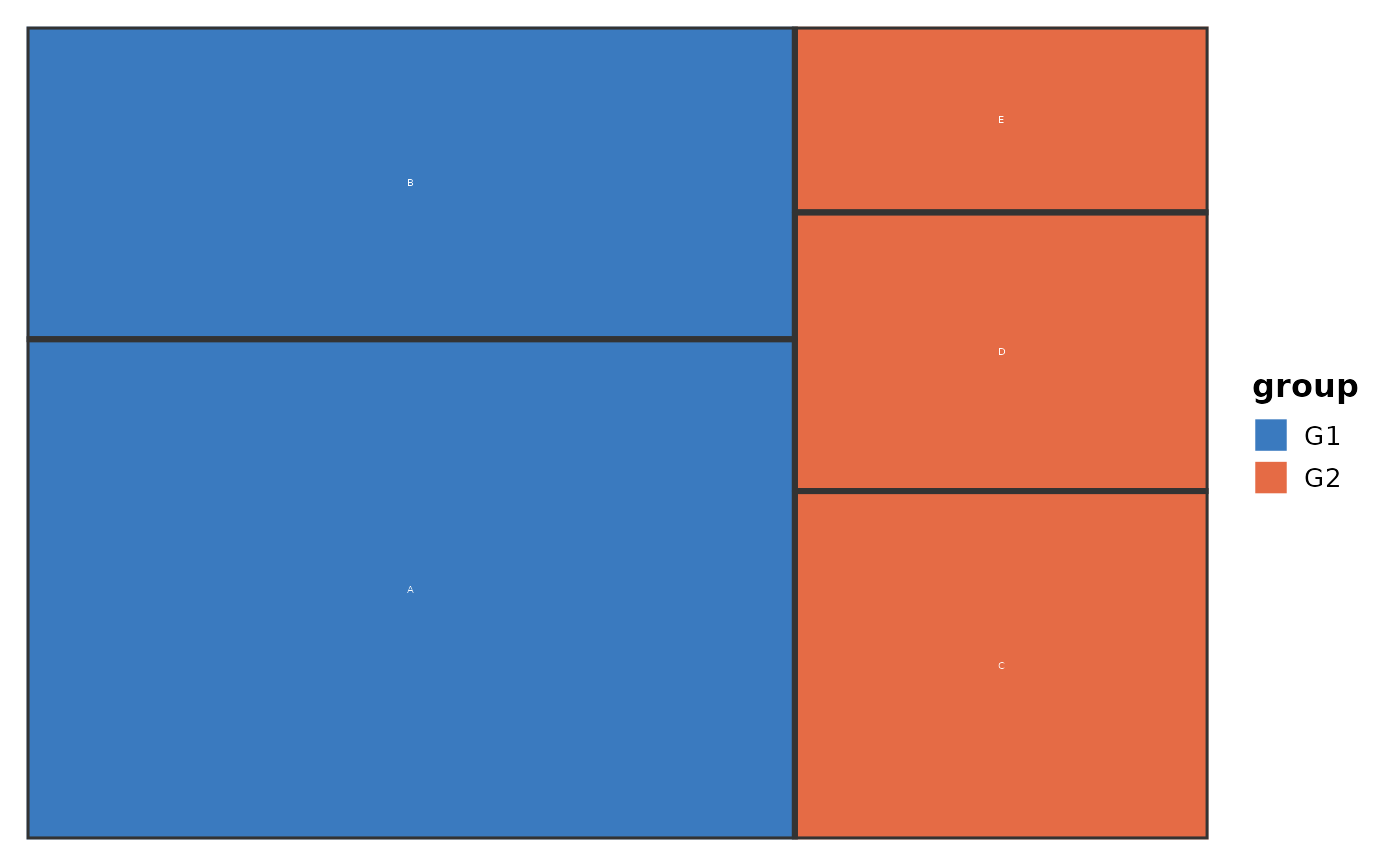
 TreemapPlot(data, area = "value", fill = "group", group = "group",
subgroup = "category", label = "category")
#> Warning: Ignoring unknown aesthetics: subgroup
#> Warning: Ignoring unknown aesthetics: subgroup
TreemapPlot(data, area = "value", fill = "group", group = "group",
subgroup = "category", label = "category")
#> Warning: Ignoring unknown aesthetics: subgroup
#> Warning: Ignoring unknown aesthetics: subgroup
 # }
# }