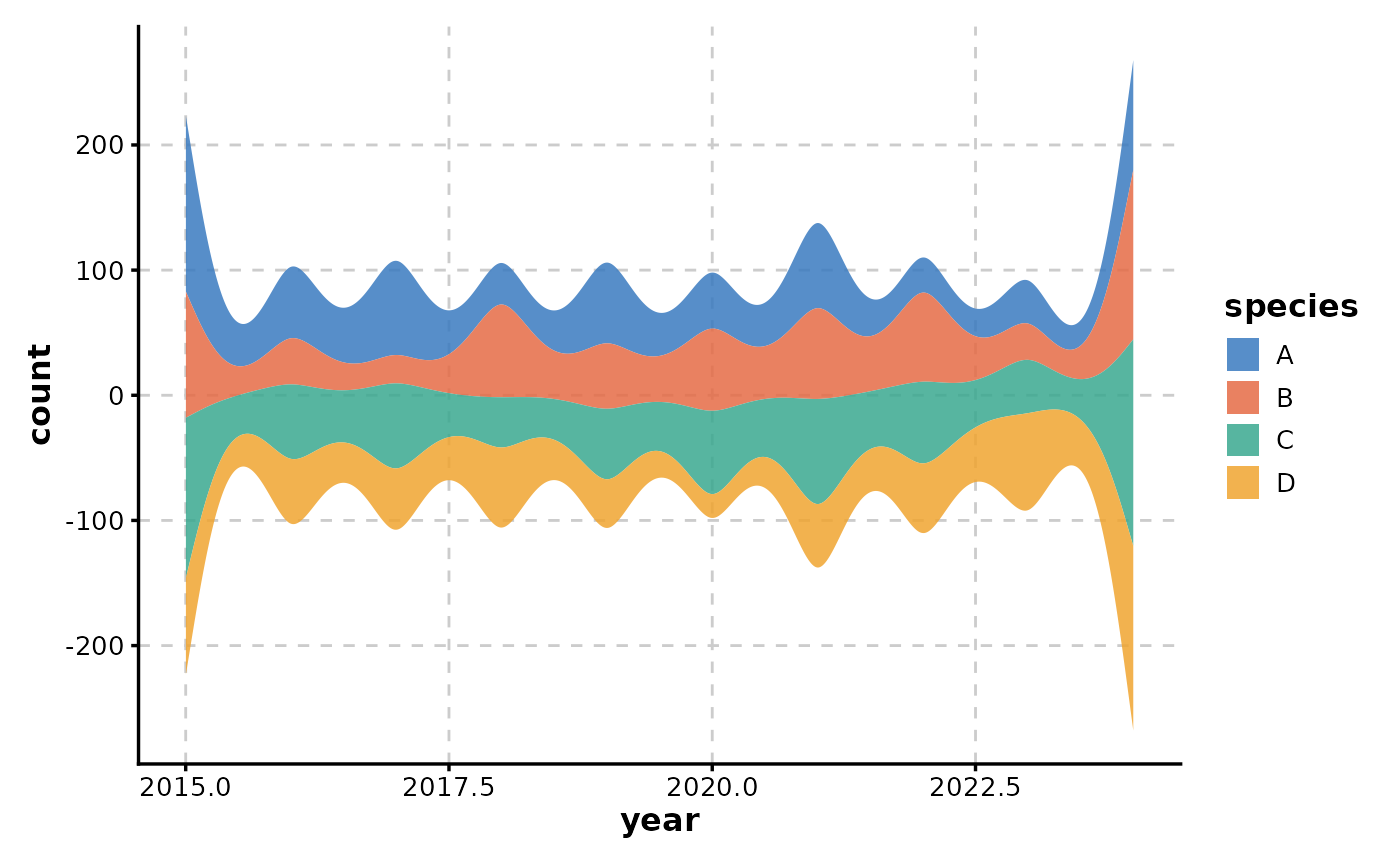
Creates stream (river) graphs showing how composition changes over a continuous or ordered variable. Unlike AreaPlot (which uses stacking), StreamGraph uses a symmetric baseline producing a "river" shape. Requires the ggstream package.
Usage
StreamGraph(
  data,
  x,
  y,
  group_by,
  group_by_sep = "_",
  group_name = NULL,
  type = c("mirror", "proportional", "ridge"),
  sorting = c("none", "onset", "inside_out"),
  bw = 0.75,
  split_by = NULL,
  split_by_sep = "_",
  facet_by = NULL,
  facet_scales = "fixed",
  facet_nrow = NULL,
  facet_ncol = NULL,
  facet_byrow = TRUE,
  theme = "theme_ggforge",
  theme_args = list(),
  palette = "forge",
  palcolor = NULL,
  alpha = 0.85,
  aspect.ratio = NULL,
  legend.position = "right",
  legend.direction = "vertical",
  title = NULL,
  subtitle = NULL,
  xlab = NULL,
  ylab = NULL,
  seed = 8525,
  combine = TRUE,
  nrow = NULL,
  ncol = NULL,
  byrow = TRUE,
  axes = NULL,
  axis_titles = NULL,
  guides = NULL,
  design = NULL,
  ...
)
Arguments
- data
A data frame containing the data to plot
- x
Column for x-axis (typically time or ordered variable).
- y
Column for y-axis values (numeric).
- group_by
Column for grouping streams.
- group_by_sep
Separator for multiple group_by columns.
- group_name
Legend title for groups.
- type
Stream type: "mirror" (symmetric), "proportional", or "ridge".
- sorting
Sorting method for streams: "none", "onset", or "inside_out".
- bw
Bandwidth for smoothing.
- split_by
Column name(s) to split data into multiple plots
- split_by_sep
Separator when concatenating multiple split_by columns
- facet_by
Column name(s) for faceting the plot
- facet_scales
Scales for facets: "fixed", "free", "free_x", "free_y"
- facet_nrow
Number of rows in facet layout
- facet_ncol
Number of columns in facet layout
- facet_byrow
Fill facets by row (TRUE) or column (FALSE)
- theme
Theme name (string) or theme function
- theme_args
List of arguments passed to theme function
- palette
Color palette name
- palcolor
Custom colors for palette
- alpha
Transparency level (0-1)
- aspect.ratio
Aspect ratio of plot panel
- legend.position
Legend position: "none", "left", "right", "bottom", "top"
- legend.direction
Legend direction: "horizontal" or "vertical"
- title
Plot title
- subtitle
Plot subtitle
- xlab
X-axis label
- ylab
Y-axis label
- seed
Random seed for reproducibility
- combine
Whether to combine split plots into one
- nrow
Number of rows when combining plots
- ncol
Number of columns when combining plots
- byrow
Fill combined plots by row
- axes
How to handle axes in combined plots ("keep", "collect", "collect_x", "collect_y")
- axis_titles
How to handle axis titles in combined plots
- guides
How to handle guides in combined plots ("collect", "keep", "auto")
- design
Custom layout design for combined plots
- ...
Additional arguments passed to atomic plotting functions.