Visualizing the change of a numeric value over the progression of a categorical variable. Supports both single lines and grouped lines with extensive customization options.
Usage
LinePlot(
  data,
  x,
  y = NULL,
  x_sep = "_",
  group_by = NULL,
  group_by_sep = "_",
  group_name = NULL,
  fill_point_by_x_if_no_group = TRUE,
  color_line_by_x_if_no_group = TRUE,
  add_smooth = FALSE,
  smooth_method = "loess",
  smooth_se = FALSE,
  smooth_color = NULL,
  smooth_width = 1,
  smooth_alpha = 0.8,
  add_bg = FALSE,
  bg_palette = "stripe",
  bg_palcolor = NULL,
  bg_alpha = 0.2,
  add_errorbars = FALSE,
  errorbar_width = 0.1,
  errorbar_alpha = 1,
  errorbar_color = "grey30",
  errorbar_linewidth = 0.75,
  errorbar_min = NULL,
  errorbar_max = NULL,
  errorbar_sd = NULL,
  highlight = NULL,
  highlight_size = NULL,
  highlight_color = "red2",
  highlight_alpha = 0.8,
  pt_alpha = 1,
  pt_size = 5,
  line_type = "solid",
  line_width = 1,
  line_alpha = 0.8,
  add_hline = FALSE,
  hline_type = "solid",
  hline_width = 0.5,
  hline_color = "black",
  hline_alpha = 1,
  split_by = NULL,
  split_by_sep = "_",
  facet_by = NULL,
  facet_scales = "fixed",
  facet_nrow = NULL,
  facet_ncol = NULL,
  facet_byrow = TRUE,
  theme = "theme_ggforge",
  theme_args = list(),
  palette = "forge",
  palcolor = NULL,
  alpha = 1,
  x_text_angle = 0,
  aspect.ratio = NULL,
  legend.position = "right",
  legend.direction = "vertical",
  title = NULL,
  subtitle = NULL,
  xlab = NULL,
  ylab = NULL,
  keep_empty = FALSE,
  seed = 8525,
  combine = TRUE,
  nrow = NULL,
  ncol = NULL,
  byrow = TRUE,
  axes = NULL,
  axis_titles = NULL,
  guides = NULL,
  design = NULL,
  ...
)
Arguments
- data
A data frame containing the data to plot
- x
Column for x-axis (categorical)
- y
Column for y-axis (numeric). If NULL, counts will be used
- x_sep
Separator for concatenating multiple x columns
- group_by
Column to group lines by. If NULL, creates a single line
- group_by_sep
Separator for concatenating multiple group_by columns
- group_name
Legend name for groups
- fill_point_by_x_if_no_group
Logical. If TRUE and no group_by, color points by x values
- color_line_by_x_if_no_group
Logical. If TRUE and no group_by, color lines by x values
- add_smooth
Whether to add a smoothing line.
- smooth_method
Smoothing method (e.g., "loess", "lm").
- smooth_se
Whether to show confidence interval around smooth.
- smooth_color
Color for smooth line (NULL uses group colors).
- smooth_width
Line width for smooth line.
- smooth_alpha
Alpha transparency for smooth line.
- add_bg
Logical. Add background stripes
- bg_palette
Palette for background
- bg_palcolor
Custom colors for background
- bg_alpha
Alpha value for background
- add_errorbars
Logical. Add error bars
- errorbar_width
Width of error bars
- errorbar_alpha
Alpha value for error bars
- errorbar_color
Color for error bars. Use "line" to match line colors
- errorbar_linewidth
Line width for error bars
- errorbar_min
Column containing lower error bounds
- errorbar_max
Column containing upper error bounds
- errorbar_sd
Column containing standard deviation. Used if min/max not provided
- highlight
Rows to highlight. Can be numeric index, rownames, or expression string
- highlight_size
Size of highlighted points
- highlight_color
Color for highlighted points
- highlight_alpha
Alpha for highlighted points
- pt_alpha
Alpha value for points
- pt_size
Size of points
- line_type
Line type
- line_width
Line width
- line_alpha
Alpha value for lines
- add_hline
Y-intercept for horizontal line(s). Can be numeric or named list for groups
- hline_type
Line type for horizontal line
- hline_width
Line width for horizontal line
- hline_color
Color for horizontal line. Use TRUE to match group colors
- hline_alpha
Alpha for horizontal line
- split_by
Column name(s) to split data into multiple plots
- split_by_sep
Separator when concatenating multiple split_by columns
- facet_by
Column name(s) for faceting the plot
- facet_scales
Scales for facets: "fixed", "free", "free_x", "free_y"
- facet_nrow
Number of rows in facet layout
- facet_ncol
Number of columns in facet layout
- facet_byrow
Fill facets by row (TRUE) or column (FALSE)
- theme
Theme name (string) or theme function
- theme_args
List of arguments passed to theme function
- palette
Color palette name
- palcolor
Custom colors for palette
- alpha
Transparency level (0-1)
- x_text_angle
Angle for x-axis text
- aspect.ratio
Aspect ratio of plot panel
- legend.position
Legend position: "none", "left", "right", "bottom", "top"
- legend.direction
Legend direction: "horizontal" or "vertical"
- title
Plot title
- subtitle
Plot subtitle
- xlab
X-axis label
- ylab
Y-axis label
- keep_empty
Keep empty factor levels
- seed
Random seed for reproducibility
- combine
Whether to combine split plots into one
- nrow
Number of rows when combining plots
- ncol
Number of columns when combining plots
- byrow
Fill combined plots by row
- axes
How to handle axes in combined plots ("keep", "collect", "collect_x", "collect_y")
- axis_titles
How to handle axis titles in combined plots
- guides
How to handle guides in combined plots ("collect", "keep", "auto")
- design
Custom layout design for combined plots
- ...
Additional arguments passed to atomic plotting functions.
Examples
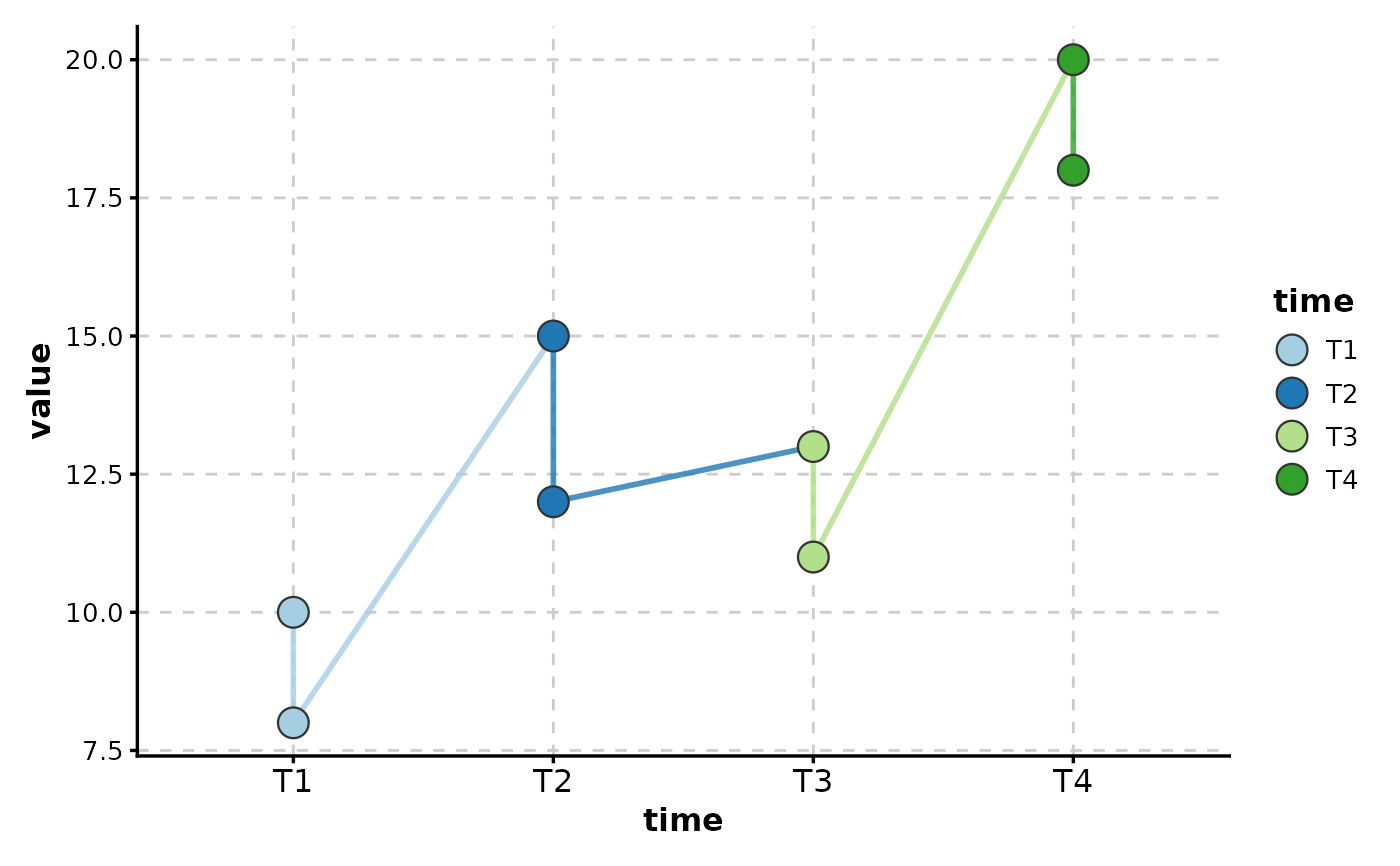
# Basic line plot
data <- data.frame(
time = rep(c("T1", "T2", "T3", "T4"), 2),
value = c(10, 15, 13, 20, 8, 12, 11, 18),
group = rep(c("Control", "Treatment"), each = 4)
)
LinePlot(data, x = "time", y = "value")
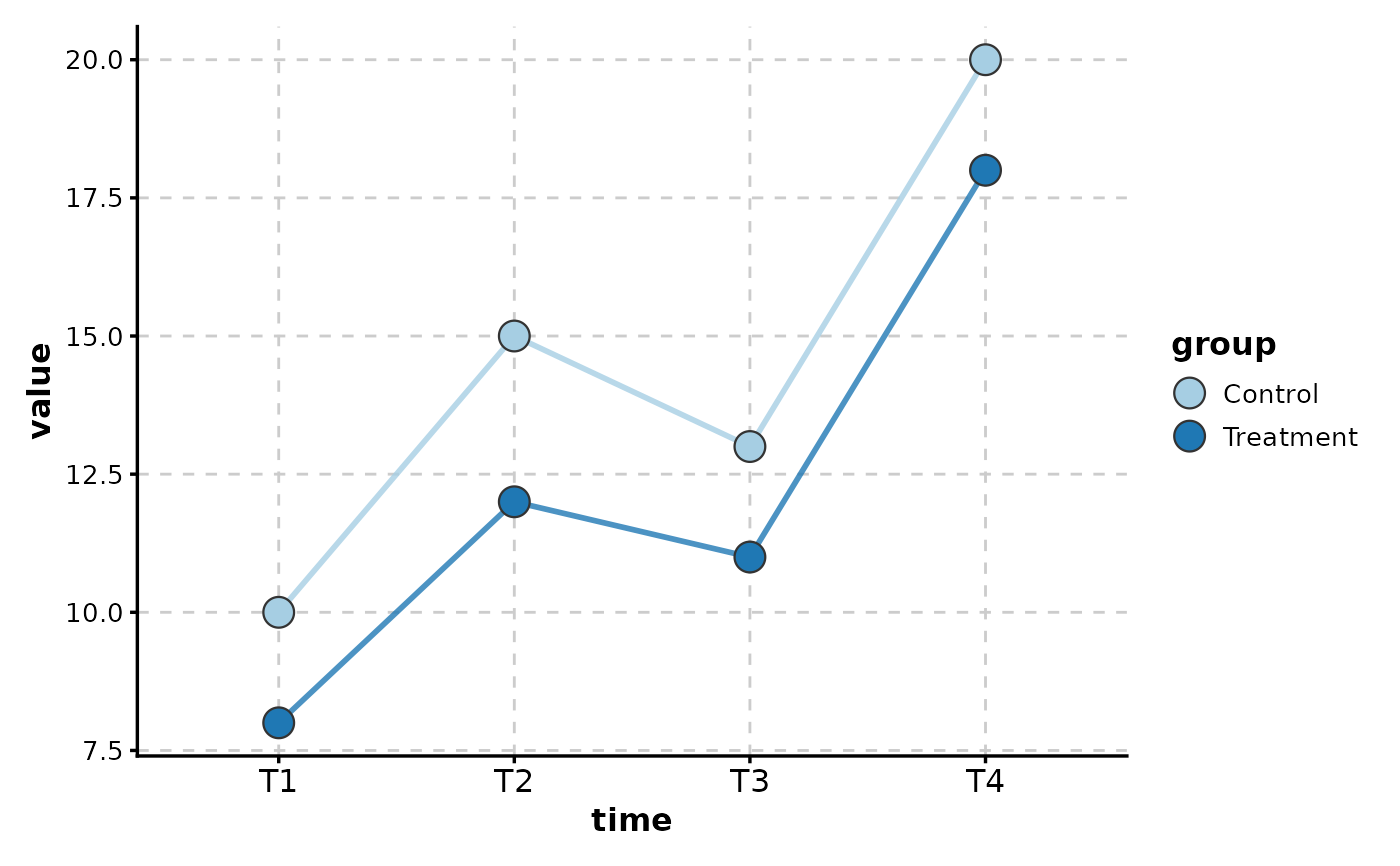
 # Grouped line plot
LinePlot(data, x = "time", y = "value", group_by = "group")
# Grouped line plot
LinePlot(data, x = "time", y = "value", group_by = "group")
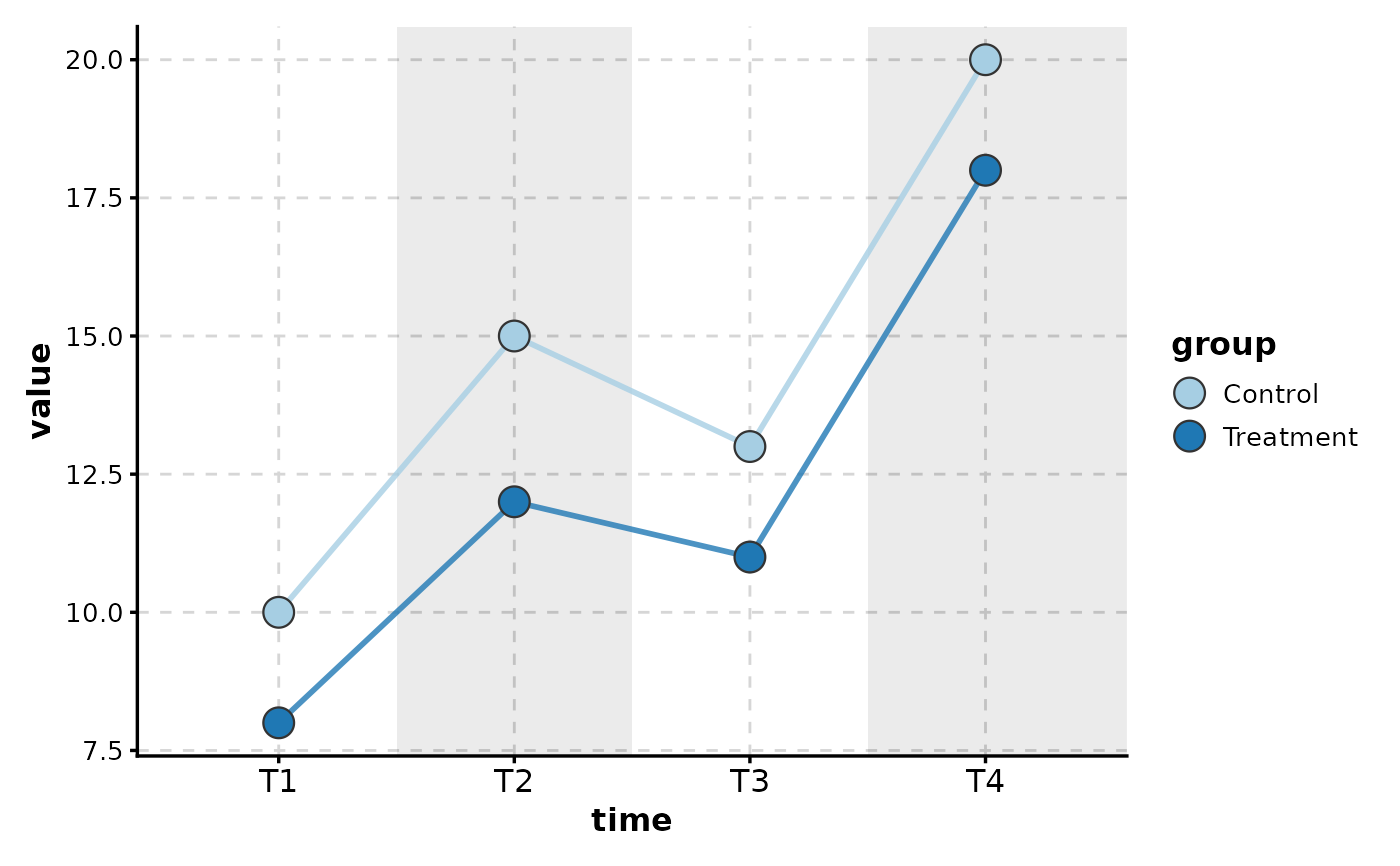
 # With background stripes
LinePlot(data, x = "time", y = "value", group_by = "group", add_bg = TRUE)
# With background stripes
LinePlot(data, x = "time", y = "value", group_by = "group", add_bg = TRUE)
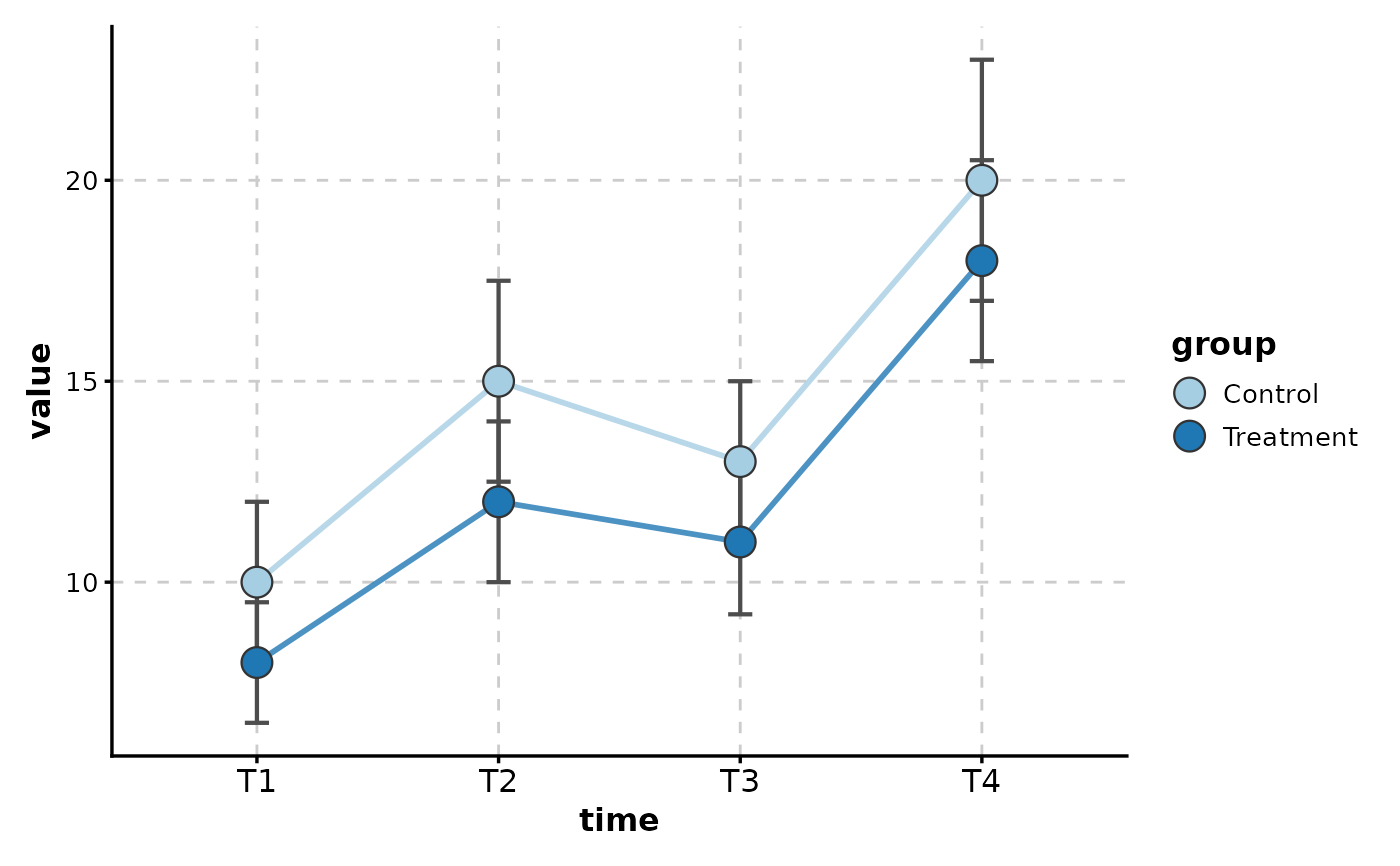
 # With error bars
data$sd <- c(2, 2.5, 2, 3, 1.5, 2, 1.8, 2.5)
LinePlot(
data,
x = "time",
y = "value",
group_by = "group",
add_errorbars = TRUE,
errorbar_sd = "sd"
)
# With error bars
data$sd <- c(2, 2.5, 2, 3, 1.5, 2, 1.8, 2.5)
LinePlot(
data,
x = "time",
y = "value",
group_by = "group",
add_errorbars = TRUE,
errorbar_sd = "sd"
)
 # With horizontal reference line
LinePlot(
data,
x = "time",
y = "value",
group_by = "group",
add_hline = 15,
hline_type = "dashed"
)
# With horizontal reference line
LinePlot(
data,
x = "time",
y = "value",
group_by = "group",
add_hline = 15,
hline_type = "dashed"
)
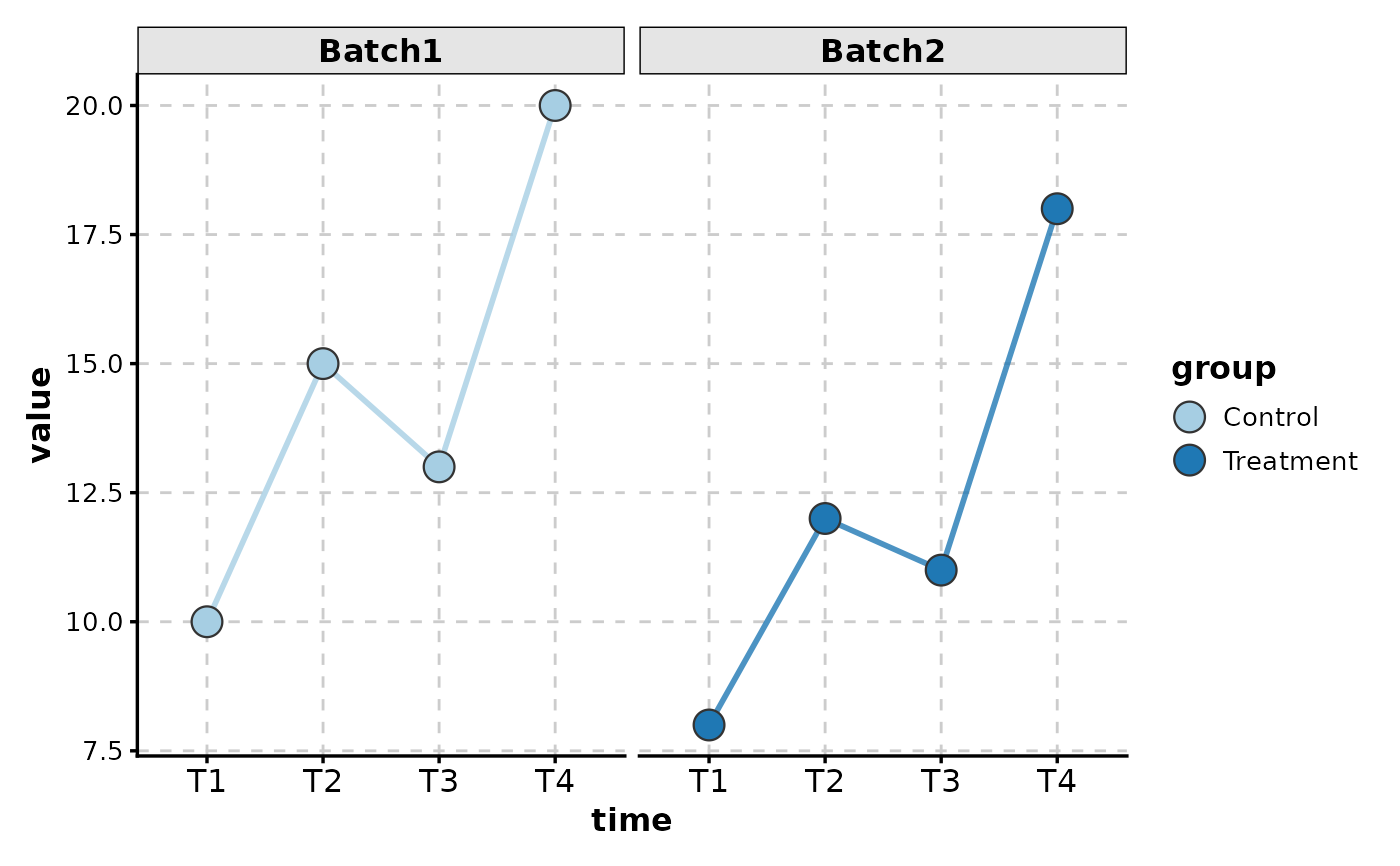
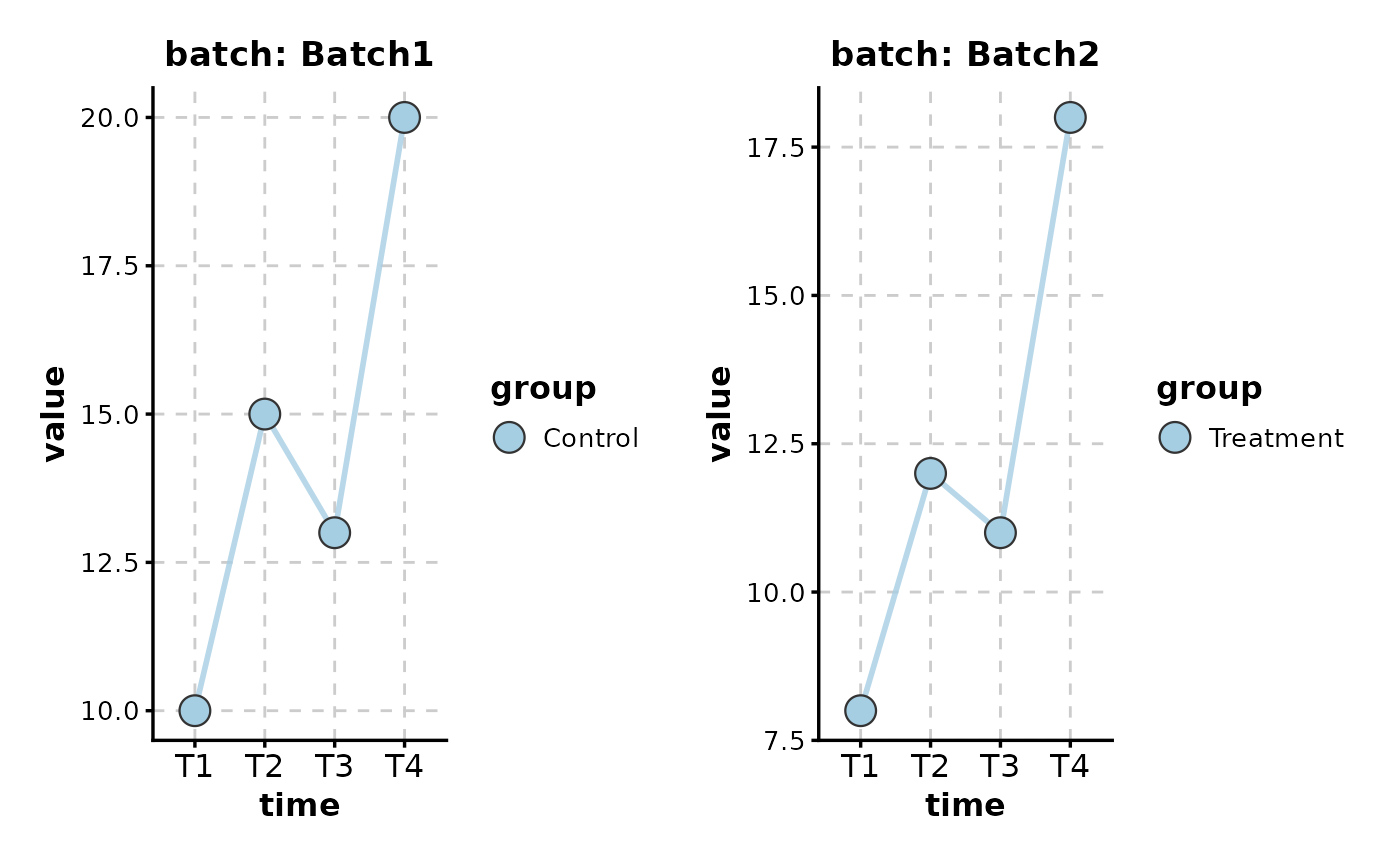
 # Split by another variable
data$batch <- rep(c("Batch1", "Batch2"), each = 4)
LinePlot(data, x = "time", y = "value", group_by = "group", split_by = "batch")
# Split by another variable
data$batch <- rep(c("Batch1", "Batch2"), each = 4)
LinePlot(data, x = "time", y = "value", group_by = "group", split_by = "batch")
 # Faceted plot
LinePlot(data, x = "time", y = "value", group_by = "group", facet_by = "batch")
# Faceted plot
LinePlot(data, x = "time", y = "value", group_by = "group", facet_by = "batch")